diff options
| author | Kelly <kellyz@google.com> | 2022-11-01 03:39:29 +0000 |
|---|---|---|
| committer | Automerger Merge Worker <android-build-automerger-merge-worker@system.gserviceaccount.com> | 2022-11-01 03:39:29 +0000 |
| commit | 1c08cdefd7e5222b88f76afb05515aa4879ad572 (patch) | |
| tree | 086abdb0b07f6ba13176d9e86d2aed4972ededfb | |
| parent | aca6ae00cb977c013bd7363d7018d6420bfe9bf9 (diff) | |
| parent | dfb4863b03b63f1a6a03688cf04df848d4edd904 (diff) | |
| download | MPAndroidChart-1c08cdefd7e5222b88f76afb05515aa4879ad572.tar.gz | |
Merge remote-tracking branch 'aosp/upstream-master' into HEAD am: 71cb3377d3 am: dfb4863b03
Original change: https://android-review.googlesource.com/c/platform/external/MPAndroidChart/+/2276409
Change-Id: Idca9b01f020ab5882207c7c5a6abfe0d43853224
Signed-off-by: Automerger Merge Worker <android-build-automerger-merge-worker@system.gserviceaccount.com>
386 files changed, 60784 insertions, 0 deletions
diff --git a/.github/FUNDING.yml b/.github/FUNDING.yml new file mode 100644 index 00000000..0a213d67 --- /dev/null +++ b/.github/FUNDING.yml @@ -0,0 +1,12 @@ +# These are supported funding model platforms + +github: # Replace with up to 4 GitHub Sponsors-enabled usernames e.g., [user1, user2] +patreon: mpandroidchart +open_collective: philippjahoda +ko_fi: # Replace with a single Ko-fi username +tidelift: # Replace with a single Tidelift platform-name/package-name e.g., npm/babel +community_bridge: # Replace with a single Community Bridge project-name e.g., cloud-foundry +liberapay: # Replace with a single Liberapay username +issuehunt: # Replace with a single IssueHunt username +otechie: # Replace with a single Otechie username +custom: # Replace with up to 4 custom sponsorship URLs e.g., ['link1', 'link2'] diff --git a/.github/ISSUE_TEMPLATE.md b/.github/ISSUE_TEMPLATE.md new file mode 100644 index 00000000..b75838b9 --- /dev/null +++ b/.github/ISSUE_TEMPLATE.md @@ -0,0 +1,37 @@ +<!--- +BEFORE YOU SUBMIT please read the following: + +Please search open/closed issues before submitting since someone might have asked +the same thing before! + +If you have a support request or question please submit them on StackOverflow: + https://stackoverflow.com/questions/tagged/mpandroidchart +using the tags `android` & `mpandroidchart` + +Please also look at the CONTRIBUTING file before opening an issue: + https://github.com/PhilJay/MPAndroidChart/blob/master/CONTRIBUTING.md + +Issues on GitHub are only related to problems with MPAndroidChart itself and we +cannot answer support questions here. We will close your issue without a response. +--> + +**Summary** +<!-- A clear and concise description of what the bug is. --> + +**Expected Behavior** +<!-- A clear and concise description of what you expected to happen. --> + +**Possible Solution** +<!-- Not required, but suggest a fix/ reason for the bug, --> +<!-- or ideas how to implement the addition or change --> + +**Device (please complete the following information):** + - Device: [e.g. Google Pixel] + - Android Version [e.g. 7.0] + - Library Version (e.g. 3.1.0-alpha) + +**Additional Context** +<!-- Add any other context about the problem here. +If you have source code demonstrating this bug, create a Gist: + https://help.github.com/articles/creating-gists/ +and link to it here. --> diff --git a/.github/ISSUE_TEMPLATE/Bug_report.md b/.github/ISSUE_TEMPLATE/Bug_report.md new file mode 100644 index 00000000..3a5938ee --- /dev/null +++ b/.github/ISSUE_TEMPLATE/Bug_report.md @@ -0,0 +1,44 @@ +---
+name: Bugs
+about: Create a bug report to help us improve
+
+---
+
+<!---
+BEFORE YOU SUBMIT please read the following:
+
+Please search open/closed issues before submitting since someone might have asked the same thing before!
+
+If you have a support request or question please submit them on StackOverflow:
+ https://stackoverflow.com/questions/tagged/mpandroidchart
+using the tags `android` & `mpandroidchart`
+
+Please also look at the CONTRIBUTING file before opening an issue:
+ https://github.com/PhilJay/MPAndroidChart/blob/master/CONTRIBUTING.md
+
+Issues on GitHub are only related to problems with MPAndroidChart itself and we cannot answer
+support questions here. We will close your issue without a response.
+-->
+
+**Summary**
+<!-- A clear and concise description of what the bug is. -->
+
+**Expected Behavior**
+<!-- A clear and concise description of what you expected to happen. -->
+
+**Possible Solution**
+<!-- Not required, but suggest a fix/ reason for the bug, -->
+<!-- or ideas how to implement the addition or change -->
+
+**Device (please complete the following information):**
+ - Device: [e.g. Google Pixel]
+ - Android Version [e.g. 7.0]
+ - Library Version (e.g. 3.1.0-alpha)
+
+**Additional Context**
+<!-- Add any other context about the problem here.
+If you have source code demonstrating this bug, create a Gist:
+ https://help.github.com/articles/creating-gists/
+and link to it here. -->
+
+ADD A REWARD using [Speed](speedoss.com) to SOLVE this issue QUICKLY and SUPPORT this project.
diff --git a/.github/ISSUE_TEMPLATE/Feature_request.md b/.github/ISSUE_TEMPLATE/Feature_request.md new file mode 100644 index 00000000..54b30c98 --- /dev/null +++ b/.github/ISSUE_TEMPLATE/Feature_request.md @@ -0,0 +1,34 @@ +---
+name: Feature Request
+about: Suggest an idea for this project
+
+---
+
+<!---
+BEFORE YOU SUBMIT please read the following:
+
+Please search open/closed issues before submitting since someone might have asked the same thing before!
+
+If you have a support request or question please submit them on StackOverflow:
+ https://stackoverflow.com/questions/tagged/mpandroidchart
+using the tags `android` & `mpandroidchart`
+
+Please also look at the CONTRIBUTING file before opening an issue:
+ https://github.com/PhilJay/MPAndroidChart/blob/master/CONTRIBUTING.md
+
+Issues on GitHub are only related to problems with MPAndroidChart itself and we cannot answer
+support questions here. We will close your issue without a response.
+-->
+
+**Is your feature request related to a problem? Please describe.**
+<!-- A clear and concise description of what the problem is. Ex. I'm always frustrated when [...] -->
+
+**Describe the solution you'd like**
+<!-- A clear and concise description of what you want to happen. -->
+
+**Describe alternatives you've considered**
+<!-- A clear and concise description of any alternative solutions or features you've considered. -->
+
+**Additional context**
+<!-- Add any other context or screenshots about the feature request here. -->
+ADD A REWARD using [Speed](speedoss.com) to SOLVE this issue QUICKLY and SUPPORT this project.
diff --git a/.github/ISSUE_TEMPLATE/Support_help.md b/.github/ISSUE_TEMPLATE/Support_help.md new file mode 100644 index 00000000..70a086d3 --- /dev/null +++ b/.github/ISSUE_TEMPLATE/Support_help.md @@ -0,0 +1,27 @@ +--- +name: Support +about: I need help! + +--- + +# *STOP RIGHT THERE!* + +Issues are ***NOT*** for getting help, only for reporting bugs and feature requests. + +Search open and closed issues to see if your question already has an answer. However, **do not create a new issue.** + +Instead, do the following: + +1. Download the [Example App](https://play.google.com/store/apps/details?id=com.xxmassdeveloper.mpchartexample) and check out the [source code](https://github.com/PhilJay/MPAndroidChart/tree/master/MPChartExample/src/com/xxmassdeveloper/mpchartexample). 90% of the time there is an example that does exactly what you are trying to do. + +1. Look at the [Wiki](https://github.com/PhilJay/MPAndroidChart/wiki) for the official documentation for MPAndroidChart. You can also browse the [javadoc](https://jitpack.io/com/github/philjay/mpandroidchart/v3.1.0-alpha/javadoc/) for a more detailed tutorial of the API. + +1. Go to [StackOverflow](https://stackoverflow.com/questions/tagged/mpandroidchart) and ask your questions there. The community will be much more helpful and willing to offer guidance. + + +### You have been warned! + +From now on, any issues asking for help will get closed with a link to this file. + +### Additional Context +ADD A REWARD using [Speed](speedoss.com) to SOLVE this issue QUICKLY and SUPPORT this project. diff --git a/.github/PULL_REQUEST_TEMPLATE.md b/.github/PULL_REQUEST_TEMPLATE.md new file mode 100644 index 00000000..f65a30b1 --- /dev/null +++ b/.github/PULL_REQUEST_TEMPLATE.md @@ -0,0 +1,15 @@ +## PR Checklist: +- [ ] I have tested this extensively and it does not break any existing behavior. +- [ ] I have added/updated examples and tests for any new behavior. +- [ ] If this is a significant change, an issue has already been created where the problem / solution was discussed: [N/A, or add link to issue here] + <!-- If you'd like to suggest a significant change, please + create an issue to discuss those changes and gather + feedback BEFORE submitting your PR. --> + + +## PR Description +<!-- Describe Your PR Here! --> + +<!-- What does this add/ remove/ fix/ change? --> + +<!-- WHY should this PR be merged into the main library? --> diff --git a/.gitignore b/.gitignore new file mode 100644 index 00000000..feed37b2 --- /dev/null +++ b/.gitignore @@ -0,0 +1,47 @@ +# built application files +*.apk +*.ap_ + +# files for the dex VM +*.dex + +# Java class files +*.class + +# generated files +bin/ +gen/ +generated/ +docs/ +finalOutput/ +projectFilesBackup/ + +build.xml + +# Local configuration file (sdk path, etc) +local.properties + +# Eclipse project files +.classpath +.project + +# Proguard folder generated by Eclipse +proguard/ + +# Intellij project files +*.iml +*.ipr +*.iws +.idea/ + +.directory + +# gradle wrapper working directory +.gradle + +build/ + +# maven +target/ + +.DS_Store diff --git a/.idea/runConfigurations/MPChartExample.xml b/.idea/runConfigurations/MPChartExample.xml new file mode 100644 index 00000000..e6bcf503 --- /dev/null +++ b/.idea/runConfigurations/MPChartExample.xml @@ -0,0 +1,52 @@ +<component name="ProjectRunConfigurationManager"> + <configuration default="false" name="MPChartExample" type="AndroidRunConfigurationType" factoryName="Android App" activateToolWindowBeforeRun="false"> + <module name="MPChartExample" /> + <option name="DEPLOY" value="true" /> + <option name="DEPLOY_APK_FROM_BUNDLE" value="false" /> + <option name="ARTIFACT_NAME" value="" /> + <option name="PM_INSTALL_OPTIONS" value="" /> + <option name="DYNAMIC_FEATURES_DISABLED_LIST" value="" /> + <option name="ACTIVITY_EXTRA_FLAGS" value="" /> + <option name="MODE" value="default_activity" /> + <option name="CLEAR_LOGCAT" value="false" /> + <option name="SHOW_LOGCAT_AUTOMATICALLY" value="false" /> + <option name="SKIP_NOOP_APK_INSTALLATIONS" value="true" /> + <option name="FORCE_STOP_RUNNING_APP" value="true" /> + <option name="TARGET_SELECTION_MODE" value="SHOW_DIALOG" /> + <option name="USE_LAST_SELECTED_DEVICE" value="false" /> + <option name="PREFERRED_AVD" value="" /> + <option name="SELECTED_CLOUD_MATRIX_CONFIGURATION_ID" value="-1" /> + <option name="SELECTED_CLOUD_MATRIX_PROJECT_ID" value="" /> + <option name="DEBUGGER_TYPE" value="Auto" /> + <Auto> + <option name="USE_JAVA_AWARE_DEBUGGER" value="false" /> + <option name="SHOW_STATIC_VARS" value="true" /> + <option name="WORKING_DIR" value="" /> + <option name="TARGET_LOGGING_CHANNELS" value="lldb process:gdb-remote packets" /> + <option name="SHOW_OPTIMIZED_WARNING" value="true" /> + </Auto> + <Hybrid> + <option name="USE_JAVA_AWARE_DEBUGGER" value="false" /> + <option name="SHOW_STATIC_VARS" value="true" /> + <option name="WORKING_DIR" value="" /> + <option name="TARGET_LOGGING_CHANNELS" value="lldb process:gdb-remote packets" /> + <option name="SHOW_OPTIMIZED_WARNING" value="true" /> + </Hybrid> + <Java /> + <Native> + <option name="USE_JAVA_AWARE_DEBUGGER" value="false" /> + <option name="SHOW_STATIC_VARS" value="true" /> + <option name="WORKING_DIR" value="" /> + <option name="TARGET_LOGGING_CHANNELS" value="lldb process:gdb-remote packets" /> + <option name="SHOW_OPTIMIZED_WARNING" value="true" /> + </Native> + <Profilers> + <option name="ADVANCED_PROFILING_ENABLED" value="false" /> + <option name="STARTUP_CPU_PROFILING_ENABLED" value="false" /> + <option name="STARTUP_CPU_PROFILING_CONFIGURATION_NAME" value="Sampled (Java)" /> + </Profilers> + <option name="DEEP_LINK" value="" /> + <option name="ACTIVITY_CLASS" value="" /> + <method /> + </configuration> +</component>
\ No newline at end of file diff --git a/CONTRIBUTING.md b/CONTRIBUTING.md new file mode 100644 index 00000000..98cf0ab8 --- /dev/null +++ b/CONTRIBUTING.md @@ -0,0 +1,66 @@ +> ### Notice +> *Before you continue, this is the* **ANDROID** *library. If you have an* **iOS** *device, please go here instead*: +> +> – https://github.com/danielgindi/Charts +> +> They might tell you to come back here, if they do, listen to them and ignore this notice. + +# How to contribute + +Bug-fixes and features often come from users of the MPAndroidChart library and improve it greatly. We want to keep it as easy as possible to contribute changes that improve the experience for users all around the world. There are a few guidelines that we need contributors to follow so that we can have a chance of keeping on top of things. + +## Creating Issues + +There are two main issue templates, one for bugs and another for feature requests. Please use them! You're issue will be much easier to understand, and bugs easier to fix, if you follow the templates. If your issue doesn't fit into those, just use the generic template. + +Search existing [issues] to see if your bug has already been reported or if a feature request already exists. Don't forget to remove `is:open` so you see all the issues! If you find that one already exists, use reactions to show how much you care! + +## Making Pull Requests + +Careful! If you fail to follow these guidlines, you're pull request may be closed, *even if it's really awesome*. + + 0. **Search** open [pull requests] AND existing [issues] to make sure what you want to do isn't already being worked on or already has an open pull request. + 1. **Fork** the repository + 1. **Create** a new branch based on `master`, and name it according to your changes + 1. **Add** your commits, they MUST follow the [Commit Style](#commit-style) below + 1. **Test** your changes by actually running the example app, or create a new example + 1. **Create** a pull request, following the auto-generated template + 1. ??? + 1. Profit :money_with_wings: + +You are encouraged to use [GitHub Desktop] to inspect your code changes before committing them. It can reveal small changes that might have gone unnoticed, and would be requested for removal before merging. + +Check out [#3975](https://github.com/PhilJay/MPAndroidChart/pull/3975) for an example of a good-made-better pull request. + +## Commit Style + + * **Make commits of logical units** + Don't load your commits with tons of changes, this makes it hard to follow what is happening. However, if you have done a lot of work, and there are commits and merges all over the place, squash them down into fewer commits. + + * **Conform to the code style** + It's easy, just look around! + + * **Write good commit messages** + You may prefer [Tim Pope's style], you might like the [commitizen-friendly] way. Regardless of the color you pick, you MUST stay within the lines! + ``` +The commit title CANNOT exceed 50 characters + +The body of the message comes after an empty new line, and describes the +changes more thoroughly. If the change is obvious and self-explanatory +from the title, you can omit the body. You should describe all changes +if many were made, or maybe some trickery that only code wizards can +understand. + +Be polite and wrap your lines to 72 characters, but if you prefer going +to 100 characters then I guess we can't stop you. +``` + +## Final Notes + +Thanks for reading the contributing file! Have some cake! :cake: + +[issues]: https://github.com/PhilJay/MPAndroidChart/issues +[pull requests]: https://github.com/PhilJay/MPAndroidChart/pulls +[GitHub Desktop]: https://desktop.github.com/ +[Tim Pope's style]: https://tbaggery.com/2008/04/19/a-note-about-git-commit-messages.html +[commitizen-friendly]: https://github.com/commitizen/cz-cli diff --git a/LICENSE b/LICENSE new file mode 100644 index 00000000..c1551a9d --- /dev/null +++ b/LICENSE @@ -0,0 +1,13 @@ + Copyright 2020 Philipp Jahoda + + Licensed under the Apache License, Version 2.0 (the "License"); + you may not use this software except in compliance with the License. + You may obtain a copy of the License at + + http://www.apache.org/licenses/LICENSE-2.0 + + Unless required by applicable law or agreed to in writing, software + distributed under the License is distributed on an "AS IS" BASIS, + WITHOUT WARRANTIES OR CONDITIONS OF ANY KIND, either express or implied. + See the License for the specific language governing permissions and + limitations under the License. diff --git a/MPChartExample/.gitignore b/MPChartExample/.gitignore new file mode 100644 index 00000000..67e07b8f --- /dev/null +++ b/MPChartExample/.gitignore @@ -0,0 +1,2 @@ +/build +/release diff --git a/MPChartExample/build.gradle b/MPChartExample/build.gradle new file mode 100644 index 00000000..2d607e99 --- /dev/null +++ b/MPChartExample/build.gradle @@ -0,0 +1,26 @@ +apply plugin: 'com.android.application' + +android { + compileSdkVersion 28 + defaultConfig { + applicationId "com.xxmassdeveloper.mpchartexample" + minSdkVersion 16 + targetSdkVersion 28 + versionCode 57 + versionName '3.1.0' + testInstrumentationRunner "androidx.test.runner.AndroidJUnitRunner" + } + + buildTypes { + release { + minifyEnabled false + proguardFiles getDefaultProguardFile('proguard-android.txt'), 'proguard-rules.pro' + } + } +} + +dependencies { + implementation "androidx.appcompat:appcompat:1.0.2" + implementation 'com.google.android.material:material:1.0.0' + implementation project(':MPChartLib') +} diff --git a/MPChartExample/proguard-rules.pro b/MPChartExample/proguard-rules.pro new file mode 100644 index 00000000..f1b42451 --- /dev/null +++ b/MPChartExample/proguard-rules.pro @@ -0,0 +1,21 @@ +# Add project specific ProGuard rules here. +# You can control the set of applied configuration files using the +# proguardFiles setting in build.gradle. +# +# For more details, see +# http://developer.android.com/guide/developing/tools/proguard.html + +# If your project uses WebView with JS, uncomment the following +# and specify the fully qualified class name to the JavaScript interface +# class: +#-keepclassmembers class fqcn.of.javascript.interface.for.webview { +# public *; +#} + +# Uncomment this to preserve the line number information for +# debugging stack traces. +#-keepattributes SourceFile,LineNumberTable + +# If you keep the line number information, uncomment this to +# hide the original source file name. +#-renamesourcefileattribute SourceFile diff --git a/MPChartExample/src/main/AndroidManifest.xml b/MPChartExample/src/main/AndroidManifest.xml new file mode 100644 index 00000000..99334e60 --- /dev/null +++ b/MPChartExample/src/main/AndroidManifest.xml @@ -0,0 +1,57 @@ +<?xml version="1.0" encoding="utf-8"?> +<manifest xmlns:android="http://schemas.android.com/apk/res/android" + package="com.xxmassdeveloper.mpchartexample"> + + <uses-permission android:name="android.permission.WRITE_EXTERNAL_STORAGE"/> + + <application + android:allowBackup="false" + android:hardwareAccelerated="true" + android:icon="@drawable/ic_launcher" + android:label="@string/app_name" + android:theme="@style/AppTheme"> + <activity + android:name="com.xxmassdeveloper.mpchartexample.notimportant.MainActivity" + android:label="@string/app_name" > + <intent-filter> + <action android:name="android.intent.action.MAIN" /> + <action android:name="android.intent.action.VIEW" /> + <category android:name="android.intent.category.LAUNCHER" /> + </intent-filter> + </activity> + <activity android:name="LineChartActivity1" /> + <activity android:name="LineChartActivity2" /> + <activity android:name="LineChartTime" /> + <activity android:name="BarChartActivity" /> + <activity android:name="HorizontalBarChartActivity" /> + <activity android:name="HorizontalBarNegativeChartActivity" /> + <activity android:name="PieChartActivity" /> + <activity android:name="PiePolylineChartActivity" /> + <activity android:name="MultiLineChartActivity" /> + <activity android:name="BarChartActivityMultiDataset" /> + <activity android:name="DrawChartActivity" /> + <activity android:name="ScatterChartActivity" /> + <activity android:name="BubbleChartActivity" /> + <activity android:name=".fragments.SimpleChartDemo" /> + <activity android:name="ListViewBarChartActivity" /> + <activity android:name="ListViewMultiChartActivity" /> + <activity android:name="StackedBarActivity" /> + <activity android:name="AnotherBarActivity" /> + <activity android:name="InvertedLineChartActivity" /> + <activity android:name="CandleStickChartActivity" /> + <activity android:name="CubicLineChartActivity" /> + <activity android:name="RadarChartActivity" /> + <activity android:name="LineChartActivityColored" /> + <activity android:name="DynamicalAddingActivity" /> + <activity android:name="RealtimeLineChartActivity" /> + <activity android:name="CombinedChartActivity" /> + <activity android:name="PerformanceLineChart" /> + <activity android:name="BarChartActivitySinus" /> + <activity android:name="ScrollViewActivity" /> + <activity android:name="StackedBarActivityNegative" /> + <activity android:name="BarChartPositiveNegative" /> + <activity android:name="FilledLineActivity" /> + <activity android:name="HalfPieChartActivity" /> + </application> + +</manifest> diff --git a/MPChartExample/src/main/assets/OpenSans-Bold.ttf b/MPChartExample/src/main/assets/OpenSans-Bold.ttf Binary files differnew file mode 100644 index 00000000..fd79d43b --- /dev/null +++ b/MPChartExample/src/main/assets/OpenSans-Bold.ttf diff --git a/MPChartExample/src/main/assets/OpenSans-BoldItalic.ttf b/MPChartExample/src/main/assets/OpenSans-BoldItalic.ttf Binary files differnew file mode 100644 index 00000000..9bc80095 --- /dev/null +++ b/MPChartExample/src/main/assets/OpenSans-BoldItalic.ttf diff --git a/MPChartExample/src/main/assets/OpenSans-ExtraBold.ttf b/MPChartExample/src/main/assets/OpenSans-ExtraBold.ttf Binary files differnew file mode 100644 index 00000000..21f6f84a --- /dev/null +++ b/MPChartExample/src/main/assets/OpenSans-ExtraBold.ttf diff --git a/MPChartExample/src/main/assets/OpenSans-ExtraBoldItalic.ttf b/MPChartExample/src/main/assets/OpenSans-ExtraBoldItalic.ttf Binary files differnew file mode 100644 index 00000000..31cb6883 --- /dev/null +++ b/MPChartExample/src/main/assets/OpenSans-ExtraBoldItalic.ttf diff --git a/MPChartExample/src/main/assets/OpenSans-Italic.ttf b/MPChartExample/src/main/assets/OpenSans-Italic.ttf Binary files differnew file mode 100644 index 00000000..c90da48f --- /dev/null +++ b/MPChartExample/src/main/assets/OpenSans-Italic.ttf diff --git a/MPChartExample/src/main/assets/OpenSans-Light.ttf b/MPChartExample/src/main/assets/OpenSans-Light.ttf Binary files differnew file mode 100644 index 00000000..0d381897 --- /dev/null +++ b/MPChartExample/src/main/assets/OpenSans-Light.ttf diff --git a/MPChartExample/src/main/assets/OpenSans-LightItalic.ttf b/MPChartExample/src/main/assets/OpenSans-LightItalic.ttf Binary files differnew file mode 100644 index 00000000..68299c4b --- /dev/null +++ b/MPChartExample/src/main/assets/OpenSans-LightItalic.ttf diff --git a/MPChartExample/src/main/assets/OpenSans-Regular.ttf b/MPChartExample/src/main/assets/OpenSans-Regular.ttf Binary files differnew file mode 100644 index 00000000..db433349 --- /dev/null +++ b/MPChartExample/src/main/assets/OpenSans-Regular.ttf diff --git a/MPChartExample/src/main/assets/OpenSans-Semibold.ttf b/MPChartExample/src/main/assets/OpenSans-Semibold.ttf Binary files differnew file mode 100644 index 00000000..1a7679e3 --- /dev/null +++ b/MPChartExample/src/main/assets/OpenSans-Semibold.ttf diff --git a/MPChartExample/src/main/assets/OpenSans-SemiboldItalic.ttf b/MPChartExample/src/main/assets/OpenSans-SemiboldItalic.ttf Binary files differnew file mode 100644 index 00000000..59b6d16b --- /dev/null +++ b/MPChartExample/src/main/assets/OpenSans-SemiboldItalic.ttf diff --git a/MPChartExample/src/main/assets/cosine.txt b/MPChartExample/src/main/assets/cosine.txt new file mode 100644 index 00000000..13112a4b --- /dev/null +++ b/MPChartExample/src/main/assets/cosine.txt @@ -0,0 +1,750 @@ +1.0#0 +0.9998000066755178#1 +0.9992001066967312#2 +0.9982005400156222#3 +0.996801706445518#4 +0.9950041651292624#5 +0.992808635283034#6 +0.990215996129463#7 +0.9872272839453933#8 +0.9838436941753507#9 +0.9800665802095645#10 +0.9758974528426302#11 +0.9713379796692108#12 +0.9663899805862244#13 +0.9610554379813293#14 +0.9553364856027305#15 +0.9492354109575819#16 +0.9427546543970131#17 +0.9358968081400203#18 +0.9286646152366127#19 +0.9210609684706269#20 +0.913088909202652#21 +0.904751626153523#22 +0.8960524541288755#23 +0.8869948726852646#24 +0.8775825047383886#25 +0.8678191299221538#26 +0.8577086396867667#27 +0.8472550780858032#28 +0.8364626263965502#29 +0.8253356014475525#30 +0.8138784538919424#31 +0.8020957664272419#32 +0.7899922519623475#33 +0.7775727517324336#34 +0.7648422333625261#35 +0.7518057888805234#36 +0.7384686326804557#37 +0.724836099436802#38 +0.7109136419706951#39 +0.6967068290688696#40 +0.6822213432562266#41 +0.667462978522903#42 +0.6524376380067577#43 +0.6371513316321991#44 +0.6216101737063007#45 +0.605820380473164#46 +0.5897882676275087#47 +0.5735202477884837#48 +0.5570228279347097#49 +0.54030260680158#50 +0.5233662722418589#51 +0.506220598550635#52 +0.48887244375569844#53 +0.47132874687442705#54 +0.45359652513827653#55 +0.4356828711859872#56 +0.4175949502266283#57 +0.3993399971736154#58 +0.3809253137508472#59 +0.36235826557211853#60 +0.34364627919497903#61 +0.3247968391502145#62 +0.3058174849481404#63 +0.2867158080629036#64 +0.2674994488960003#65 +0.2481760937202225#66 +0.22875347160525775#67 +0.2092393513261698#68 +0.18964153825599847#69 +0.16996787124372015#70 +0.1502262194788189#71 +0.1304244793437215#72 +0.11057057125535577#73 +0.09067243649709553#74 +0.07073803404235907#75 +0.050775337371132094#76 +0.03079233128068804#77 +0.01079700869178177#78 +-0.009202632548406111#79 +-0.02919859286529534#80 +-0.04918287415662309#81 +-0.06914748299157214#82 +-0.08908443380803052#83 +-0.10898575210670376#84 +-0.12884347764080226#85 +-0.1486496676000277#86 +-0.16839639978758542#87 +-0.18807577578895107#88 +-0.20767992413112554#89 +-0.22720100343111285#90 +-0.24663120553236303#91 +-0.2659627586279245#92 +-0.28518793036905754#93 +-0.3042990309580645#94 +-0.32328841622410065#95 +-0.3421484906807349#96 +-0.3608717105640369#97 +-0.37945058684997673#98 +-0.39787768824992864#99 +-0.4161456441830819#100 +-0.43424725510755136#101 +-0.4521750648543838#102 +-0.469922010949154#103 +-0.4874809948635857#104 +-0.5048449932516255#105 +-0.5220070607586818#106 +-0.5389603327996688#107 +-0.5556980283047446#108 +-0.5722134524316421#109 +-0.5884999992435129#110 +-0.6045511543512081#111 +-0.6203604975189423#112 +-0.6359217052322976#113 +-0.6512285532275404#114 +-0.6662749189812381#115 +-0.6810547841591839#116 +-0.6955622370236441#117 +-0.7097914747979706#118 +-0.7237368059876295#119 +-0.737392652656719#120 +-0.7507535526590651#121 +-0.7638141618230024#122 +-0.7765692560889685#123 +-0.7890137335990532#124 +-0.8011426167376704#125 +-0.8129510541225339#126 +-0.824434322545142#127 +-0.8355878288599945#128 +-0.8464071118217855#129 +-0.8568878438698396#130 +-0.8670258328590743#131 +-0.8768170237367994#132 +-0.886257500164681#133 +-0.8953434860852212#134 +-0.9040713472321283#135 +-0.912437592583972#136 +-0.9204388757605422#137 +-0.9280719963613548#138 +-0.9353339012457665#139 +-0.9422216857541875#140 +-0.948732594869905#141 +-0.9548640243210507#142 +-0.960613521622273#143 +-0.9659787870556967#144 +-0.9709576745907774#145 +-0.9755481927426838#146 +-0.979748505368863#147 +-0.9835569324034725#148 +-0.9869719505293822#149 +-0.98999219378748#150 +-0.9926164541230362#151 +-0.9948436818689081#152 +-0.9966729861653926#153 +-0.998103635316557#154 +-0.9991350570829072#155 +-0.9997668389102758#156 +-0.9999987280948375#157 +-0.9998306318841871#158 +-0.9992626175144392#159 +-0.9982949121833353#160 +-0.996927902959367#161 +-0.9951621366269541#162 +-0.9929983194677395#163 +-0.9904373169780857#164 +-0.9874801535228883#165 +-0.9841280119258453#166 +-0.9803822329963435#167 +-0.9762443149931541#168 +-0.97171591302515#169 +-0.9667988383892859#170 +-0.9614950578461049#171 +-0.9558066928330617#172 +-0.9497360186159785#173 +-0.9432854633789693#174 +-0.9364576072532017#175 +-0.9292551812848803#176 +-0.9216810663428666#177 +-0.9137382919663726#178 +-0.9054300351531868#179 +-0.8967596190889212#180 +-0.887730511817783#181 +-0.8783463248554058#182 +-0.8686108117442946#183 +-0.8585278665524617#184 +-0.8481015223158543#185 +-0.8373359494251967#186 +-0.8262354539578933#187 +-0.8148044759556579#188 +-0.8030475876485598#189 +-0.7909694916261961#190 +-0.7785750189567227#191 +-0.765869127254494#192 +-0.7528568986970883#193 +-0.7395435379925076#194 +-0.725934370297368#195 +-0.712034839086912#196 +-0.6978505039776957#197 +-0.6833870385038194#198 +-0.6686502278475953#199 +-0.653645966525555#200 +-0.6383800725148856#201 +-0.6228590159091549#202 +-0.6070888244769085#203 +-0.5910758060724219#204 +-0.5748263656773369#205 +-0.5583470028387585#206 +-0.5416443090695284#207 +-0.5247249652117124#208 +-0.5075957387643578#209 +-0.49026348117658924#210 +-0.47273512510712556#211 +-0.455017681651314#212 +-0.4371182375367911#213 +-0.4190439522888913#214 +-0.4008020553669378#215 +-0.3823998432725609#216 +-0.3638446766311999#217 +-0.34514397724795687#218 +-0.3263052251389793#219 +-0.3073359555395589#220 +-0.2882437558901438#221 +-0.26903626280146914#222 +-0.2497211590000209#223 +-0.230306170255053#224 +-0.210799062288389#225 +-0.19120763766824242#226 +-0.17153973268829978#227 +-0.1518032142333134#228 +-0.13200597663245844#229 +-0.11215593850171253#230 +-0.09226103957652096#231 +-0.07232923753601443#232 +-0.052368504820049594#233 +-0.032386825440345476#234 +-0.012392191786991334#235 +0.00760739856839673#236 +0.027603946071591657#237 +0.04758945238546438#238 +0.06755592358920592#239 +0.08749537337578304#240 +0.10739982624634846#241 +0.127261320700328#242 +0.14707191241990855#243 +0.16682367744765325#244 +0.18650871535597274#245 +0.2061191524071849#246 +0.22564714470289873#247 +0.24508488132146347#248 +0.26442458744222685#249 +0.28365852745535386#250 +0.30277900805596175#251 +0.32177838132133346#252 +0.3406490477699788#253 +0.35938345940131994#254 +0.3779741227147856#255 +0.39641360170710516#256 +0.4146945208466053#257 +0.43280956802331894#258 +0.4507514974737259#259 +0.4685131326789562#260 +0.48608736923529655#261 +0.5034671776958516#262 +0.5206456063822237#263 +0.5376157841650862#264 +0.5543709232125382#265 +0.5709043217051422#266 +0.5872093665165563#267 +0.6032795358586928#268 +0.6191084018903404#269 +0.6346896332882112#270 +0.6500169977793795#271 +0.6650843646341041#272 +0.6798857071180334#273 +0.6944151049028142#274 +0.7086667464341395#275 +0.7226349312562887#276 +0.7363140722922291#277 +0.749698698078368#278 +0.7627834549530611#279 +0.775563109198002#280 +0.7880325491316352#281 +0.8001867871537571#282 +0.8120209617404855#283 +0.8235303393888008#284 +0.8347103165098803#285 +0.8455564212704689#286 +0.8560643153815497#287 +0.866229795833598#288 +0.8760487965777259#289 +0.885517390152045#290 +0.8946317892525951#291 +0.9033883482482131#292 +0.9117835646387336#293 +0.9198140804559395#294 +0.9274766836067025#295 +0.934768309157775#296 +0.9416860405617193#297 +0.9482271108234865#298 +0.9543889036071753#299 +0.9601689542825289#300 +0.9655649509107532#301 +0.970574735169259#302 +0.9751963032149611#303 +0.9794278064857869#304 +0.9832675524400757#305 +0.9867140052335709#306 +0.9897657863337365#307 +0.9924216750711504#308 +0.9946806091277554#309 +0.9965416849617705#310 +0.9980041581690963#311 +0.9990674437810647#312 +0.9997311164984192#313 +0.9999949108614278#314 +0.9998587213560639#315 +0.9993226024562099#316 +0.9983867686018685#317 +0.9970515941133901#318 +0.9953176130417491#319 +0.9931855189549322#320 +0.9906561646605199#321 +0.987730561864576#322 +0.9844098807669794#323 +0.980695449593361#324 +0.9765887540638312#325 +0.9720914367987137#326 +0.9672052966615201#327 +0.9619322880394301#328 +0.956274520061564#329 +0.9502342557553608#330 +0.9438139111413991#331 +0.9370160542670232#332 +0.9298434041791597#333 +0.9222988298367378#334 +0.914385348963146#335 +0.9061061268391848#336 +0.8974644750369997#337 +0.8884638500954981#338 +0.8791078521377839#339 +0.8694002234311572#340 +0.8593448468902616#341 +0.8489457445239725#342 +0.8382070758266503#343 +0.8271331361144011#344 +0.8157283548070109#345 +0.8039972936562406#346 +0.7919446449211889#347 +0.779575229491455#348 +0.7668939949588511#349 +0.7539060136384351#350 +0.7406164805396558#351 +0.727030711288423#352 +0.7131541400009316#353 +0.6989923171100918#354 +0.6845509071454342#355 +0.6698356864673781#356 +0.6548525409567681#357 +0.6396074636606056#358 +0.6241065523949136#359 +0.6083560073056969#360 +0.5923621283889708#361 +0.5761313129708517#362 +0.5596700531487165#363 +0.5429849331944554#364 +0.5260826269208558#365 +0.5089698950121717#366 +0.4916535823199446#367 +0.4741406151251599#368 +0.4564379983678321#369 +0.43855281284512715#370 +0.42049221237914375#371 +0.4022634209554854#372 +0.3838737298337676#373 +0.36533049463121725#374 +0.346641132380529#375 +0.32781311856315715#376 +0.3088539841192281#377 +0.28977131243527066#378 +0.2705727363109682#379 +0.25126593490614646#380 +0.23185863066921794#381 +0.21235858624831114#382 +0.1927736013863209#383 +0.1731115098011213#384 +0.15338017605218865#385 +0.13358749239488882#386 +0.11374137562368615#387 +0.09384976390553743#388 +0.07392061360473688#389 +0.05396189610048263#390 +0.03398159459843745#391 +0.013987700937558934#392 +-0.0060117876065233595#393 +-0.026008871520305465#394 +-0.04599555225210164#395 +-0.0659638354113523#396 +-0.08590573396626752#397 +-0.10581327143852721#398 +-0.12567848509376003#399 +-0.14549342912652474#400 +-0.16525064811995077#401 +-0.18494176603177878#402 +-0.20455890631685353#403 +-0.22409422202143867#404 +-0.2435398989220372#405 +-0.26288815865111975#406 +-0.2821312618085105#407 +-0.3012615110571854#408 +-0.32027125420224567#409 +-0.3391528872518335#410 +-0.3578988574587669#411 +-0.37650166634167603#412 +-0.39495387268443305#413 +-0.4132480955126757#414 +-0.4313770170462337#415 +-0.44933338562627717#416 +-0.46711001861601636#417 +-0.48469980527379214#418 +-0.5020957095974079#419 +-0.5192907731385656#420 +-0.5362781177862795#421 +-0.5530509485181553#422 +-0.5696025561184319#423 +-0.5859263198617023#424 +-0.602015710161236#425 +-0.6178642911808461#426 +-0.6334657234092563#427 +-0.6488137661959366#428 +-0.6639022802473945#429 +-0.6787252300829233#430 +-0.6932766864488242#431 +-0.7075508286901373#432 +-0.7215419470789324#433 +-0.735244445098229#434 +-0.7486528416806302#435 +-0.7617617734007782#436 +-0.7745659966207497#437 +-0.787060389587538#438 +-0.7992399544817796#439 +-0.8110998194169068#440 +-0.822635240387926#441 +-0.8338416031690444#442 +-0.8447144251593824#443 +-0.8552493571760367#444 +-0.8654421851937745#445 +-0.8752888320306655#446 +-0.8847853589789743#447 +-0.8939279673806632#448 +-0.9027130001468745#449 +-0.9111369432207839#450 +-0.9191964269832412#451 +-0.9268882276006345#452 +-0.9342092683144392#453 +-0.9411566206719377#454 +-0.9477275056976144#455 +-0.9539192950047597#456 +-0.959729511846838#457 +-0.9651558321081987#458 +-0.9701960852337338#459 +-0.9748482550971108#460 +-0.9791104808072335#461 +-0.9829810574526074#462 +-0.9864584367833128#463 +-0.9895412278303127#464 +-0.9922281974618472#465 +-0.9945182708766922#466 +-0.9964105320340856#467 +-0.9979042240201477#468 +-0.998998749350651#469 +-0.9996936702100165#470 +-0.9999887086264423#471 +-0.9998837465830935#472 +-0.9993788260653099#473 +-0.9984741490438113#474 +-0.9971700773939082#475 +-0.99546713275075#476 +-0.9933659963006688#477 +-0.9908675085087004#478 +-0.9879726687823952#479 +-0.9846826350720495#480 +-0.9809987234075198#481 +-0.9769224073718046#482 +-0.9724553175116033#483 +-0.9675992406850901#484 +-0.9623561193471611#485 +-0.9567280507724435#486 +-0.9507172862163743#487 +-0.9443262300146881#488 +-0.9375574386216696#489 +-0.9304136195875602#490 +-0.922897630475524#491 +-0.915012477718608#492 +-0.9067613154171548#493 +-0.8981474440771456#494 +-0.8891743092899825#495 +-0.879845500354234#496 +-0.8701647488398982#497 +-0.8601359270957558#498 +-0.8497630467004118#499 +-0.8390502568576437#500 +-0.8280018427366993#501 +-0.8166222237582085#502 +-0.8049159518263918#503 +-0.7928877095082767#504 +-0.7805423081606475#505 +-0.767884686005479#506 +-0.7549199061546221#507 +-0.7416531545845351#508 +-0.728089738061866#509 +-0.7142350820207211#510 +-0.7000947283924623#511 +-0.6856743333889093#512 +-0.6709796652398244#513 +-0.6560166018855939#514 +-0.640791128626021#515 +-0.6253093357261775#516 +-0.6095774159802665#517 +-0.5936016622344745#518 +-0.5773884648698012#519 +-0.5609443092458755#520 +-0.5442757731067793#521 +-0.5273895239499172#522 +-0.5102923163589844#523 +-0.4929909893020995#524 +-0.4754924633961832#525 +-0.4578037381386771#526 +-0.4399318891077101#527 +-0.42188406513183174#528 +-0.4036674854304451#529 +-0.3852894367260835#530 +-0.36675727032968475#531 +-0.3480783992000305#532 +-0.3292602949785258#533 +-0.3103104850005053#534 +-0.2912365492842617#535 +-0.27204611749900054#536 +-0.25274686591293494#537 +-0.23334651432273967#538 +-0.21385282296559432#539 +-0.19427358941504982#540 +-0.17461664546196007#541 +-0.1548898539817267#542 +-0.13510110578910986#543 +-0.11525831648186291#544 +-0.09536942327445402#545 +-0.07544238182314085#546 +-0.05548516304366845#547 +-0.03550574992286332#548 +-0.015512134325398927#549 +0.004487686202989896#550 +0.02448571163456509#551 +0.04447394265963625#552 +0.06444438388632431#553 +0.08438904703875809#554 +0.10429995415242439#555 +0.1241691407653935#556 +0.1439886591041436#557 +0.16375058126270975#558 +0.18344700237388564#559 +0.20307004377121#560 +0.2226118561404721#561 +0.2420646226594768#562 +0.2614205621248122#563 +0.28067193206436947#564 +0.29981103183437086#565 +0.31883020569966475#566 +0.3377218458960585#567 +0.35647839567346157#568 +0.3750923523186232#569 +0.3935562701562553#570 +0.41186276352733925#571 +0.4300045097434266#572 +0.44797425201575064#573 +0.46576480235797824#574 +0.4833690444614399#575 +0.500779936541689#576 +0.5179905141552499#577 +0.5349938929854311#578 +0.5517832715960851#579 +0.5683519341522173#580 +0.5846932531063534#581 +0.6008006918495911#582 +0.6166678073262762#583 +0.6322882526112575#584 +0.6476557794486876#585 +0.6627642407513568#586 +0.6776075930595586#587 +0.6921798989585037#588 +0.706475329453315#589 +0.7204881663006553#590 +0.7342128042960522#591 +0.7476437535160088#592 +0.7607756415139992#593 +0.7736032154694754#594 +0.7861213442890201#595 +0.7983250206588106#596 +0.8102093630475687#597 +0.8217696176591981#598 +0.8330011603343257#599 +0.8438994983999891#600 +0.854460272466728#601 +0.8646792581723609#602 +0.8745523678717522#603 +0.8840756522718898#604 +0.893245302011622#605 +0.9020576491854215#606 +0.910509168810565#607 +0.9185964802371446#608 +0.926316348500344#609 +0.9336656856144409#610 +0.9406415518080167#611 +0.9472411566998794#612 +0.95346186041523#613 +0.9593011746416258#614 +0.9647567636243177#615 +0.9698264451005635#616 +0.974508191172544#617 +0.9788001291185322#618 +0.9827005421419915#619 +0.9862078700583026#620 +0.989320709918845#621 +0.9920378165721839#622 +0.9943581031621368#623 +0.9962806415625208#624 +0.9978046627484086#625 +0.9989295571037418#626 +0.9996548746651802#627 +0.9999803253020899#628 +0.9999057788325965#629 +0.9994312650756588#630 +0.998556973839141#631 +0.9972832548438884#632 +0.9956106175838376#633 +0.9935397311222164#634 +0.9910714238239149#635 +0.9882066830241357#636 +0.9849466546334548#637 +0.9812926426794514#638 +0.9772461087850911#639 +0.9728086715840686#640 +0.9679821060733467#641 +0.9627683429031486#642 +0.9571694676046879#643 +0.9511877197559462#644 +0.9448254920858304#645 +0.9380853295170695#646 +0.9309699281482325#647 +0.923482134175276#648 +0.9156249427530513#649 +0.9074014967972275#650 +0.8988150857271101#651 +0.8898691441498562#652 +0.8805672504866153#653 +0.8709131255411423#654 +0.8609106310114581#655 +0.8505637679451508#656 +0.8398766751389367#657 +0.8288536274831215#658 +0.8174990342516223#659 +0.8058174373382364#660 +0.7938135094398614#661 +0.7814920521873926#662 +0.7688579942250473#663 +0.7559163892388825#664 +0.7426724139352946#665 +0.7291313659703125#666 +0.7152986618305073#667 +0.7011798346663719#668 +0.6867805320790326#669 +0.6721065138611806#670 +0.6571636496931266#671 +0.6419579167948992#672 +0.6264953975353273#673 +0.610782276999062#674 +0.5948248405125122#675 +0.5786294711296829#676 +0.5622026470789215#677 +0.5455509391715946#678 +0.52868100817373#679 +0.5115996021416783#680 +0.49431355372285585#681 +0.4768297774226521#682 +0.45915526683859303#683 +0.44129709186286736#684 +0.4232623958543345#685 +0.4050583927811453#686 +0.3866923643351191#687 +0.36817165701903065#688 +0.34950367920797243#689 +0.3306958981859679#690 +0.31175583715902044#691 +0.2926910722457939#692 +0.2735092294471269#693 +0.2542179815955952#694 +0.23482504528633993#695 +0.21533817779039144#696 +0.19576517395172216#697 +0.17611386306927027#698 +0.15639210576518112#699 +0.13660779084051936#700 +0.11676883211970907#701 +0.0968831652849648#702 +0.07695874470197908#703 +0.057003540238136606#704 +0.03702553407452759#705 +0.017032717513035638#706 +-0.002966912220222811#707 +-0.022965355173828687#708 +-0.0429546118710807#709 +-0.06292668650982579#710 +-0.08287359016081984#711 +-0.10278734396333908#712 +-0.12265998231676409#713 +-0.1424835560668597#714 +-0.1622501356854762#715 +-0.18195181444240016#716 +-0.20158071156808577#717 +-0.2211289754060019#718 +-0.2405887865533338#719 +-0.2599523609887831#720 +-0.2792119531862151#721 +-0.2983598592129078#722 +-0.3173884198111633#723 +-0.33629002346204884#724 +-0.3550571094300426#725 +-0.37368217078736515#726 +-0.39215775741678827#727 +-0.4104764789917186#728 +-0.4286310079323652#729 +-0.446614082336808#730 +-0.46441850888579467#731 +-0.48203716572010397#732 +-0.4994630052893251#733 +-0.5166890571709126#734 +-0.5337084308583907#735 +-0.5505143185175893#736 +-0.5670999977098123#737 +-0.5834588340808463#738 +-0.5995842840147351#739 +-0.6154698972512584#740 +-0.6311093194660693#741 +-0.6464962948124537#742 +-0.6616246684237019#743 +-0.6764883888750848#744 +-0.6910815106044541#745 +-0.7053981962904975#746 +-0.719432719187695#747 +-0.7331794654170467#748 +-0.7466329362116519#749
\ No newline at end of file diff --git a/MPChartExample/src/main/assets/hugecosine.txt b/MPChartExample/src/main/assets/hugecosine.txt new file mode 100644 index 00000000..ea6cc6d7 --- /dev/null +++ b/MPChartExample/src/main/assets/hugecosine.txt @@ -0,0 +1,2696 @@ +1.0#0 +0.9999875000266004#1 +0.9999500004189004#2 +0.9998875021143881#3 +0.9998000066755178#4 +0.9996875162663903#5 +0.9995500337132301#6 +0.9993875625182742#7 +0.9992001066967312#8 +0.9989876709349848#9 +0.9987502605439158#10 +0.9984878814587691#11 +0.9982005402390055#12 +0.997888243826164#13 +0.997551000232435#14 +0.9971888178888995#15 +0.9968017058501071#16 +0.996389673793849#17 +0.995952732020916#18 +0.9954908914548417#19 +0.9950041636416285#20 +0.9944925607494591#21 +0.9939560955683934#22 +0.9933947815100469#23 +0.9928086326072573#24 +0.9921976635137321#25 +0.991561890469533#26 +0.9909013284769972#27 +0.9902159940501084#28 +0.9895059043221591#29 +0.9887710770453216#30 +0.9880115305902044#31 +0.9872272839453933#32 +0.986418356716976#33 +0.9855847691280525#34 +0.9847265420182294#35 +0.9838436968430989#36 +0.9829362556737022#37 +0.9820042411959782#38 +0.9810476767101955#39 +0.9800665861303712#40 +0.9790609939836716#41 +0.9780309254098003#42 +0.9769764061603686#43 +0.9758974625982528#44 +0.9747941216969342#45 +0.9736664110398252#46 +0.9725143588195798#47 +0.9713379938373885#48 +0.9701373455022586#49 +0.9689124438302785#50 +0.9676633194438681#51 +0.9663900035710121#52 +0.9650925280444805#53 +0.963770925301032#54 +0.9624252283806033#55 +0.9610554709254832#56 +0.9596616871794713#57 +0.9582439119870223#58 +0.9568021807923746#59 +0.955336529638664#60 +0.9538469951670234#61 +0.9523336146156658#62 +0.9507964258189542#63 +0.9492354672064549#64 +0.9476507778019777#65 +0.9460423972225994#66 +0.9444103656776743#67 +0.942754723967828#68 +0.941075513483938#69 +0.9393727762060992#70 +0.9376465547025732#71 +0.9358968921287257#72 +0.9341238322259465#73 +0.9323274193205561#74 +0.930507698322698#75 +0.9286647147252156#76 +0.926798514602515#77 +0.924909144609413#78 +0.9229966519799709#79 +0.9210610845263139#80 +0.9191024906374349#81 +0.9171209192779859#82 +0.9151164199870532#83 +0.9130890428769189#84 +0.9110388386318088#85 +0.9089658585066243#86 +0.9068701543256616#87 +0.9047517784813164#88 +0.9026107839327733#89 +0.9004472242046825#90 +0.8982611533858212#91 +0.8960526261277421#92 +0.8938216976434059#93 +0.8915684237058024#94 +0.8892928606465551#95 +0.8869950653545136#96 +0.8846750952743309#97 +0.8823330084050275#98 +0.8799688632985414#99 +0.8775827190582647#100 +0.875174620918988#101 +0.872744657789488#102 +0.8702928761306141#103 +0.8678193372366634#104 +0.8653241029458612#105 +0.862807235638816#106 +0.8602687982369593#107 +0.857708854200973#108 +0.8551274675292025#109 +0.8525247027560572#110 +0.8499006249503964#111 +0.8472552997139039#112 +0.8445887931794465#113 +0.8419011720094214#114 +0.8391925033940898#115 +0.836462855049897#116 +0.8337122952177791#117 +0.8309408926614577#118 +0.8281487166657199#119 +0.8253358370346872#120 +0.8225023240900697#121 +0.8196482486694084#122 +0.8167736821243041#123 +0.8138786963186335#124 +0.8109633636267531#125 +0.8080277569316892#126 +0.8050719496233163#127 +0.8020960155965222#128 +0.7991000292493609#129 +0.7960840654811918#130 +0.7930481996908085#131 +0.7899925077745529#132 +0.7869170661244178#133 +0.7838219516261379#134 +0.7807072416572667#135 +0.7775730140852427#136 +0.7744193472654425#137 +0.771246320039222#138 +0.7680540117319453#139 +0.7648425021510016#140 +0.7616118715838099#141 +0.7583622007958123#142 +0.7550935710284542#143 +0.7518060639971536#144 +0.7484997618892583#145 +0.7451747473619912#146 +0.7418311035403837#147 +0.7384689140151978#148 +0.7350882628408362#149 +0.731689234533241#150 +0.7282719140677808#151 +0.7248363868771261#152 +0.7213827388491142#153 +0.7179110563246011#154 +0.7144214260953035#155 +0.7109139354016291#156 +0.7073886719304953#157 +0.703845723813137#158 +0.7002851796229038#159 +0.6967071283730453#160 +0.6931116595144857#161 +0.6894988629335878#162 +0.6858688289499055#163 +0.6822216483139265#164 +0.6785574122048027#165 +0.6748762122280713#166 +0.6711781404133643#167 +0.6674632892121084#168 +0.6637317514952128#169 +0.6599836205507482#170 +0.6562189900816142#171 +0.6524379542031972#172 +0.6486406074410166#173 +0.6448270447283628#174 +0.6409973614039232#175 +0.6371516532093986#176 +0.6332900162871105#177 +0.6294125471775964#178 +0.6255193428171973#179 +0.6216105005356339#180 +0.6176861180535732#181 +0.6137462934801857#182 +0.6097911253106927#183 +0.6058207124239038#184 +0.6018351540797451#185 +0.5978345499167776#186 +0.5938189999497062#187 +0.5897886045668794#188 +0.5857434645277798#189 +0.5816836809605047#190 +0.5776093553592384#191 +0.5735205895817143#192 +0.569417485846669#193 +0.5653001467312864#194 +0.5611686751686337#195 +0.5570231744450878#196 +0.5528637481977532#197 +0.5486905004118711#198 +0.5445035354182197#199 +0.5403029578905063#200 +0.5360888225267997#201 +0.531861335151569#202 +0.5276205512960215#203 +0.5233665769793306#204 +0.5190995185504299#205 +0.5148194826853544#206 +0.5105265763845734#207 +0.5062209069703166#208 +0.5019025820838895#209 +0.49757170968298353#210 +0.4932283980389766#211 +0.4888727557342265#212 +0.48450489165935634#213 +0.48012491501053217#214 +0.4757329352867332#215 +0.4713290622870145#216 +0.46691340610776155#217 +0.4624860771399384#218 +0.45804718606632744#219 +0.45359684385876275#220 +0.4491351617753555#221 +0.44466225135771265#222 +0.4401782244281483#223 +0.4356831930868885#224 +0.4311772697092682#225 +0.4266605669429223#226 +0.4221331977049695#227 +0.4175952751791888#228 +0.41304691281319084#229 +0.4084882243155809#230 +0.40391932365311667#231 +0.39934032504785877#232 +0.39475134297431563#233 +0.39015249215658115#234 +0.3855438875654671#235 +0.3809256444156283#236 +0.37629787816268284#237 +0.3716607045003254#238 +0.3670142393574348#239 +0.36235859889517613#240 +0.3576938995040964#241 +0.35302025780121504#242 +0.3483377906271084#243 +0.34364661504298855#244 +0.33894684832777716#245 +0.33423860797517324#246 +0.3295220116907158#247 +0.3247971773888415#248 +0.32006422318993644#249 +0.3153232674173834#250 +0.3105744285946037#251 +0.3058178254420942#252 +0.30105357687445905#253 +0.2962818019974372#254 +0.2915026201049245#255 +0.2867161506759915#256 +0.2819225133718963#257 +0.2771218280330933#258 +0.272314214676237#259 +0.2674997934911818#260 +0.26267868483797685#261 +0.25785100924385757#262 +0.25301688740023215#263 +0.24817644015966442#264 +0.24332978853285245#265 +0.2384770536856034#266 +0.2336183569358043#267 +0.22875381975038914#268 +0.22388356374230226#269 +0.21900771066745797#270 +0.2141263824216967#271 +0.2092397010377376#272 +0.2043477886821277#273 +0.19945076765218786#274 +0.1945487603729553#275 +0.1896418893941229#276 +0.18473027738697562#277 +0.17981404714132362#278 +0.17489332156243254#279 +0.16996822366795095#280 +0.16503887658483485#281 +0.16010540354626954#282 +0.15516792788858874#283 +0.15022657304819137#284 +0.1452814625584554#285 +0.1403327200466497#286 +0.13538046923084343#287 +0.13042483391681284#288 +0.12546593799494637#289 +0.1205039054371474#290 +0.11553886029373478#291 +0.11057092669034174#292 +0.10560022882481276#293 +0.10062689096409856#294 +0.09565103744114947#295 +0.09067279265180715#296 +0.08569228105169467#297 +0.08070962715310513#298 +0.07572495552188892#299 +0.07073839077433948#300 +0.06575005757407804#301 +0.06076008062893691#302 +0.0557685846878419#303 +0.05077569453769354#304 +0.04578153500024747#305 +0.04078623092899386#306 +0.03578990720603615#307 +0.030792688738968926#308 +0.025794700457755317#309 +0.02079606731160372#310 +0.01579691426584409#311 +0.010797366298803818#312 +0.005797548398683295#313 +7.975855604312091E-4#314 +-0.004202397217380315#315 +-0.009202274935680665#316 +-0.014201922598025704#317 +-0.019201215213722672#318 +-0.02420002780095494#319 +-0.029198235389906547#320 +-0.034195713025886414#321 +-0.039192335772452236#322 +-0.04418797871453384#323 +-0.049182516961556066#324 +-0.05417582565056104#325 +-0.0591677799493297#326 +-0.06415825505950261#327 +-0.06914712621969989#328 +-0.07413426870864026#329 +-0.07911955784825905#330 +-0.08410286900682513#331 +-0.08908407760205674#332 +-0.0940630591042359#333 +-0.09903968903932184#334 +-0.10401384299206266#335 +-0.10898539660910582#336 +-0.11395422560210687#337 +-0.1189202057508367#338 +-0.12388321290628707#339 +-0.12884312299377418#340 +-0.13379981201604074#341 +-0.13875315605635566#342 +-0.14370303128161213#343 +-0.14864931394542336#344 +-0.15359188039121618#345 +-0.15853060705532263#346 +-0.16346537047006876#347 +-0.16839604726686158#348 +-0.17332251417927305#349 +-0.17824464804612186#350 +-0.1831623258145524#351 +-0.18807542454311113#352 +-0.19298382140481993#353 +-0.197887393690247#354 +-0.2027860188105744#355 +-0.20767957430066283#356 +-0.21256793782211328#357 +-0.2174509871663254#358 +-0.22232860025755274#359 +-0.22720065515595467#360 +-0.23206703006064475#361 +-0.2369276033127359#362 +-0.24178225339838175#363 +-0.24663085895181447#364 +-0.251473298758379#365 +-0.2563094517575632#366 +-0.2611391970460246#367 +-0.265962413880613#368 +-0.2707789816813885#369 +-0.2755887800346367#370 +-0.28039168869587866#371 +-0.28518758759287705#372 +-0.2899763568286378#373 +-0.2947578766844079#374 +-0.2995320276226679#375 +-0.3042986902901207#376 +-0.3090577455206751#377 +-0.3138090743384252#378 +-0.3185525579606246#379 +-0.32328807780065594#380 +-0.32801551547099567#381 +-0.33273475278617365#382 +-0.3374456717657279#383 +-0.3421481546371538#384 +-0.34684208383884885#385 +-0.35152734202305125#386 +-0.3562038120587738#387 +-0.3608713770347322#388 +-0.3655299202622677#389 +-0.3701793252782644#390 +-0.3748194758480608#391 +-0.37945025596835547#392 +-0.38407154987010744#393 +-0.3886832420214303#394 +-0.39328521713048026#395 +-0.3978773601483388#396 +-0.4024595562718885#397 +-0.40703169094668357#398 +-0.41159364986981317#399 +-0.41614531899275947#400 +-0.4206866926716328#401 +-0.42521754872365886#402 +-0.4297377738724872#403 +-0.43424725510755136#404 +-0.43874587968689477#405 +-0.44323353513998887#406 +-0.4477101092705453#407 +-0.4521754901593209#408 +-0.45662956616691575#409 +-0.46107222593656433#410 +-0.4655033583969195#411 +-0.46992285276482954#412 +-0.4743305985481076#413 +-0.47872648554829444#414 +-0.48311040386341325#415 +-0.4874822438907175#416 +-0.49184189632943087#417 +-0.4961892521834803#418 +-0.5005242027642206#419 +-0.5048466396931521#420 +-0.5091564549046301#421 +-0.5134535406485664#422 +-0.5177377894931237#423 +-0.5220090943274008#424 +-0.5262673483641115#425 +-0.5305124451422532#426 +-0.5347442785297694#427 +-0.5389627427262028#428 +-0.5431677322653408#429 +-0.5473591420178513#430 +-0.5515368671939123#431 +-0.5557008033458308#432 +-0.5598508463706547#433 +-0.5639868925127751#434 +-0.5681088383665206#435 +-0.572216580878742#436 +-0.5763100173513899#437 +-0.5803890454440808#438 +-0.5844535631766568#439 +-0.5885034689317347#440 +-0.5925386614572468#441 +-0.5965590398689722#442 +-0.6005645036530591#443 +-0.6045549526685374#444 +-0.608530287149823#445 +-0.6124904077092115#446 +-0.616435215339363#447 +-0.6203646114157777#448 +-0.6242784976992615#449 +-0.628176776338382#450 +-0.6320593498719151#451 +-0.6359261212312813#452 +-0.639776993742973#453 +-0.6436118711309707#454 +-0.6474306575191509#455 +-0.6512332574336824#456 +-0.6550195758054138#457 +-0.6587895179722497#458 +-0.6625429896815179#459 +-0.6662798970923258#460 +-0.670000146777906#461 +-0.6737036457279527#462 +-0.6773903013509467#463 +-0.6810600214764702#464 +-0.6847127143575117#465 +-0.6883482886727591#466 +-0.6919666535288833#467 +-0.6955677184628104#468 +-0.6991513934439836#469 +-0.7027175888766136#470 +-0.7062662156019193#471 +-0.7097971849003561#472 +-0.7133104084938348#473 +-0.7168057985479276#474 +-0.7202832676740654#475 +-0.7237427289317211#476 +-0.7271840958305846#477 +-0.7306072823327243#478 +-0.7340122028547384#479 +-0.7373987722698945#480 +-0.7407669059102578#481 +-0.7441165195688084#482 +-0.7474475295015458#483 +-0.7507598524295832#484 +-0.7540534055412291#485 +-0.7573281064940582#486 +-0.7605838734169695#487 +-0.7638206249122337#488 +-0.7670382800575276#489 +-0.7702367584079579#490 +-0.773415979998072#491 +-0.7765758653438575#492 +-0.779716335444729#493 +-0.7828373117855034#494 +-0.7859387163383633#495 +-0.789020471564807#496 +-0.7920825004175875#497 +-0.7951247263426388#498 +-0.7981470732809895#499 +-0.8011494656706649#500 +-0.8041318284485754#501 +-0.8070940870523942#502 +-0.81003616742242#503 +-0.8129579960034301#504 +-0.8158594997465183#505 +-0.8187406061109216#506 +-0.8216012430658337#507 +-0.824441339092206#508 +-0.8272608231845355#509 +-0.8300596248526401#510 +-0.8328376741234209#511 +-0.8355949015426114#512 +-0.8383312381765146#513 +-0.8410466156137254#514 +-0.8437409659668418#515 +-0.846414221874162#516 +-0.8490663165013681#517 +-0.8516971835431975#518 +-0.8543067572251003#519 +-0.856894972304884#520 +-0.8594617640743443#521 +-0.8620070683608833#522 +-0.8645308215291134#523 +-0.8670329604824488#524 +-0.8695134226646823#525 +-0.8719721460615499#526 +-0.874409069202281#527 +-0.8768241311611351#528 +-0.8792172715589252#529 +-0.8815884305645271#530 +-0.8839375488963758#531 +-0.8862645678239467#532 +-0.888569429169225#533 +-0.8908520753081592#534 +-0.8931124491721026#535 +-0.8953504942492394#536 +-0.8975661545859979#537 +-0.8997593747884496#538 +-0.9019301000236936#539 +-0.9040782760212279#540 +-0.9062038490743061#541 +-0.9083067660412798#542 +-0.9103869743469281#543 +-0.9124444219837707#544 +-0.9144790575133696#545 +-0.9164908300676139#546 +-0.9184796893499921#547 +-0.9204455856368498#548 +-0.9223884697786324#549 +-0.9243082932011141#550 +-0.9262050079066121#551 +-0.9280785664751869#552 +-0.9299289220658281#553 +-0.9317560284176243#554 +-0.9335598398509212#555 +-0.9353403112684623#556 +-0.9370973981565176#557 +-0.9388310565859953#558 +-0.9405412432135412#559 +-0.9422279152826213#560 +-0.9438910306245916#561 +-0.9455305476597518#562 +-0.9471464253983851#563 +-0.948738623441783#564 +-0.9503071019832552#565 +-0.9518518218091249#566 +-0.953372744299709#567 +-0.9548698314302839#568 +-0.9563430457720361#569 +-0.9577923504929977#570 +-0.9592177093589678#571 +-0.9606190867344174#572 +-0.9619964475833817#573 +-0.9633497574703347#574 +-0.964678982561051#575 +-0.9659840896234514#576 +-0.9672650460284338#577 +-0.9685218197506887#578 +-0.9697543793695005#579 +-0.970962694069532#580 +-0.972146733641596#581 +-0.9733064684834098#582 +-0.9744418696003357#583 +-0.9755529086061053#584 +-0.97663955772353#585 +-0.9777017897851946#586 +-0.9787395782341376#587 +-0.979752897124514#588 +-0.9807417211222447#589 +-0.9817060255056496#590 +-0.9826457861660657#591 +-0.9835609796084501#592 +-0.9844515829519669#593 +-0.9853175739305599#594 +-0.9861589308935084#595 +-0.9869756328059694#596 +-0.987767659249503#597 +-0.9885349904225831#598 +-0.9892776071410919#599 +-0.9899954908388005#600 +-0.990688623567832#601 +-0.9913569879991114#602 +-0.9920005674227975#603 +-0.992619345748702#604 +-0.9932133075066907#605 +-0.9937824378470708#606 +-0.9943267225409622#607 +-0.994846147980653#608 +-0.9953407011799397#609 +-0.9958103697744523#610 +-0.9962551420219626#611 +-0.996675006802679#612 +-0.997069953619523#613 +-0.9974399725983929#614 +-0.99778505448841#615 +-0.9981051906621502#616 +-0.9984003731158594#617 +-0.9986705944696538#618 +-0.9989158479677043#619 +-0.9991361274784057#620 +-0.9993314274945296#621 +-0.9995017431333622#622 +-0.9996470701368265#623 +-0.9997674048715887#624 +-0.999862744329149#625 +-0.9999330861259167#626 +-0.9999784285032701#627 +-0.9999987703276004#628 +-0.9999941110903395#629 +-0.9999644509079737#630 +-0.9999097905220397#631 +-0.999830131299107#632 +-0.9997254752307432#633 +-0.9995958249334642#634 +-0.9994411836486692#635 +-0.9992615552425591#636 +-0.9990569442060405#637 +-0.9988273556546126#638 +-0.99857279532824#639 +-0.9982932695912089#640 +-0.9979887854319682#641 +-0.9976593504629544#642 +-0.9973049729204015#643 +-0.9969256616641354#644 +-0.9965214261773516#645 +-0.9960922765663789#646 +-0.9956382235604264#647 +-0.9951592785113151#648 +-0.9946554533931946#649 +-0.994126760802243#650 +-0.9935732139563528#651 +-0.9929948266947995#652 +-0.9923916134778967#653 +-0.9917635893866336#654 +-0.9911107701222985#655 +-0.9904331720060862#656 +-0.9897308119786897#657 +-0.9890037075998769#658 +-0.9882518770480515#659 +-0.9874753391197985#660 +-0.9866741132294145#661 +-0.9858482194084217#662 +-0.9849976783050681#663 +-0.9841225111838102#664 +-0.9832227399247819#665 +-0.9822983870232478#666 +-0.9813494755890398#667 +-0.9803760293459807#668 +-0.9793780726312895#669 +-0.9783556303949743#670 +-0.977308728199208#671 +-0.9762373922176889#672 +-0.9751416492349868#673 +-0.9740215266458734#674 +-0.9728770524546366#675 +-0.9717082552743816#676 +-0.9705151643263147#677 +-0.9692978094390127#678 +-0.9680562210476774#679 +-0.9667904301933751#680 +-0.9655004685222597#681 +-0.9641863682847819#682 +-0.9628481623348834#683 +-0.9614858841291744#684 +-0.9600995677260983#685 +-0.9586892477850795#686 +-0.9572549595656569#687 +-0.9557967389266028#688 +-0.9543146223250261#689 +-0.9528086468154607#690 +-0.9512788500489395#691 +-0.9497252702720527#692 +-0.9481479463259915#693 +-0.9465469176455779#694 +-0.9449222242582774#695 +-0.9432739067831997#696 +-0.941602006430082#697 +-0.9399065649982594#698 +-0.9381876248756198#699 +-0.9364452290375439#700 +-0.9346794210458308#701 +-0.9328902450476093#702 +-0.9310777457742337#703 +-0.9292419685401656#704 +-0.9273829592418412#705 +-0.9255007643565237#706 +-0.923595430941141#707 +-0.92166700663111#708 +-0.9197155396391448#709 +-0.9177410787540519#710 +-0.91574367333951#711 +-0.9137233733328366#712 +-0.9116802292437386#713 +-0.9096142921530499#714 +-0.9075256137114546#715 +-0.9054142461381952#716 +-0.9032802422197674#717 +-0.9011236553086002#718 +-0.898944539321722#719 +-0.8967429487394131#720 +-0.8945189386038425#721 +-0.8922725645176932#722 +-0.8900038826427711#723 +-0.8877129496986013#724 +-0.8853998229610097#725 +-0.8830645602606917#726 +-0.8807072199817654#727 +-0.878327861060313#728 +-0.8759265429829065#729 +-0.8735033257851209#730 +-0.8710582700500331#731 +-0.8685914369067073#732 +-0.8661028880286666#733 +-0.8635926856323515#734 +-0.8610608924755636#735 +-0.8585075718558977#736 +-0.855932787609158#737 +-0.8533366041077636#738 +-0.8507190862591376#739 +-0.8480802995040857#740 +-0.8454203098151589#741 +-0.8427391836950053#742 +-0.8400369881747064#743 +-0.8373137908121021#744 +-0.8345696596901009#745 +-0.8318046634149785#746 +-0.829018871114662#747 +-0.8262123524370019#748 +-0.823385177548031#749 +-0.8205374171302094#750 +-0.8176691423806586#751 +-0.8147804250093802#752 +-0.8118713372374641#753 +-0.8089419517952822#754 +-0.8059923419206704#755 +-0.8030225813570976#756 +-0.8000327443518218#757 +-0.7970229056540342#758 +-0.7939931405129897#759 +-0.7909435246761266#760 +-0.7878741343871718#761 +-0.7847850463842355#762 +-0.7816763378978921#763 +-0.7785480866492495#764 +-0.7754003708480057#765 +-0.7722332691904945#766 +-0.7690468608577168#767 +-0.7658412255133613#768 +-0.7626164433018134#769 +-0.759372594846151#770 +-0.7561097612461287#771 +-0.7528280240761508#772 +-0.7495274653832311#773 +-0.7462081676849424#774 +-0.7428702139673528#775 +-0.7395136876829514#776 +-0.7361386727485619#777 +-0.7327452535432442#778 +-0.7293335149061851#779 +-0.7259035421345776#780 +-0.7224554209814873#781 +-0.7189892376537098#782 +-0.7155050788096143#783 +-0.712003031556978#784 +-0.7084831834508074#785 +-0.7049456224911501#786 +-0.7013904371208943#787 +-0.6978177162235578#788 +-0.6942275491210654#789 +-0.6906200255715166#790 +-0.6869952357669405#791 +-0.683353270331042#792 +-0.6796942203169349#793 +-0.6760181772048667#794 +-0.6723252328999306#795 +-0.6686154797297681#796 +-0.6648890104422608#797 +-0.6611459182032114#798 +-0.6573862965940147#799 +-0.6536104200519481#800 +-0.6498180228742231#801 +-0.6460093795361077#802 +-0.6421845852578458#803 +-0.6383437356634722#804 +-0.6344869267784224#805 +-0.6306142550271313#806 +-0.626725817230623#807 +-0.62282171060409#808 +-0.6189020327544623#809 +-0.6149668816779679#810 +-0.6110163557576822#811 +-0.6070505537610684#812 +-0.6030695748375086#813 +-0.5990735185158242#814 +-0.5950624847017885#815 +-0.5910365736756281#816 +-0.5869958860895164#817 +-0.5829405229650567#818 +-0.578870585690757#819 +-0.5747861760194949#820 +-0.5706873960659737#821 +-0.5665743483041694#822 +-0.5624471355647691#823 +-0.5583058610325994#824 +-0.5541506282440473#825 +-0.5499815410844713#826 +-0.5457987037856046#827 +-0.5416022209229486#828 +-0.5373921974131589#829 +-0.5331687385114221#830 +-0.528931949808824#831 +-0.5246819372297101#832 +-0.5204188070290375#833 +-0.5161426657897179#834 +-0.5118536204199533#835 +-0.507551778150563#836 +-0.5032372465323027#837 +-0.4989101334331758#838 +-0.49457054703573655#839 +-0.490218595834385#840 +-0.48585438863265507#841 +-0.481478034540494#842 +-0.4770896429715344#843 +-0.4726893236403592#844 +-0.46827718655975825#845 +-0.4638533420379782#846 +-0.4594179006759642#847 +-0.45497097336459547#848 +-0.4505126712819123#849 +-0.44604310589033663#850 +-0.44156238893388555#851 +-0.4370706324353774#852 +-0.4325679486936312#853 +-0.42805445028065886#854 +-0.423530250038851#855 +-0.41899546107815555#856 +-0.4144501967732501#857 +-0.4098945707607072#858 +-0.40532869693615337#859 +-0.4007526894514218#860 +-0.396166662711698#861 +-0.39157073137266#862 +-0.38696501033761166#863 +-0.3823496147546097#864 +-0.3777246600135853#865 +-0.373090261743459#866 +-0.36844653580924985#867 +-0.36379359830917873#868 +-0.3591315655717657#869 +-0.3544605541529216#870 +-0.3497806808330343#871 +-0.34509206261404884#872 +-0.34039481671654215#873 +-0.3356890605767926#874 +-0.330974911843844#875 +-0.32625248837656406#876 +-0.321521908240698#877 +-0.31678328970591646#878 +-0.3120367512428591#879 +-0.30728241152017227#880 +-0.3025203894015423#881 +-0.2977508039427239#882 +-0.2929737743885636#883 +-0.28818942017001825#884 +-0.28339786090116953#885 +-0.2785992163762331#886 +-0.27379360656656376#887 +-0.2689811516176562#888 +-0.2641619718461408#889 +-0.25933618773677614#890 +-0.2545039199394363#891 +-0.24966528926609458#892 +-0.24482041668780327#893 +-0.23996942333166904#894 +-0.23511243047782474#895 +-0.23024955955639712#896 +-0.22538093214447114#897 +-0.2205066699630502#898 +-0.21562689487401324#899 +-0.2107417288770678#900 +-0.2058512941067#901 +-0.20095571282912114#902 +-0.19605510743921073#903 +-0.19114960045745666#904 +-0.1862393145268919#905 +-0.18132437241002838#906 +-0.17640489698578782#907 +-0.17148101124642948#908 +-0.16655283829447542#909 +-0.16162050133963263#910 +-0.15668412369571275#911 +-0.15174382877754902#912 +-0.1467997400979109#913 +-0.14185198126441595#914 +-0.13690067597643962#915 +-0.13194594802202259#916 +-0.12698792127477593#917 +-0.12202671969078414#918 +-0.11706246730550612#919 +-0.11209528823067413#920 +-0.10712530665119085#921 +-0.10215264682202466#922 +-0.09717743306510308#923 +-0.09219978976620465#924 +-0.08721984137184906#925 +-0.08223771238618596#926 +-0.07725352736788216#927 +-0.07226741092700747#928 +-0.06727948772191944#929 +-0.06228988245614669#930 +-0.05729871987527115#931 +-0.052306124763809386#932 +-0.04731222194209275#933 +-0.04231713626314681#934 +-0.03732099260956983#935 +-0.032323915890410615#936 +-0.02732603103804562#937 +-0.022327463005055514#938 +-0.01732833676110123#939 +-0.012328777289799584#940 +-0.0073289095855985495#941 +-0.002328858650652255#942 +0.002671250508304198#943 +0.0076712928830800445#944 +0.012671143467154198#945 +0.01767067725880055#946 +0.022669769264213147#947 +0.027668294500631175#948 +0.03266612799946366#949 +0.03766314480941383#950 +0.042659219999603024#951 +0.0476542286626941#952 +0.052648045918014266#953 +0.05764054691467722#954 +0.06263160683470456#955 +0.06762110089614638#956 +0.07260890435620097#957 +0.07759489251433346#958 +0.08257894071539353#959 +0.08756092435273191#960 +0.0925407188713157#961 +0.09751819977084228#962 +0.10249324260885215#963 +0.1074657230038399#964 +0.11243551663836408#965 +0.11740249926215514#966 +0.12236654669522187#967 +0.12732753483095607#968 +0.13228533963923525#969 +0.13723983716952368#970 +0.14219090355397107#971 +0.14713841501050964#972 +0.1520822478459486#973 +0.1570222784590668#974 +0.1619583833437027#975 +0.1668904390918423#976 +0.1718183223967045#977 +0.17674191005582374#978 +0.18166107897413034#979 +0.18657570616702798#980 +0.1914856687634684#981 +0.1963908440090234#982 +0.20129110926895374#983 +0.2061863420312752#984 +0.21107641990982146#985 +0.215961220647304#986 +0.2208406221183685#987 +0.22571450233264828#988 +0.23058273943781407#989 +0.2354452117226205#990 +0.24030179761994902#991 +0.24515237570984713#992 +0.2499968247225642#993 +0.2548350235415831#994 +0.25966685120664845#995 +0.26449218691679066#996 +0.26931091003334606#997 +0.27412290008297313#998 +0.27892803676066424#999 +0.2837261999327538#1000 +0.28851726963992114#1001 +0.29330112610019016#1002 +0.29807764971192385#1003 +0.30284672105681437#1004 +0.3076082209028686#1005 +0.3123620302073893#1006 +0.31710803011995103#1007 +0.32184610198537184#1008 +0.3265761273466795#1009 +0.3312979879480732#1010 +0.3360115657378801#1011 +0.3407167428715066#1012 +0.3454134017143847#1013 +0.3501014248449132#1014 +0.3547806950573927#1015 +0.35945109536495673#1016 +0.36411250900249587#1017 +0.3687648194295774#1018 +0.37340791033335874#1019 +0.37804166563149555#1020 +0.3826659694750437#1021 +0.38728070625135586#1022 +0.3918857605869718#1023 +0.3964810173505028#1024 +0.40106636165551024#1025 +0.40564167886337776#1026 +0.41020685458617745#1027 +0.4147617746895295#1028 +0.41930632529545586#1029 +0.4238403927852271#1030 +0.4283638638022034#1031 +0.4328766252546682#1032 +0.4373785643186556#1033 +0.44186956844077147#1034 +0.4463495253410071#1035 +0.45081832301554636#1036 +0.4552758497395659#1037 +0.4597219940700286#1038 +0.46415664484846947#1039 +0.4685796912037749#1040 +0.4729910225549547#1041 +0.4773905286139063#1042 +0.4817780993881725#1043 +0.4861536251836913#1044 +0.49051699660753834#1045 +0.49486810457066166#1046 +0.4992068402906093#1047 +0.5035330952942491#1048 +0.5078467614204799#1049 +0.512147730822937#1050 +0.5164358959726869#1051 +0.5207111496609169#1052 +0.5249733850016148#1053 +0.5292224954342413#1054 +0.533458374726394#1055 +0.5376809169764638#1056 +0.5418900166162819#1057 +0.5460855684137595#1058 +0.5502674674755189#1059 +0.5544356092495155#1060 +0.5585898895276518#1061 +0.562730204448383#1062 +0.5668564504993135#1063 +0.570968524519785#1064 +0.5750663237034549#1065 +0.5791497456008676#1066 +0.5832186881220153#1067 +0.5872730495388901#1068 +0.5913127284880281#1069 +0.5953376239730427#1070 +0.5993476353671503#1071 +0.6033426624156858#1072 +0.607322605238609#1073 +0.6112873643330021#1074 +0.6152368405755567#1075 +0.6191709352250527#1076 +0.6230895499248265#1077 +0.6269925867052301#1078 +0.6308799479860806#1079 +0.6347515365790998#1080 +0.6386072556903435#1081 +0.6424470089226225#1082 +0.6462707002779116#1083 +0.6500782341597501#1084 +0.653869515375632#1085 +0.6576444491393854#1086 +0.6614029410735427#1087 +0.6651448972117002#1088 +0.6688702240008668#1089 +0.6725788283038037#1090 +0.676270617401352#1091 +0.6799454989947518#1092 +0.6836033812079488#1093 +0.6872441725898925#1094 +0.690867782116821#1095 +0.694474119194538#1096 +0.6980630936606774#1097 +0.7016346157869571#1098 +0.7051885962814226#1099 +0.7087249462906794#1100 +0.7122435774021144#1101 +0.7157444016461064#1102 +0.719227331498225#1103 +0.7226922798814197#1104 +0.7261391601681957#1105 +0.729567886182781#1106 +0.7329783722032797#1107 +0.7363705329638159#1108 +0.7397442836566653#1109 +0.7430995399343753#1110 +0.746436217911874#1111 +0.7497542341685669#1112 +0.7530535057504234#1113 +0.7563339501720501#1114 +0.759595485418753#1115 +0.7628380299485884#1116 +0.7660615026944009#1117 +0.7692658230658508#1118 +0.7724509109514288#1119 +0.7756166867204584#1120 +0.7787630712250873#1121 +0.7818899858022661#1122 +0.7849973522757145#1123 +0.7880850929578768#1124 +0.7911531306518627#1125 +0.7942013886533785#1126 +0.7972297907526449#1127 +0.8002382612363009#1128 +0.8032267248892985#1129 +0.8061951069967818#1130 +0.8091433333459556#1131 +0.8120713302279408#1132 +0.814979024439617#1133 +0.8178663432854528#1134 +0.820733214579323#1135 +0.8235795666463138#1136 +0.8264053283245143#1137 +0.8292104289667959#1138 +0.8319947984425784#1139 +0.8347583671395834#1140 +0.8375010659655747#1141 +0.8402228263500859#1142 +0.8429235802461342#1143 +0.8456032601319221#1144 +0.8482617990125253#1145 +0.8508991304215678#1146 +0.8535151884228835#1147 +0.8561099076121648#1148 +0.8586832231185977#1149 +0.8612350706064834#1150 +0.8637653862768475#1151 +0.8662741068690343#1152 +0.8687611696622883#1153 +0.8712265124773234#1154 +0.873670073677876#1155 +0.8760917921722469#1156 +0.8784916074148283#1157 +0.8808694594076181#1158 +0.8832252887017188#1159 +0.8855590363988247#1160 +0.8878706441526942#1161 +0.8901600541706085#1162 +0.8924272092148162#1163 +0.8946720526039647#1164 +0.8968945282145172#1165 +0.8990945804821558#1166 +0.9012721544031705#1167 +0.9034271955358348#1168 +0.9055596500017663#1169 +0.9076694644872738#1170 +0.9097565862446908#1171 +0.9118209630936935#1172 +0.9138625434226055#1173 +0.9158812761896887#1174 +0.9178771109244186#1175 +0.9198499977287469#1176 +0.9217998872783484#1177 +0.9237267308238543#1178 +0.9256304801920713#1179 +0.9275110877871856#1180 +0.9293685065919531#1181 +0.9312026901688749#1182 +0.9330135926613579#1183 +0.9348011687948616#1184 +0.9365653738780302#1185 +0.9383061638038094#1186 +0.9400234950505496#1187 +0.9417173246830938#1188 +0.9433876103538507#1189 +0.9450343103038542#1190 +0.9466573833638069#1191 +0.9482567889551092#1192 +0.9498324870908743#1193 +0.9513844383769275#1194 +0.9529126040127917#1195 +0.9544169457926563#1196 +0.955897426106334#1197 +0.9573540079401994#1198 +0.9587866548781159#1199 +0.9601953311023449#1200 +0.9615800013944422#1201 +0.9629406311361378#1202 +0.9642771863102021#1203 +0.9655896335012956#1204 +0.9668779398968049#1205 +0.9681420732876631#1206 +0.9693820020691543#1207 +0.9705976952417047#1208 +0.9717891224116568#1209 +0.9729562537920303#1210 +0.9740990602032655#1211 +0.9752175130739539#1212 +0.976311584441552#1213 +0.9773812469530805#1214 +0.9784264738658082#1215 +0.9794472390479205#1216 +0.980443516979173#1217 +0.9814152827515289#1218 +0.9823625120697825#1219 +0.9832851812521662#1220 +0.9841832672309425#1221 +0.9850567475529811#1222 +0.9859056003803196#1223 +0.9867298044907101#1224 +0.9875293392781497#1225 +0.9883041847533952#1226 +0.9890543215444635#1227 +0.9897797308971151#1228 +0.9904803946753242#1229 +0.9911562953617308#1230 +0.9918074160580793#1231 +0.9924337404856411#1232 +0.9930352529856216#1233 +0.993611938519551#1234 +0.9941637826696611#1235 +0.9946907716392454#1236 +0.9951928922530039#1237 +0.9956701319573728#1238 +0.9961224788208382#1239 +0.9965499215342345#1240 +0.9969524494110268#1241 +0.9973300523875785#1242 +0.9976827210234028#1243 +0.9980104465013986#1244 +0.9983132206280708#1245 +0.9985910358337358#1246 +0.9988438851727096#1247 +0.9990717623234828#1248 +0.9992746615888777#1249 +0.9994525778961908#1250 +0.9996055067973204#1251 +0.9997334444688767#1252 +0.9998363877122783#1253 +0.9999143339538316#1254 +0.9999672812447953#1255 +0.9999952282614295#1256 +0.9999981743050281#1257 +0.9999761193019369#1258 +0.999929063803555#1259 +0.9998570089863212#1260 +0.9997599566516848#1261 +0.9996379092260601#1262 +0.9994908697607661#1263 +0.9993188419319499#1264 +0.9991218300404953#1265 +0.9988998390119147#1266 +0.9986528743962263#1267 +0.9983809423678153#1268 +0.9980840497252794#1269 +0.9977622038912591#1270 +0.9974154129122517#1271 +0.9970436854584105#1272 +0.996647030823328#1273 +0.9962254589238031#1274 +0.995778980299594#1275 +0.9953076061131539#1276 +0.9948113481493526#1277 +0.9942902188151809#1278 +0.9937442311394417#1279 +0.9931733987724232#1280 +0.992577735985558#1281 +0.9919572576710666#1282 +0.9913119793415845#1283 +0.9906419171297749#1284 +0.9899470877879251#1285 +0.9892275086875274#1286 +0.9884831978188455#1287 +0.9877141737904641#1288 +0.9869204558288239#1289 +0.9861020637777411#1290 +0.9852590180979107#1291 +0.9843913398663958#1292 +0.9834990507760999#1293 +0.9825821731352249#1294 +0.9816407298667135#1295 +0.9806747445076756#1296 +0.9796842412088003#1297 +0.9786692447337523#1298 +0.977629780458552#1299 +0.9765658743709418#1300 +0.9754775530697359#1301 +0.9743648437641559#1302 +0.9732277742731497#1303 +0.9720663730246967#1304 +0.9708806690550966#1305 +0.9696706920082441#1306 +0.9684364721348868#1307 +0.9671780402918698#1308 +0.965895427941364#1309 +0.964588667150079#1310 +0.9632577905884618#1311 +0.9619028315298808#1312 +0.960523823849792#1313 +0.9591208020248938#1314 +0.9576938011322647#1315 +0.9562428568484854#1316 +0.9547680054487483#1317 +0.9532692838059491#1318 +0.9517467293897661#1319 +0.9502003802657228#1320 +0.9486302750942366#1321 +0.9470364531296516#1322 +0.9454189542192581#1323 +0.9437778188022956#1324 +0.9421130879089423#1325 +0.9404248031592889#1326 +0.9387130067622983#1327 +0.9369777415147503#1328 +0.9352190508001716#1329 +0.9334369785877511#1330 +0.9316315694312408#1331 +0.9298028684678417#1332 +0.9279509214170754#1333 +0.9260757745796411#1334 +0.924177474836258#1335 +0.9222560696464933#1336 +0.9203116070475756#1337 +0.918344135653194#1338 +0.9163537046522822#1339 +0.9143403638077896#1340 +0.9123041634554366#1341 +0.9102451545024561#1342 +0.9081633884263212#1343 +0.9060589172734576#1344 +0.903931793657943#1345 +0.9017820707601913#1346 +0.8996098023256233#1347 +0.8974150426633225#1348 +0.895197846644678#1349 +0.8929582697020121#1350 +0.8906963678271949#1351 +0.8884121975702437#1352 +0.8861058160379104#1353 +0.8837772808922523#1354 +0.8814266503491918#1355 +0.8790539831770601#1356 +0.8766593386951281#1357 +0.8742427767721238#1358 +0.871804357824735#1359 +0.8693441428160987#1360 +0.8668621932542777#1361 +0.8643585711907221#1362 +0.8618333392187183#1363 +0.8592865604718241#1364 +0.8567182986222898#1365 +0.8541286178794673#1366 +0.8515175829882039#1367 +0.848885259227224#1368 +0.8462317124074971#1369 +0.843557008870592#1370 +0.8408612154870191#1371 +0.8381443996545574#1372 +0.8354066292965706#1373 +0.8326479728603081#1374 +0.8298684993151944#1375 +0.8270682781511038#1376 +0.8242473793766245#1377 +0.8214058735173073#1378 +0.8185438316139023#1379 +0.8156613252205835#1380 +0.8127584264031595#1381 +0.8098352077372716#1382 +0.8068917423065796#1383 +0.8039281037009344#1384 +0.8009443660145384#1385 +0.7979406038440933#1386 +0.7949168922869341#1387 +0.7918733069391528#1388 +0.7888099238937079#1389 +0.7857268197385214#1390 +0.7826240715545653#1391 +0.7795017569139331#1392 +0.7763599538779017#1393 +0.7731987409949788#1394 +0.7700181972989396#1395 +0.7668184023068507#1396 +0.7635994360170821#1397 +0.7603613789073074#1398 +0.7571043119324912#1399 +0.7538283165228657#1400 +0.7505334745818947#1401 +0.7472198684842257#1402 +0.7438875810736308#1403 +0.7405366956609353#1404 +0.7371672960219346#1405 +0.7337794663953003#1406 +0.7303732914804737#1407 +0.7269488564355484#1408 +0.7235062468751411#1409 +0.7200455488682512#1410 +0.7165668489361092#1411 +0.7130702340500135#1412 +0.7095557916291553#1413 +0.7060236095384345#1414 +0.7024737760862613#1415 +0.6989063800223498#1416 +0.6953215105354986#1417 +0.6917192572513604#1418 +0.6880997102302023#1419 +0.6844629599646536#1420 +0.6808090973774434#1421 +0.6771382138191278#1422 +0.6734504010658054#1423 +0.6697457513168236#1424 +0.6660243571924724#1425 +0.6622863117316704#1426 +0.658531708389637#1427 +0.6547606410355573#1428 +0.6509732039502342#1429 +0.647169491823732#1430 +0.6433495997530088#1431 +0.639513623239539#1432 +0.6356616581869255#1433 +0.6317938008985026#1434 +0.6279101480749271#1435 +0.624010796811762#1436 +0.6200958445970481#1437 +0.6161653893088677#1438 +0.6122195292128958#1439 +0.6082583629599453#1440 +0.6042819895834993#1441 +0.6002905084972359#1442 +0.5962840194925422#1443 +0.5922626227360198#1444 +0.5882264187669801#1445 +0.5841755084949316#1446 +0.5801099931970557#1447 +0.576029974515676#1448 +0.571935554455716#1449 +0.5678268353821498#1450 +0.5637039200174425#1451 +0.5595669114389816#1452 +0.5554159130765007#1453 +0.551251028709493#1454 +0.5470723624646173#1455 +0.5428800188130941#1456 +0.5386741025680941#1457 +0.5344547188821178#1458 +0.5302219732443663#1459 +0.525975971478104#1460 +0.5217168197380132#1461 +0.5174446245075399#1462 +0.5131594925962314#1463 +0.5088615311370663#1464 +0.5045508475837759#1465 +0.5002275497081577#1466 +0.4958917455973813#1467 +0.49154354365128533#1468 +0.48718305257966826#1469 +0.48281038139957#1470 +0.4784256394325464#1471 +0.4740289363019363#1472 +0.4696203819301207#1473 +0.4652000865357743#1474 +0.46076816063111065#1475 +0.4563247150191183#1476 +0.45186986079079144#1477 +0.4474037093223519#1478 +0.4429263722724649#1479 +0.4384379615794475#1480 +0.43393858945846975#1481 +0.4294283683987496#1482 +0.42490741116074016#1483 +0.42037583077331087#1484 +0.41583374053092126#1485 +0.41128125399078896#1486 +0.40671848497005036#1487 +0.4021455475429149#1488 +0.39756255603781365#1489 +0.3929696250345402#1490 +0.3883668693613867#1491 +0.3837544040922728#1492 +0.37913234454386846#1493 +0.3745008062727113#1494 +0.36985990507231736#1495 +0.3652097569702859#1496 +0.3605504782253991#1497 +0.35588218532471505#1498 +0.35120499498065555#1499 +0.3465190241280883#1500 +0.3418243899214033#1501 +0.33712120973158377#1502 +0.33240960114327195#1503 +0.3276896819518291#1504 +0.3229615701603909#1505 +0.31822538397691663#1506 +0.3134812418112345#1507 +0.30872926227208075#1508 +0.30396956416413473#1509 +0.2992022664850482#1510 +0.2944274884224707#1511 +0.2896453493510694#1512 +0.28485596882954484#1513 +0.2800594665976416#1514 +0.2752559625731548#1515 +0.2704455768489323#1516 +0.2656284296898715#1517 +0.2608046415299135#1518 +0.2559743329690314#1519 +0.2511376247702155#1520 +0.2462946378564542#1521 +0.2414454933077104#1522 +0.23659031235789474#1523 +0.23172921639183441#1524 +0.22686232694223857#1525 +0.22198976568665968#1526 +0.2171116544444516#1527 +0.21222811517372392#1528 +0.20733926996829286#1529 +0.20244524105462883#1530 +0.19754615078880056#1531 +0.19264212165341615#1532 +0.18773327625456082#1533 +0.18281973731873163#1534 +0.17790162768976925#1535 +0.17297907032578658#1536 +0.16805218829609478#1537 +0.16312110477812647#1538 +0.1581859430543559#1539 +0.15324682650921706#1540 +0.14830387862601876#1541 +0.1433572229838574#1542 +0.13840698325452744#1543 +0.13345328319942942#1544 +0.12849624666647583#1545 +0.12353599758699475#1546 +0.11857265997263139#1547 +0.11360635791224773#1548 +0.10863721556882015#1549 +0.10366535717633522#1550 +0.09869090703668365#1551 +0.09371398951655271#1552 +0.08873472904431687#1553 +0.08375325010692693#1554 +0.07876967724679779#1555 +0.07378413505869465#1556 +0.06879674818661811#1557 +0.06380764132068786#1558 +0.05881693919402533#1559 +0.05382476657963519#1560 +0.04883124828728593#1561 +0.04383650916038944#1562 +0.03884067407287982#1563 +0.033843867926091384#1564 +0.02884621564563598#1565 +0.023847842178279725#1566 +0.018848872488819203#1567 +0.01384943155695719#1568 +0.008849644374178043#1569 +0.003849635940622774#1570 +-0.0011504687380361003#1571 +-0.006150544653719827#1572 +-0.01115046679906876#1573 +-0.01615011017056768#1574 +-0.02114934977167102#1575 +-0.026148060615927907#1576 +-0.031146117730106976#1577 +-0.03614339615732082#1578 +-0.04113977096015006#1579 +-0.046135117223766925#1580 +-0.05112931005905823#1581 +-0.056122224605747756#1582 +-0.06111373603551791#1583 +-0.06610371955513056#1584 +-0.07109205040954697#1585 +-0.07607860388504686#1586 +-0.08106325531234637#1587 +-0.08604588006971489#1588 +-0.09102635358609082#1589 +-0.0960045513441959#1590 +-0.1009803488836483#1591 +-0.10595362180407435#1592 +-0.11092424576821851#1593 +-0.11589209650505211#1594 +-0.12085704981288019#1595 +-0.12581898156244667#1596 +-0.13077776770003768#1597 +-0.13573328425058317#1598 +-0.1406854073207563#1599 +-0.14563401310207091#1600 +-0.15057897787397695#1601 +-0.15552017800695359#1602 +-0.16045748996560003#1603 +-0.16539079031172413#1604 +-0.17031995570742842#1605 +-0.1752448629181937#1606 +-0.18016538881596006#1607 +-0.1850814103822052#1608 +-0.18999280471102004#1609 +-0.19489944901218145#1610 +-0.19980122061422223#1611 +-0.20469799696749796#1612 +-0.20958965564725085#1613 +-0.21447607435667063#1614 +-0.2193571309299519#1615 +-0.22423270333534864#1616 +-0.22910266967822496#1617 +-0.23396690820410262#1618 +-0.23882529730170513#1619 +-0.24367771550599804#1620 +-0.24852404150122578#1621 +-0.2533641541239447#1622 +-0.2581979323660522#1623 +-0.2630252553778121#1624 +-0.26784600247087603#1625 +-0.27266005312130087#1626 +-0.27746728697256173#1627 +-0.2822675838385613#1628 +-0.2870608237066344#1629 +-0.29184688674054843#1630 +-0.2966256532834996#1631 +-0.30139700386110435#1632 +-0.3061608191843863#1633 +-0.3109169801527587#1634 +-0.31566536785700205#1635 +-0.3204058635822369#1636 +-0.3251383488108919#1637 +-0.32986270522566685#1638 +-0.33457881471249085#1639 +-0.3392865593634751#1640 +-0.343985821479861#1641 +-0.34867648357496245#1642 +-0.35335842837710324#1643 +-0.3580315388325491#1644 +-0.36269569810843405#1645 +-0.36735078959568135#1646 +-0.37199669691191894#1647 +-0.376633303904389#1648 +-0.381260494652852#1649 +-0.38587815347248483#1650 +-0.3904861649167729#1651 +-0.39508441378039666#1652 +-0.3996727851021117#1653 +-0.4042511641676229#1654 +-0.40881943651245256#1655 +-0.4133774879248019#1656 +-0.4179252044484068#1657 +-0.4224624723853865#1658 +-0.4269891782990863#1659 +-0.43150520901691375#1660 +-0.4360104516331679#1661 +-0.440504793511862#1662 +-0.44498812228953993#1663 +-0.4494603258780848#1664 +-0.4539212924675219#1665 +-0.4583709105288135#1666 +-0.4628090688166477#1667 +-0.46723565637221925#1668 +-0.471650562526004#1669 +-0.4760536769005256#1670 +-0.4804448894131149#1671 +-0.4848240902786625#1672 +-0.48919117001236323#1673 +-0.4935460194324534#1674 +-0.4978885296629405#1675 +-0.5022185921363254#1676 +-0.5065360985963163#1677 +-0.5108409411005356#1678 +-0.5151330120232184#1679 +-0.5194122040579031#1680 +-0.5236784102201146#1681 +-0.5279315238500388#1682 +-0.5321714386151891#1683 +-0.536398048513065#1684 +-0.5406112478738021#1685 +-0.5448109313628142#1686 +-0.5489969939834266#1687 +-0.5531693310795012#1688 +-0.557327838338053#1689 +-0.561472411791858#1690 +-0.5656029478220528#1691 +-0.5697193431607246#1692 +-0.5738214948934934#1693 +-0.577909300462085#1694 +-0.5819826576668949#1695 +-0.5860414646695438#1696 +-0.5900856199954225#1697 +-0.5941150225362308#1698 +-0.5981295715525035#1699 +-0.6021291666761299#1700 +-0.6061137079128632#1701 +-0.6100830956448199#1702 +-0.6140372306329708#1703 +-0.617976014019622#1704 +-0.6218993473308865#1705 +-0.6258071324791457#1706 +-0.6296992717655023#1707 +-0.6335756678822227#1708 +-0.6374362239151697#1709 +-0.6412808433462255#1710 +-0.6451094300557046#1711 +-0.6489218883247572#1712 +-0.6527181228377621#1713 +-0.6564980386847097#1714 +-0.6602615413635748#1715 +-0.6640085367826797#1716 +-0.6677389312630457#1717 +-0.6714526315407361#1718 +-0.6751495447691873#1719 +-0.6788295785215303#1720 +-0.6824926407929015#1721 +-0.6861386400027427#1722 +-0.6897674849970913#1723 +-0.6933790850508582#1724 +-0.6969733498700972#1725 +-0.7005501895942616#1726 +-0.7041095147984512#1727 +-0.7076512364956479#1728 +-0.7111752661389406#1729 +-0.7146815156237386#1730 +-0.718169897289975#1731 +-0.7216403239242978#1732 +-0.7250927087622498#1733 +-0.7285269654904393#1734 +-0.7319430082486966#1735 +-0.7353407516322212#1736 +-0.7387201106937172#1737 +-0.7420810009455167#1738 +-0.745423338361692#1739 +-0.7487470393801567#1740 +-0.7520520209047551#1741 +-0.7553382003073387#1742 +-0.7586054954298327#1743 +-0.7618538245862904#1744 +-0.7650831065649343#1745 +-0.7682932606301877#1746 +-0.7714842065246923#1747 +-0.7746558644713152#1748 +-0.7778081551751432#1749 +-0.7809409998254654#1750 +-0.7840543200977432#1751 +-0.7871480381555694#1752 +-0.7902220766526129#1753 +-0.7932763587345535#1754 +-0.7963108080410028#1755 +-0.7993253487074136#1756 +-0.8023199053669762#1757 +-0.8052944031525031#1758 +-0.8082487676983007#1759 +-0.8111829251420279#1760 +-0.8140968021265438#1761 +-0.8169903258017407#1762 +-0.819863423826366#1763 +-0.8227160243698308#1764 +-0.8255480561140056#1765 +-0.8283594482550031#1766 +-0.8311501305049488#1767 +-0.8339200330937382#1768 +-0.8366690867707809#1769 +-0.8393972228067319#1770 +-0.8421043729952106#1771 +-0.8447904696545049#1772 +-0.8474554456292643#1773 +-0.8500992342921785#1774 +-0.8527217695456428#1775 +-0.8553229858234114#1776 +-0.8579028180922357#1777 +-0.8604612018534912#1778 +-0.862998073144789#1779 +-0.8655133685415761#1780 +-0.8680070251587196#1781 +-0.8704789806520804#1782 +-0.872929173220071#1783 +-0.8753575416052006#1784 +-0.8777640250956071#1785 +-0.8801485635265746#1786 +-0.8825110972820375#1787 +-0.8848515672960712#1788 +-0.8871699150543689#1789 +-0.8894660825957043#1790 +-0.8917400125133804#1791 +-0.8939916479566656#1792 +-0.8962209326322143#1793 +-0.8984278108054743#1794 +-0.9006122273020807#1795 +-0.902774127509235#1796 +-0.9049134573770706#1797 +-0.9070301634200038#1798 +-0.9091241927180713#1799 +-0.9111954929182535#1800 +-0.9132440122357828#1801 +-0.9152696994554383#1802 +-0.9172725039328272#1803 +-0.9192523755956495#1804 +-0.9212092649449513#1805 +-0.9231431230563608#1806 +-0.9250539015813133#1807 +-0.9269415527482581#1808 +-0.9288060293638543#1809 +-0.9306472848141497#1810 +-0.9324652730657469#1811 +-0.9342599486669537#1812 +-0.9360312667489198#1813 +-0.9377791830267581#1814 +-0.9395036538006526#1815 +-0.9412046359569499#1816 +-0.9428820869692384#1817 +-0.9445359648994103#1818 +-0.9461662283987107#1819 +-0.9477728367087713#1820 +-0.9493557496626296#1821 +-0.9509149276857326#1822 +-0.9524503317969264#1823 +-0.9539619236094313#1824 +-0.9554496653318006#1825 +-0.9569135197688664#1826 +-0.9583534503226685#1827 +-0.9597694209933703#1828 +-0.9611613963801583#1829 +-0.9625293416821272#1830 +-0.9638732226991504#1831 +-0.9651930058327345#1832 +-0.9664886580868592#1833 +-0.9677601470688033#1834 +-0.9690074409899532#1835 +-0.9702305086665982#1836 +-0.9714293195207107#1837 +-0.9726038435807095#1838 +-0.9737540514822105#1839 +-0.9748799144687594#1840 +-0.9759814043925521#1841 +-0.977058493715137#1842 +-0.9781111555081046#1843 +-0.9791393634537602#1844 +-0.9801430918457821#1845 +-0.9811223155898638#1846 +-0.9820770102043426#1847 +-0.9830071518208098#1848 +-0.9839127171847091#1849 +-0.9847936836559172#1850 +-0.9856500292093102#1851 +-0.9864817324353137#1852 +-0.9872887725404385#1853 +-0.9880711293478005#1854 +-0.9888287832976249#1855 +-0.9895617154477354#1856 +-0.9902699074740275#1857 +-0.9909533416709271#1858 +-0.9916120009518327#1859 +-0.9922458688495427#1860 +-0.9928549295166674#1861 +-0.9934391677260248#1862 +-0.9939985688710213#1863 +-0.9945331189660176#1864 +-0.995042804646677#1865 +-0.995527613170301#1866 +-0.9959875324161469#1867 +-0.9964225508857312#1868 +-0.9968326577031168#1869 +-0.9972178426151854#1870 +-0.9975780959918935#1871 +-0.9979134088265131#1872 +-0.998223772735857#1873 +-0.9985091799604886#1874 +-0.9987696233649155#1875 +-0.9990050964377679#1876 +-0.999215593291962#1877 +-0.9994011086648463#1878 +-0.9995616379183341#1879 +-0.9996971770390185#1880 +-0.9998077226382736#1881 +-0.9998932719523383#1882 +-0.9999538228423868#1883 +-0.9999893737945803#1884 +-0.9999999239201064#1885 +-0.9999854729552003#1886 +-0.9999460212611521#1887 +-0.999881569824297#1888 +-0.9997921202559915#1889 +-0.9996776747925724#1890 +-0.9995382362953015#1891 +-0.9993738082502932#1892 +-0.9991843947684286#1893 +-0.9989700005852513#1894 +-0.9987306310608505#1895 +-0.9984662921797254#1896 +-0.9981769905506368#1897 +-0.9978627334064417#1898 +-0.9975235286039118#1899 +-0.9971593846235377#1900 +-0.9967703105693168#1901 +-0.9963563161685252#1902 +-0.9959174117714753#1903 +-0.9954536083512565#1904 +-0.9949649175034609#1905 +-0.9944513514458935#1906 +-0.9939129230182666#1907 +-0.9933496456818792#1908 +-0.99276153351928#1909 +-0.9921486012339155#1910 +-0.9915108641497621#1911 +-0.9908483382109438#1912 +-0.9901610399813326#1913 +-0.9894489866441352#1914 +-0.9887121960014627#1915 +-0.987950686473886#1916 +-0.987164477099975#1917 +-0.986353587535823#1918 +-0.985518038054555#1919 +-0.9846578495458204#1920 +-0.9837730435152716#1921 +-0.9828636420840261#1922 +-0.981929667988113#1923 +-0.9809711445779047#1924 +-0.9799880958175335#1925 +-0.9789805462842925#1926 +-0.9779485211680204#1927 +-0.9768920462704724#1928 +-0.9758111480046752#1929 +-0.9747058533942659#1930 +-0.973576190072817#1931 +-0.9724221862831459#1932 +-0.9712438708766077#1933 +-0.9700412733123746#1934 +-0.9688144236566995#1935 +-0.9675633525821636#1936 +-0.9662880913669109#1937 +-0.9649886718938643#1938 +-0.9636651266499302#1939 +-0.9623174887251855#1940 +-0.9609457918120503#1941 +-0.9595500702044459#1942 +-0.958130358796937#1943 +-0.9566866930838596#1944 +-0.9552191091584334#1945 +-0.9537276437118598#1946 +-0.9522123340324041#1947 +-0.9506732180044635#1948 +-0.9491103341076198#1949 +-0.9475237214156778#1950 +-0.9459134195956878#1951 +-0.9442794689069542#1952 +-0.9426219102000293#1953 +-0.9409407849156911#1954 +-0.9392361350839084#1955 +-0.9375080033227886#1956 +-0.9357564328375138#1957 +-0.9339814674192592#1958 +-0.9321831514440992#1959 +-0.9303615298718977#1960 +-0.9285166482451835#1961 +-0.9266485526880128#1962 +-0.9247572899048149#1963 +-0.9228429071792253#1964 +-0.9209054523729034#1965 +-0.9189449739243356#1966 +-0.9169615208476247#1967 +-0.9149551427312642#1968 +-0.9129258897368986#1969 +-0.9108738125980693#1970 +-0.9087989626189464#1971 +-0.906701391673046#1972 +-0.9045811522019326#1973 +-0.9024382972139093#1974 +-0.9002728802826915#1975 +-0.8980849555460676#1976 +-0.8958745777045463#1977 +-0.8936418020199878#1978 +-0.8913866843142233#1979 +-0.8891092809676588#1980 +-0.8868096489178656#1981 +-0.884487845658157#1982 +-0.8821439292361505#1983 +-0.8797779582523171#1984 +-0.8773899918585158#1985 +-0.8749800897565151#1986 +-0.8725483121964996#1987 +-0.8700947199755649#1988 +-0.8676193744361966#1989 +-0.865122337464737#1990 +-0.8626036714898381#1991 +-0.8600634394809005#1992 +-0.857501704946499#1993 +-0.8549185319327954#1994 +-0.8523139850219369#1995 +-0.8496881293304409#1996 +-0.8470410305075684#1997 +-0.8443727547336812#1998 +-0.8416833687185884#1999 +-0.8389729396998782#2000 +-0.8362415354412365#2001 +-0.8334892242307537#2002 +-0.8307160748792162#2003 +-0.8279221567183871#2004 +-0.8251075395992724#2005 +-0.8222722938903746#2006 +-0.8194164904759332#2007 +-0.8165402007541533#2008 +-0.8136434966354198#2009 +-0.8107264505404997#2010 +-0.807789135398732#2011 +-0.8048316246462035#2012 +-0.8018539922239137#2013 +-0.7988563125759258#2014 +-0.7958386606475054#2015 +-0.792801111883247#2016 +-0.7897437422251878#2017 +-0.7866666281109088#2018 +-0.7835698464716242#2019 +-0.7804534747302576#2020 +-0.7773175907995067#2021 +-0.7741622730798953#2022 +-0.7709876004578128#2023 +-0.7677936523035428#2024 +-0.7645805084692779#2025 +-0.761348249287124#2026 +-0.7580969555670909#2027 +-0.7548267085950736#2028 +-0.7515375901308182#2029 +-0.7482296824058794#2030 +-0.7449030681215636#2031 +-0.7415578304468616#2032 +-0.7381940530163695#2033 +-0.7348118199281973#2034 +-0.7314112157418668#2035 +-0.7279923254761973#2036 +-0.72455523460718#2037 +-0.7211000290658409#2038 +-0.7176267952360931#2039 +-0.7141356199525759#2040 +-0.7106265904984852#2041 +-0.7070997946033903#2042 +-0.7035553204410411#2043 +-0.6999932566271632#2044 +-0.696413692217243#2045 +-0.692816716704301#2046 +-0.689202420016654#2047 +-0.685570892515667#2048 +-0.6819222249934948#2049 +-0.6782565086708106#2050 +-0.674573835194527#2051 +-0.6708742966355032#2052 +-0.6671579854862448#2053 +-0.6634249946585896#2054 +-0.6596754174813863#2055 +-0.6559093476981598#2056 +-0.6521268794647687#2057 +-0.6483281073470504#2058 +-0.6445131263184574#2059 +-0.6406820317576828#2060 +-0.6368349194462752#2061 +-0.6329718855662451#2062 +-0.6290930266976588#2063 +-0.6251984398162254#2064 +-0.6212882222908708#2065 +-0.6173624718813046#2066 +-0.6134212867355752#2067 +-0.6094647653876163#2068 +-0.6054930067547835#2069 +-0.6015061101353811#2070 +-0.5975041752061797#2071 +-0.5934873020199238#2072 +-0.589455591002831#2073 +-0.5854091429520806#2074 +-0.5813480590332939#2075 +-0.577272440778005#2076 +-0.5731823900811223#2077 +-0.5690780091983807#2078 +-0.5649594007437858#2079 +-0.5608266676870478#2080 +-0.5566799133510075#2081 +-0.552519241409053#2082 +-0.5483447558825275#2083 +-0.5441565611381292#2084 +-0.5399547618853016#2085 +-0.5357394631736159#2086 +-0.5315107703901442#2087 +-0.5272687892568254#2088 +-0.5230136258278214#2089 +-0.5187453864868661#2090 +-0.5144641779446052#2091 +-0.5101701072359289#2092 +-0.5058632817172954#2093 +-0.5015438090640473#2094 +-0.497211797267719#2095 +-0.49286735463333764#2096 +-0.4885105897767145#2097 +-0.4841416116217302#2098 +-0.4797605293976108#2099 +-0.47536745263619773#2100 +-0.4709624911692086#2101 +-0.46654575512549173#2102 +-0.4621173549282729#2103 +-0.4576774012923942#2104 +-0.45322600522154655#2105 +-0.44876327800549404#2106 +-0.4442893312172919#2107 +-0.439804276710497#2108 +-0.435308226616371#2109 +-0.4308012933410775#2110 +-0.4262835895628715#2111 +-0.4217552282292823#2112 +-0.41721632255428964#2113 +-0.4126669860154935#2114 +-0.4081073323512767#2115 +-0.40353747555796154#2116 +-0.3989575298869596#2117 +-0.39436760984191555#2118 +-0.3897678301758442#2119 +-0.3851583058882617#2120 +-0.38053915222231044#2121 +-0.37591048466187765#2122 +-0.37127241892870844#2123 +-0.3666250709795124#2124 +-0.36196855700306485#2125 +-0.35730299341730154#2126 +-0.3526284968664085#2127 +-0.34794518421790566#2128 +-0.3432531725597249#2129 +-0.338552579197283#2130 +-0.33384352165054854#2131 +-0.32912611765110417#2132 +-0.3244004851392028#2133 +-0.3196667422608192#2134 +-0.31492500736469614#2135 +-0.3101753989993856#2136 +-0.3054180359102849#2137 +-0.30065303703666785#2138 +-0.29588052150871125#2139 +-0.29110060864451653#2140 +-0.2863134179471266#2141 +-0.281519069101538#2142 +-0.276717681971709#2143 +-0.2719093765975624#2144 +-0.26709427319198503#2145 +-0.26227249213782167#2146 +-0.2574441539848656#2147 +-0.25260937944684486#2148 +-0.24776828939840406#2149 +-0.24292100487208254#2150 +-0.2380676470552883#2151 +-0.23320833728726822#2152 +-0.22834319705607453#2153 +-0.22347234799552734#2154 +-0.21859591188217378#2155 +-0.21371401063224338#2156 +-0.20882676629860003#2157 +-0.2039343010676906#2158 +-0.19903673725649004#2159 +-0.19413419730944345#2160 +-0.18922680379540469#2161 +-0.18431467940457213#2162 +-0.17939794694542124#2163 +-0.1744767293416342#2164 +-0.1695511496290267#2165 +-0.16462133095247194#2166 +-0.15968739656282188#2167 +-0.15474946981382576#2168 +-0.1498076741590461#2169 +-0.14486213314877244#2170 +-0.1399129704269322#2171 +-0.13496030972799958#2172 +-0.13000427487390198#2173 +-0.1250449897709244#2174 +-0.12008257840661164#2175 +-0.11511716484666841#2176 +-0.11014887323185758#2177 +-0.10517782777489658#2178 +-0.10020415275735187#2179 +-0.09522797252653178#2180 +-0.09024941149237778#2181 +-0.08526859412435395#2182 +-0.08028564494833519#2183 +-0.07530068854349398#2184 +-0.07031384953918565#2185 +-0.06532525261183263#2186 +-0.06033502248180729#2187 +-0.05534328391031391#2188 +-0.0503501616962694#2189 +-0.045355780673183285#2190 +-0.040360265706036666#2191 +-0.0353637416881605#2192 +-0.030366333538113098#2193 +-0.02536816619655706#2194 +-0.020369364623135596#2195 +-0.015370053793348397#2196 +-0.010370358695427129#2197 +-0.005370404327210579#2198 +-3.7031569301957106E-4#2199 +0.004629782199468271#2200 +0.009629764342343855#2201 +0.014629505730591961#2202 +0.019628881365216493#2203 +0.024627766256365594#2204 +0.029626035426456535#2205 +0.034623563913300286#2206 +0.03962022677322569#2207 +0.04461589908420324#2208 +0.04961045594896822#2209 +0.05460377249814327#2210 +0.0595957238933603#2211 +0.06458618533038155#2212 +0.06957503204221982#2213 +0.07456213930225787#2214 +0.07954738242736657#2215 +0.08453063678102227#2216 +0.08951177777642273#2217 +0.09449068087960201#2218 +0.0994672216125439#2219 +0.10444127555629401#2220 +0.10941271835407045#2221 +0.11438142571437276#2222 +0.11934727341408949#2223 +0.12431013730160374#2224 +0.12926989329989724#2225 +0.13422641740965233#2226 +0.13917958571235206#2227 +0.14412927437337833#2228 +0.14907535964510796#2229 +0.15401771787000634#2230 +0.15895622548371913#2231 +0.16389075901816152#2232 +0.16882119510460497#2233 +0.17374741047676162#2234 +0.17866928197386614#2235 +0.1835866865437547#2236 +0.1884995012459417#2237 +0.19340760325469306#2238 +0.1983108698620973#2239 +0.20320917848113326#2240 +0.20810240664873486#2241 +0.21299043202885284#2242 +0.2178731324155134#2243 +0.22275038573587325#2244 +0.22762207005327184#2245 +0.23248806357027976#2246 +0.23734824463174373#2247 +0.2422024917278283#2248 +0.24705068349705359#2249 +0.25189269872932957#2250 +0.25672841636898625#2251 +0.2615577155178005#2252 +0.2663804754380184#2253 +0.2711965755553738#2254 +0.276005895462103#2255 +0.280808314919955#2256 +0.28560371386319744#2257 +0.2903919724016186#2258 +0.29517297082352467#2259 +0.2999465895987326#2260 +0.3047127093815586#2261 +0.309471211013802#2262 +0.314221975527724#2263 +0.3189648841490224#2264 +0.3236998182998009#2265 +0.32842665960153344#2266 +0.3331452898780243#2267 +0.33785559115836217#2268 +0.34255744567986984#2269 +0.3472507358910483#2270 +0.3519353444545157#2271 +0.35661115424994067#2272 +0.3612780483769708#2273 +0.3659359101581552#2274 +0.37058462314186125#2275 +0.3752240711051865#2276 +0.3798541380568641#2277 +0.38447470824016255#2278 +0.3890856661357801#2279 +0.3936868964647327#2280 +0.398278284191236#2281 +0.40285971452558156#2282 +0.4074310729270065#2283 +0.4119922451065573#2284 +0.4165431170299473#2285 +0.4210835749204072#2286 +0.42561350526153013#2287 +0.4301327948001093#2288 +0.4346413305489697#2289 +0.4391389997897928#2290 +0.44362569007593455#2291 +0.44810128923523695#2292 +0.45256568537283204#2293 +0.45701876687393983#2294 +0.4614604224066586#2295 +0.46589054092474813#2296 +0.47030901167040634#2297 +0.4747157241770382#2298 +0.4791105682720174#2299 +0.48349343407944095#2300 +0.4878642120228761#2301 +0.4922227928280999#2302 +0.49656906752583113#2303 +0.5009029274544549#2304 +0.5052242642627389#2305 +0.5095329699125425#2306 +0.5138289366815181#2307 +0.5181120571658037#2308 +0.5223822242827085#2309 +0.5266393312733905#2310 +0.5308832717055243#2311 +0.5351139394759635#2312 +0.5393312288133927#2313 +0.5435350342809715#2314 +0.5477252507789714#2315 +0.5519017735474027#2316 +0.5560644981686342#2317 +0.5602133205700032#2318 +0.5643481370264177#2319 +0.5684688441629498#2320 +0.57257533895742#2321 +0.5766675187429724#2322 +0.5807452812106427#2323 +0.5848085244119148#2324 +0.5888571467612701#2325 +0.5928910470387276#2326 +0.5969101243923741#2327 +0.6009142783408853#2328 +0.6049034087760389#2329 +0.6088774159652163#2330 +0.6128362005538969#2331 +0.6167796635681417#2332 +0.6207077064170679#2333 +0.6246202308953132#2334 +0.6285171391854922#2335 +0.6323983338606407#2336 +0.6362637178866524#2337 +0.6401131946247043#2338 +0.643946667833673#2339 +0.647764041672541#2340 +0.6515652207027922#2341 +0.655350109890799#2342 +0.659118614610197#2343 +0.6628706406442522#2344 +0.6666060941882148#2345 +0.670324881851666#2346 +0.6740269106608523#2347 +0.6777120880610092#2348 +0.6813803219186766#2349 +0.685031520524001#2350 +0.688665592593029#2351 +0.692282447269989#2352 +0.6958819941295635#2353 +0.6994641431791491#2354 +0.7030288048611066#2355 +0.7065758900550001#2356 +0.7101053100798252#2357 +0.7136169766962261#2358 +0.7171108021087013#2359 +0.720586698967799#2360 +0.7240445803723011#2361 +0.7274843598713951#2362 +0.7309059514668365#2363 +0.7343092696150975#2364 +0.737694229229507#2365 +0.741060745682377#2366 +0.7444087348071191#2367 +0.7477381129003478#2368 +0.7510487967239741#2369 +0.754340703507286#2370 +0.757613750949018#2371 +0.7608678572194089#2372 +0.7641029409622473#2373 +0.7673189212969058#2374 +0.7705157178203633#2375 +0.7736932506092146#2376 +0.7768514402216689#2377 +0.7799902076995363#2378 +0.7831094745702013#2379 +0.7862091628485848#2380 +0.7892891950390938#2381 +0.7923494941375593#2382 +0.7953899836331608#2383 +0.7984105875103399#2384 +0.8014112302506999#2385 +0.8043918368348948#2386 +0.8073523327445041#2387 +0.8102926439638962#2388 +0.8132126969820789#2389 +0.8161124187945369#2390 +0.8189917369050576#2391 +0.8218505793275428#2392 +0.8246888745878095#2393 +0.8275065517253755#2394 +0.8303035402952347#2395 +0.8330797703696176#2396 +0.8358351725397396#2397 +0.8385696779175368#2398 +0.8412832181373877#2399 +0.8439757253578227#2400 +0.8466471322632202#2401 +0.8492973720654895#2402 +0.8519263785057406#2403 +0.8545340858559407#2404 +0.8571204289205576#2405 +0.8596853430381896#2406 +0.8622287640831817#2407 +0.8647506284672299#2408 +0.8672508731409697#2409 +0.8697294355955532#2410 +0.8721862538642116#2411 +0.8746212665238043#2412 +0.8770344126963554#2413 +0.8794256320505743#2414 +0.8817948648033652#2415 +0.8841420517213214#2416 +0.8864671341222059#2417 +0.8887700538764189#2418 +0.8910507534084512#2419 +0.8933091756983229#2420 +0.8955452642830101#2421 +0.8977589632578554#2422 +0.8999502172779664#2423 +0.9021189715595991#2424 +0.9042651718815273#2425 +0.9063887645863988#2426 +0.9084896965820761#2427 +0.9105679153429644#2428 +0.9126233689113248#2429 +0.9146560058985725#2430 +0.9166657754865628#2431 +0.9186526274288606#2432 +0.9206165120519969#2433 +0.922557380256711#2434 +0.9244751835191776#2435 +0.9263698738922205#2436 +0.9282414040065105#2437 +0.9300897270717504#2438 +0.9319147968778447#2439 +0.9337165677960547#2440 +0.9354949947801393#2441 +0.9372500333674811#2442 +0.9389816396801985#2443 +0.9406897704262421#2444 +0.9423743829004774#2445 +0.9440354349857524#2446 +0.9456728851539505#2447 +0.947286692467029#2448 +0.9488768165780421#2449 +0.9504432177321501#2450 +0.9519858567676133#2451 +0.9535046951167704#2452 +0.9549996948070039#2453 +0.9564708184616884#2454 +0.9579180293011254#2455 +0.9593412911434633#2456 +0.9607405684056013#2457 +0.9621158261040794#2458 +0.9634670298559528#2459 +0.9647941458796518#2460 +0.9660971409958262#2461 +0.9673759826281747#2462 +0.9686306388042597#2463 +0.9698610781563061#2464 +0.9710672699219862#2465 +0.9722491839451882#2466 +0.9734067906767705#2467 +0.9745400611753005#2468 +0.9756489671077775#2469 +0.976733480750342#2470 +0.9777935749889685#2471 +0.9788292233201428#2472 +0.9798403998515255#2473 +0.9808270793025986#2474 +0.9817892370052983#2475 +0.9827268489046308#2476 +0.9836398915592746#2477 +0.9845283421421658#2478 +0.9853921784410695#2479 +0.9862313788591346#2480 +0.9870459224154339#2481 +0.9878357887454888#2482 +0.9886009581017783#2483 +0.9893414113542325#2484 +0.9900571299907114#2485 +0.9907480961174673#2486 +0.9914142924595921#2487 +0.9920557023614497#2488 +0.9926723097870919#2489 +0.9932640993206595#2490 +0.9938310561667677#2491 +0.994373166150876#2492 +0.9948904157196429#2493 +0.9953827919412638#2494 +0.9958502825057954#2495 +0.9962928757254632#2496 +0.996710560534953#2497 +0.9971033264916883#2498 +0.9974711637760914#2499 +0.997814063191828#2500 +0.9981320161660385#2501 +0.998425014749551#2502 +0.9986930516170811#2503 +0.9989361200674141#2504 +0.9991542140235733#2505 +0.9993473280329715#2506 +0.9995154572675476#2507 +0.9996585975238872#2508 +0.9997767452233274#2509 +0.9998698974120466#2510 +0.9999380517611384#2511 +0.9999812065666697#2512 +0.9999993607497231#2513 +0.9999925138564242#2514 +0.9999606660579529#2515 +0.9999038181505387#2516 +0.9998219715554418#2517 +0.9997151283189163#2518 +0.9995832911121597#2519 +0.9994264632312462#2520 +0.9992446485970443#2521 +0.9990378517551183#2522 +0.9988060778756152#2523 +0.9985493327531352#2524 +0.9982676228065867#2525 +0.9979609550790262#2526 +0.9976293372374817#2527 +0.9972727775727617#2528 +0.9968912849992472#2529 +0.9964848690546693#2530 +0.9960535398998704#2531 +0.9955973083185508#2532 +0.9951161857169981#2533 +0.9946101841238031#2534 +0.9940793161895581#2535 +0.9935235951865417#2536 +0.9929430350083858#2537 +0.9923376501697289#2538 +0.9917074558058535#2539 +0.9910524676723069#2540 +0.990372702144508#2541 +0.9896681762173375#2542 +0.9889389075047131#2543 +0.9881849142391493#2544 +0.9874062152713015#2545 +0.9866028300694941#2546 +0.985774778719235#2547 +0.9849220819227124#2548 +0.9840447609982776#2549 +0.9831428378799122#2550 +0.9822163351166792#2551 +0.9812652758721596#2552 +0.9802896839238737#2553 +0.9792895836626858#2554 +0.9782650000921947#2555 +0.977215958828109#2556 +0.9761424860976062#2557 +0.975044608738677#2558 +0.9739223541994549#2559 +0.9727757505375291#2560 +0.9716048264192435#2561 +0.9704096111189803#2562 +0.9691901345184274#2563 +0.9679464271058321#2564 +0.9666785199752381#2565 +0.9653864448257087#2566 +0.964070233960534#2567 +0.9627299202864235#2568 +0.9613655373126828#2569 +0.959977119150377#2570 +0.9585647005114765#2571 +0.9571283167079901#2572 +0.9556680036510822#2573 +0.954183797850174#2574 +0.952675736412032#2575 +0.9511438570398394#2576 +0.9495881980322538#2577 +0.9480087982824497#2578 +0.9464056972771461#2579 +0.9447789350956192#2580 +0.9431285524087006#2581 +0.9414545904777601#2582 +0.9397570911536748#2583 +0.9380360968757817#2584 +0.9362916506708178#2585 +0.9345237961518437#2586 +0.9327325775171534#2587 +0.9309180395491696#2588 +0.9290802276133234#2589 +0.9272191876569207#2590 +0.9253349662079934#2591 +0.9234276103741358#2592 +0.9214971678413273#2593 +0.9195436868727399#2594 +0.9175672163075316#2595 +0.9155678055596256#2596 +0.9135455046164744#2597 +0.911500364037811#2598 +0.9094324349543835#2599 +0.907341769066678#2600 +0.9052284186436254#2601 +0.9030924365212947#2602 +0.9009338761015722#2603 +0.8987527913508262#2604 +0.896549236798558#2605 +0.8943232675360385#2606 +0.8920749392149308#2607 +0.8898043080458985#2608 +0.8875114307972015#2609 +0.8851963647932755#2610 +0.8828591679132993#2611 +0.880499898589748#2612 +0.8781186158069318#2613 +0.8757153790995215#2614 +0.8732902485510597#2615 +0.8708432847924594#2616 +0.8683745490004873#2617 +0.865884102896235#2618 +0.8633720087435754#2619 +0.8608383293476065#2620 +0.8582831280530807#2621 +0.8557064687428216#2622 +0.8531084158361264#2623 +0.8504890342871558#2624 +0.8478483895833098#2625 +0.8451865477435904#2626 +0.8425035753169512#2627 +0.8397995393806336#2628 +0.8370745075384897#2629 +0.8343285479192922#2630 +0.8315617291750311#2631 +0.8287741204791973#2632 +0.8259657915250532#2633 +0.8231368125238903#2634 +0.8202872542032738#2635 +0.8174171878052743#2636 +0.814526685084687#2637 +0.8116158183072371#2638 +0.8086846602477739#2639 +0.8057332841884505#2640 +0.8027617639168924#2641 +0.7997701737243521#2642 +0.7967585884038525#2643 +0.7937270832483162#2644 +0.7906757340486833#2645 +0.7876046170920171#2646 +0.7845138091595961#2647 +0.7814033875249948#2648 +0.7782734299521518#2649 +0.7751240146934253#2650 +0.7719552204876369#2651 +0.7687671265581032#2652 +0.765559812610655#2653 +0.7623333588316442#2654 +0.7590878458859399#2655 +0.7558233549149108#2656 +0.7525399675343971#2657 +0.74923776583267#2658 +0.745916832368379#2659 +0.7425772501684882#2660 +0.7392191027262007#2661 +0.7358424739988708#2662 +0.7324474484059049#2663 +0.7290341108266515#2664 +0.7256025465982785#2665 +0.7221528415136401#2666 +0.7186850818191316#2667 +0.7151993542125332#2668 +0.7116957458408429#2669 +0.7081743442980969#2670 +0.7046352376231804#2671 +0.7010785142976261#2672 +0.6975042632434023#2673 +0.6939125738206897#2674 +0.6903035358256472#2675 +0.6866772394881667#2676 +0.6830337754696181#2677 +0.6793732348605815#2678 +0.6756957091785708#2679 +0.6720012903657451#2680 +0.6682900707866103#2681 +0.6645621432257096#2682 +0.6608176008853044#2683 +0.6570565373830433#2684 +0.6532790467496223#2685 +0.6494852234264336#2686 +0.6456751622632042#2687 +0.6418489585156252#2688 +0.6380067078429696#2689 +0.6341485063057015#2690 +0.6302744503630737#2691 +0.6263846368707164#2692 +0.6224791630782159#2693 +0.6185581266266833#2694 +0.6146216255463127#2695
\ No newline at end of file diff --git a/MPChartExample/src/main/assets/hugesine.txt b/MPChartExample/src/main/assets/hugesine.txt new file mode 100644 index 00000000..cdb7f806 --- /dev/null +++ b/MPChartExample/src/main/assets/hugesine.txt @@ -0,0 +1,2696 @@ +0.0#0 +0.004999979054935396#1 +0.009999833110660423#2 +0.014999437171089681#3 +0.019998666246387648#4 +0.02499739628712495#5 +0.029995501394052156#6 +0.034992854753256544#7 +0.039989333293279646#8 +0.044984812102470316#9 +0.0499791662941706#10 +0.05497227100983794#11 +0.05996400142216657#12 +0.06495423645563163#13 +0.06994284763482612#14 +0.0749297102445966#15 +0.0799146996135038#16 +0.08489769111693939#17 +0.08987856018024168#18 +0.09485718228180992#19 +0.09983343295621734#20 +0.10480718779732277#21 +0.10977832246138083#22 +0.1147467126701505#23 +0.11971223421400208#24 +0.12467476295502239#25 +0.1296341674424065#26 +0.1345903310885377#27 +0.13954312998981938#28 +0.14449244032677305#29 +0.1494381383671341#30 +0.15438010046894496#31 +0.15931820308364608#32 +0.16425232275916476#33 +0.1691823361430014#34 +0.17410811998531325#35 +0.17902955114199567#36 +0.18394650657776077#37 +0.18885886336921315#38 +0.19376649870792312#39 +0.1986692899034969#40 +0.20356711438664365#41 +0.20845984971224#42 +0.2133473735623909#43 +0.2182295637494877#44 +0.22310629821926284#45 +0.2279774550538411#46 +0.23284291247478758#47 +0.2377025488461522#48 +0.24255624267751047#49 +0.24740387262700086#50 +0.2522453175043583#51 +0.25708045627394377#52 +0.26190916805777054#53 +0.2667313321385257#54 +0.2715468279625883#55 +0.2763555351430432#56 +0.28115733346269056#57 +0.2859521028770516#58 +0.2907397235173692#59 +0.295520075693605#60 +0.3002930398974316#61 +0.30505849680522#62 +0.30981632728102304#63 +0.3145664123795534#64 +0.31930863334915754#65 +0.32404287163478435#66 +0.328769008880949#67 +0.33348692693469184#68 +0.3381965078485323#69 +0.3428976338834172#70 +0.3475901875116649#71 +0.35227405141990276#72 +0.35694910851200035#73 +0.3616152419119968#74 +0.36627233496702266#75 +0.37092027125021615#76 +0.37555893456363393#77 +0.3801882089411559#78 +0.3848079786513845#79 +0.38941812820053784#80 +0.3940185423353372#81 +0.3986091060458881#82 +0.40318970456855585#83 +0.40776022338883433#84 +0.412320548244209#85 +0.4168705651270134#86 +0.42141016028727957#87 +0.42593922023558123#88 +0.4304576317458716#89 +0.4349652818583137#90 +0.4394620578821044#91 +0.4439478473982918#92 +0.44842253826258544#93 +0.45288601860816025#94 +0.4573381768484528#95 +0.46177890167995134#96 +0.46620808208497805#97 +0.4706256073344647#98 +0.4750313669907208#99 +0.4794252509101945#100 +0.48380717532846257#101 +0.4881769784616124#102 +0.49253457721900457#103 +0.4968798626611048#104 +0.5012127261562106#105 +0.505533059383167#106 +0.509840754334074#107 +0.5141357033169881#108 +0.5184177989586127#109 +0.5226869342069844#110 +0.5269430023341476#111 +0.5311858969388239#112 +0.5354155119490714#113 +0.539631741624937#114 +0.5438344805610992#115 +0.548023623689504#116 +0.552199066281991#117 +0.5563607039529122#118 +0.5605084326617409#119 +0.5646421487156731#120 +0.56876174877222#121 +0.5728671298417911#122 +0.5769581892902693#123 +0.5810348248415764#124 +0.5850969345802306#125 +0.5891444169538934#126 +0.5931771707759095#127 +0.5971950952278355#128 +0.6011980898619611#129 +0.6051860546038197#130 +0.6091588897546907#131 +0.6131164959940917#132 +0.6170587743822614#133 +0.6209856263626335#134 +0.6248969537643004#135 +0.6287926588044671#136 +0.6326726440908963#137 +0.636536812624343#138 +0.6403850678009793#139 +0.6442173134148097#140 +0.6480334536600763#141 +0.6518333931336534#142 +0.6556170368374337#143 +0.6593842901807018#144 +0.6631350589824999#145 +0.6668692494739825#146 +0.6705867683007596#147 +0.6742875225252314#148 +0.6779714196289115#149 +0.68163836751474#150 +0.6852882745093856#151 +0.6889210493655373#152 +0.6925366012641864#153 +0.6961348398168961#154 +0.6997156750680613#155 +0.7032790174971584#156 +0.7068247780209818#157 +0.7103528679958724#158 +0.7138631992199327#159 +0.7173556839352323#160 +0.7208302348300019#161 +0.7242867650408156#162 +0.727725188154763#163 +0.7311454182116094#164 +0.7345473697059445#165 +0.7379309575893204#166 +0.7412960972723774#167 +0.7446427046269596#168 +0.7479706959882166#169 +0.7512799881566965#170 +0.7545704984004253#171 +0.7578421444569752#172 +0.761094844535521#173 +0.7643285173188856#174 +0.7675430819655717#175 +0.770738458111784#176 +0.7739145658734377#177 +0.7770713258481553#178 +0.7802086591172528#179 +0.7833264872477111#180 +0.7864247322941383#181 +0.7895033168007173#182 +0.7925621638031424#183 +0.7956011968305438#184 +0.798620339907399#185 +0.8016195175554323#186 +0.8045986547955016#187 +0.8075576771494735#188 +0.8104965106420838#189 +0.8134150818027889#190 +0.8163133176676006#191 +0.8191911457809117#192 +0.8220484941973062#193 +0.824885291483359#194 +0.8277014667194208#195 +0.8304969495013919#196 +0.8332716699424813#197 +0.836025558674955#198 +0.8387585468518693#199 +0.8414705661487928#200 +0.8441615807188985#201 +0.8468314591291413#202 +0.8494801668373914#203 +0.8521076376262205#204 +0.854713805809121#205 +0.8572986062321484#206 +0.8598619742755498#207 +0.86240384585538#208 +0.8649241574251031#209 +0.8674228459771812#210 +0.86989984904465#211 +0.8723551047026797#212 +0.8747885515701239#213 +0.8772001288110537#214 +0.8795897761362788#215 +0.8819574338048541#216 +0.8843030426255745#217 +0.8866265439584532#218 +0.8889278797161889#219 +0.8912069923656172#220 +0.8934638249291491#221 +0.8956983209861958#222 +0.8979104246745789#223 +0.9001000806919267#224 +0.9022672342970574#225 +0.9044118313113468#226 +0.9065338181200838#227 +0.9086331416738097#228 +0.9107097494896452#229 +0.9127635896526021#230 +0.914794610816881#231 +0.9168027622071557#232 +0.9187879936198416#233 +0.9207502554243516#234 +0.9226894985643364#235 +0.9246056745589107#236 +0.926498735503866#237 +0.9283686340728675#238 +0.9302153235186376#239 +0.9320387576741243#240 +0.9338388909536556#241 +0.9356156783540791#242 +0.9373690754558872#243 +0.9390990384243272#244 +0.9408055240104976#245 +0.9424884895524287#246 +0.9441478929761501#247 +0.9457836927967417#248 +0.9473958481193712#249 +0.9489843186403163#250 +0.9505490646479725#251 +0.9520900470238457#252 +0.9536072272435304#253 +0.9551005673776722#254 +0.956570030092917#255 +0.9580155786528433#256 +0.9594371769188814#257 +0.9608347893512166#258 +0.9622083810096773#259 +0.9635579175546092#260 +0.9648833652477333#261 +0.9661846909529896#262 +0.9674618621373652#263 +0.968714846871708#264 +0.9699436138315244#265 +0.9711481322977632#266 +0.9723283721575829#267 +0.9734843039051048#268 +0.9746158986421505#269 +0.9757231280789643#270 +0.976805964534921#271 +0.977864380939217#272 +0.9788983508315481#273 +0.9799078483627698#274 +0.9808928482955447#275 +0.9818533260049728#276 +0.982789257479207#277 +0.983700619320054#278 +0.9845873887435587#279 +0.9854495435805739#280 +0.9862870622773147#281 +0.9870999238958973#282 +0.9878881081148623#283 +0.9886515952296827#284 +0.989390366153257#285 +0.9901044024163859#286 +0.9907936861682338#287 +0.9914582001767759#288 +0.9920979278292281#289 +0.9927128531324629#290 +0.9933029607134094#291 +0.9938682358194365#292 +0.9944086643187232#293 +0.9949242327006109#294 +0.9954149280759416#295 +0.9958807381773795#296 +0.996321651359719#297 +0.9967376566001742#298 +0.9971287434986558#299 +0.9974949022780301#300 +0.9978361237843644#301 +0.9981523994871551#302 +0.9984437214795409#303 +0.9987100824785012#304 +0.9989514758250378#305 +0.9991678954843409#306 +0.9993593360459406#307 +0.9995257927238421#308 +0.999667261356645#309 +0.9997837384076474#310 +0.999875220964935#311 +0.9999417067414528#312 +0.9999831940750629#313 +0.9999996819285863#314 +0.9999911698898283#315 +0.9999576581715889#316 +0.9998991476116578#317 +0.9998156396727931#318 +0.9997071364426849#319 +0.9995736406339033#320 +0.9994151555838301#321 +0.9992316852545756#322 +0.9990232342328801#323 +0.9987898077299979#324 +0.9985314115815687#325 +0.99824805224747#326 +0.9979397368116573#327 +0.9976064729819855#328 +0.9972482690900171#329 +0.9968651340908137#330 +0.9964570775627121#331 +0.9960241097070848#332 +0.9955662413480848#333 +0.9950834839323757#334 +0.9945758495288444#335 +0.9940433508283006#336 +0.9934860011431585#337 +0.992903814407105#338 +0.9922968051747499#339 +0.9916649886212637#340 +0.9910083805419974#341 +0.9903269973520871#342 +0.9896208560860447#343 +0.9888899743973315#344 +0.9881343705579168#345 +0.9873540634578211#346 +0.986549072604644#347 +0.9857194181230767#348 +0.9848651207543984#349 +0.983986201855958#350 +0.9830826834006404#351 +0.9821545879763167#352 +0.9812019387852801#353 +0.9802247596436652#354 +0.979223074980853#355 +0.9781969098388603#356 +0.9771462898717133#357 +0.976071241344806#358 +0.9749717911342447#359 +0.9738479667261749#360 +0.9726997962160945#361 +0.9715273083081519#362 +0.9703305323144278#363 +0.9691094981542024#364 +0.9678642363532083#365 +0.966594778042866#366 +0.9653011549595066#367 +0.9639833994435784#368 +0.9626415444388374#369 +0.9612756234915253#370 +0.9598856707495291#371 +0.958471720961529#372 +0.9570338094761285#373 +0.9555719722409712#374 +0.9540862458018422#375 +0.9525766673017544#376 +0.9510432744800195#377 +0.9494861056713051#378 +0.9479051998046761#379 +0.9463005964026214#380 +0.9446723355800661#381 +0.9430204580433682#382 +0.9413450050893013#383 +0.9396460186040221#384 +0.9379235410620234#385 +0.9361776155250716#386 +0.9344082856411311#387 +0.9326155956432726#388 +0.9307995903485671#389 +0.9289603151569656#390 +0.9270978160501647#391 +0.925212139590456#392 +0.9233033329195631#393 +0.9213714437574622#394 +0.9194165204011896#395 +0.9174386117236342#396 +0.9154377671723155#397 +0.9134140367681479#398 +0.9113674711041895#399 +0.9092981213443776#400 +0.9072059890724946#401 +0.9050911756599126#402 +0.902953733979277#403 +0.9007937174689649#404 +0.898611180131748#405 +0.8964061765334441#406 +0.8941787618015519#407 +0.8919289916238724#408 +0.8896569222471179#409 +0.8873626104755045#410 +0.8850461136693325#411 +0.8827074897435527#412 +0.8803467971663178#413 +0.8779640949575208#414 +0.8755594426873197#415 +0.8731329004746476#416 +0.8706845289857109#417 +0.8682143894324711#418 +0.8657225435711151#419 +0.8632090537005115#420 +0.8606739826606526#421 +0.8581173938310835#422 +0.8555393511293177#423 +0.8529399190092387#424 +0.850319162459489#425 +0.8476771470018452#426 +0.8450139386895795#427 +0.842329604105809#428 +0.8396242103618303#429 +0.8368978250954424#430 +0.834150516469255#431 +0.8313823531689846#432 +0.8285934044017377#433 +0.8257837398942797#434 +0.8229534298912926#435 +0.8201025451536179#436 +0.8172311569564884#437 +0.8143393370877454#438 +0.8114271578460446#439 +0.8084946920390479#440 +0.8055420129816038#441 +0.8025691944939141#442 +0.7995763108996882#443 +0.7965634370242852#444 +0.7935306481928431#445 +0.7904780202283956#446 +0.7874056294499762#447 +0.7843135526707103#448 +0.7812018671958952#449 +0.7780706508210667#450 +0.7749199818300545#451 +0.7717499389930249#452 +0.7685606015645116#453 +0.7653520492814341#454 +0.7621243623611044#455 +0.7588776214992211#456 +0.7556119078678523#457 +0.7523273031134061#458 +0.7490238893545893#459 +0.745701749180354#460 +0.7423609656478338#461 +0.7390016222802662#462 +0.7356238030649047#463 +0.7322275924509196#464 +0.7288130753472859#465 +0.7253803371206611#466 +0.7219294635932505#467 +0.7184605410406618#468 +0.7149736561897481#469 +0.7114688962164394#470 +0.7079463487435635#471 +0.704406101838655#472 +0.7008482440117536#473 +0.6972728642131915#474 +0.6936800518313689#475 +0.6900698966905202#476 +0.6864424890484673#477 +0.6827979195943634#478 +0.6791362794464263#479 +0.6754576601496591#480 +0.6717621536735627#481 +0.6680498524098356#482 +0.6643208491700646#483 +0.660575237183404#484 +0.6568131100942449#485 +0.6530345619598739#486 +0.649239687248122#487 +0.6454285808350021#488 +0.6416013380023377#489 +0.63775805443538#490 +0.6338988262204165#491 +0.6300237498423682#492 +0.6261329221823773#493 +0.6222264405153853#494 +0.6183044025077014#495 +0.6143669062145596#496 +0.6104140500776686#497 +0.6064459329227493#498 +0.6024626539570654#499 +0.598464312766942#500 +0.5944510093152764#501 +0.5904228439390387#502 +0.5863799173467634#503 +0.5823223306160317#504 +0.5782501851909438#505 +0.5741635828795839#506 +0.5700626258514734#507 +0.5659474166350176#508 +0.5618180581149423#509 +0.557674653529721#510 +0.5535173064689943#511 +0.5493461208709801#512 +0.5451612010198745#513 +0.5409626515432452#514 +0.5367505774094152#515 +0.5325250839248391#516 +0.5282862767314693#517 +0.5240342618041163#518 +0.5197691454477974#519 +0.5154910342950808#520 +0.5112000353034183#521 +0.506896255752472#522 +0.5025798032414317#523 +0.4982507856863252#524 +0.4939093113173202#525 +0.4895554886760182#526 +0.48518942661274117#527 +0.48081123428380973#528 +0.4764210211488147#529 +0.4720188969678799#530 +0.4676049717989185#531 +0.46317935599488125#532 +0.4587421602009975#533 +0.4542934953520089#534 +0.4498334726693962#535 +0.4453622036585983#536 +0.4408798001062245#537 +0.43638637407726#538 +0.4318820379122638#539 +0.42736690422456025#540 +0.4228410858974236#541 +0.4183046960812557#542 +0.4137578481907573#543 +0.4092006559020922#544 +0.40463323315004573#545 +0.4000556941251757#546 +0.3954681532709581#547 +0.3908707252809253#548 +0.38626352509579903#549 +0.38164666790061647#550 +0.3770202691218507#551 +0.37238444442452473#552 +0.3677393097093199#553 +0.3630849811096781#554 +0.3584215749888984#555 +0.35374920793722775#556 +0.3490679967689464#557 +0.34437805851944686#558 +0.33967951044230843#559 +0.3349724700063654#560 +0.3302570548927703#561 +0.3255333829920518#562 +0.32080157240116725#563 +0.3160617414205501#564 +0.31131400855115243#565 +0.30655849249148204#566 +0.301795312134635#567 +0.29702458656532327#568 +0.2922464350568973#569 +0.28746097706836404#570 +0.2826683322414007#571 +0.277868620397363#572 +0.27306196153428997#573 +0.26824847582390365#574 +0.26342828360860476#575 +0.25860150539846394#576 +0.25376826186820883#577 +0.2489286738542073#578 +0.2440828623514461#579 +0.23923094851050605#580 +0.2343730536345331#581 +0.22950929917620558#582 +0.22463980673469777#583 +0.21976469805263985#584 +0.21488409501307412#585 +0.20999811963640783#586 +0.20510689407736246#587 +0.20021054062191992#588 +0.19530918168426498#589 +0.19040293980372505#590 +0.18549193764170635#591 +0.18057629797862745#592 +0.1756561437108494#593 +0.17073159784760336#594 +0.16580278350791516#595 +0.16086982391752722#596 +0.15593284240581773#597 +0.1509919624027173#598 +0.1460473074356231#599 +0.14109900112631057#600 +0.13614716718784262#601 +0.13119192942147676#602 +0.12623341171356992#603 +0.12127173803248116#604 +0.11630703242547231#605 +0.11133941901560669#606 +0.10636902199864583#607 +0.10139596563994446#608 +0.09642037427134383#609 +0.09144237228806312#610 +0.08646208414558959#611 +0.08147963435656692#612 +0.07649514748768235#613 +0.07150874815655232#614 +0.06652056102860693#615 +0.061530710813973134#616 +0.05653932226435689#617 +0.05154652016992419#618 +0.04655242935618122#619 +0.041557174680853536#620 +0.036560881030764505#621 +0.03156367331871301#622 +0.026565676480350457#623 +0.021567015471057303#624 +0.01656781526281898#625 +0.011568200841101498#626 +0.006568297201726647#627 +0.0015682293477469766#628 +-0.0034318777136794184#629 +-0.008431898974414214#630 +-0.013431709428464198#631 +-0.018431184075106553#632 +-0.023430197922014017#633 +-0.028428625988379825#634 +-0.03342634330804237#635 +-0.03842322493260946#636 +-0.043419145934582244#637 +-0.04841398141047844#638 +-0.05340760648395512#639 +-0.058399896308930756#640 +-0.06339072607270646#641 +-0.06837997099908648#642 +-0.07336750635149775#643 +-0.0783532074361084#644 +-0.08333694960494524#645 +-0.08831860825901015#646 +-0.09329805885139517#647 +-0.09827517689039623#648 +-0.1032498379426257#649 +-0.10822191763612327#650 +-0.11319129166346542#651 +-0.11815783578487328#652 +-0.12312142583131866#653 +-0.12808193770762852#654 +-0.1330392473955874#655 +-0.13799323095703808#656 +-0.1429437645369801#657 +-0.1478907243666663#658 +-0.15283398676669727#659 +-0.15777342815011328#660 +-0.1627089250254842#661 +-0.16764035399999697#662 +-0.17256759178254044#663 +-0.17749051518678788#664 +-0.18240900113427666#665 +-0.1873229266574855#666 +-0.19223216890290867#667 +-0.19713660513412748#668 +-0.20203611273487887#669 +-0.20693056921212094#670 +-0.21181985219909538#671 +-0.21670383945838675#672 +-0.22158240888497865#673 +-0.22645543850930638#674 +-0.23132280650030634#675 +-0.236184391168462#676 +-0.2410400709688461#677 +-0.24588972450415972#678 +-0.25073323052776697#679 +-0.2555704679467265#680 +-0.260401315824819#681 +-0.2652256533855707#682 +-0.2700433600152726#683 +-0.2748543152659966#684 +-0.2796583988586061#685 +-0.2844554906857637#686 +-0.28924547081493374#687 +-0.29402821949138064#688 +-0.29880361714116316#689 +-0.30357154437412376#690 +-0.30833188198687345#691 +-0.313084510965772#692 +-0.3178293124899034#693 +-0.3225661679340468#694 +-0.3272949588716418#695 +-0.3320155670777495#696 +-0.33672787453200825#697 +-0.3414317634215843#698 +-0.3461271161441173#699 +-0.3508138153106602#700 +-0.3554917437486143#701 +-0.360160784504659#702 +-0.3648208208476751#703 +-0.3694717362716637#704 +-0.3741134144986589#705 +-0.3787457394816348#706 +-0.3833685954074067#707 +-0.3879818666995268#708 +-0.39258543802117346#709 +-0.39717919427803516#710 +-0.40176302062118746#711 +-0.4063368024499648#712 +-0.4109004254148252#713 +-0.41545377542020967#714 +-0.4199967386273943#715 +-0.42452920145733636#716 +-0.4290510505935143#717 +-0.4335621729847602#718 +-0.4380624558480867#719 +-0.44255178667150635#720 +-0.4470300532168448#721 +-0.4514971435225466#722 +-0.45595294590647456#723 +-0.4603973489687018#724 +-0.4648302415942971#725 +-0.46925151295610257#726 +-0.4736610525175046#727 +-0.4780587500351976#728 +-0.4824444955619397#729 +-0.48681817944930217#730 +-0.49117969235041026#731 +-0.49552892522267716#732 +-0.49986576933053034#733 +-0.5041901162481297#734 +-0.5085018578620788#735 +-0.5128008863741274#736 +-0.5170870943038667#737 +-0.5213603744914164#738 +-0.525620620100104#739 +-0.5298677246191358#740 +-0.5341015818662594#741 +-0.5383220859904191#742 +-0.5425291314744012#743 +-0.5467226131374734#744 +-0.5509024261380133#745 +-0.5550684659761302#746 +-0.5592206284962774#747 +-0.5633588098898563#748 +-0.567482906697812#749 +-0.5715928158132192#750 +-0.5756884344838606#751 +-0.5797696603147958#752 +-0.5838363912709209#753 +-0.5878885256795198#754 +-0.5919259622328059#755 +-0.5959485999904551#756 +-0.5999563383821296#757 +-0.6039490772099917#758 +-0.6079267166512093#759 +-0.6118891572604515#760 +-0.6158362999723747#761 +-0.6197680461040995#762 +-0.6236842973576779#763 +-0.6275849558225506#764 +-0.6314699239779953#765 +-0.6353391046955643#766 +-0.6391924012415132#767 +-0.6430297172792194#768 +-0.6468509568715902#769 +-0.6506560244834619#770 +-0.6544448249839876#771 +-0.6582172636490162#772 +-0.6619732461634604#773 +-0.6657126786236544#774 +-0.6694354675397021#775 +-0.673141519837814#776 +-0.6768307428626346#777 +-0.6805030443795581#778 +-0.6841583325770354#779 +-0.6877965160688687#780 +-0.6914175038964966#781 +-0.6950212055312681#782 +-0.6986075308767059#783 +-0.7021763902707588#784 +-0.7057276944880437#785 +-0.7092613547420759#786 +-0.7127772826874891#787 +-0.7162753904222441#788 +-0.7197555904898263#789 +-0.7232177958814328#790 +-0.7266619200381466#791 +-0.7300878768531017#792 +-0.7334955806736356#793 +-0.7368849463034304#794 +-0.7402558890046429#795 +-0.7436083245000233#796 +-0.7469421689750226#797 +-0.750257339079887#798 +-0.7535537519317426#799 +-0.7568311692838212#800 +-0.7600898217630833#801 +-0.7633294711665292#802 +-0.766550036499385#803 +-0.7697514372439996#804 +-0.7729335933618572#805 +-0.7760964252955789#806 +-0.7792398539709117#807 +-0.7823638007987046#808 +-0.785468187676875#809 +-0.7885529369923596#810 +-0.791617971623056#811 +-0.7946632149397506#812 +-0.7976885908080338#813 +-0.8006940235902041#814 +-0.8036794381471594#815 +-0.8066447598402743#816 +-0.8095899145332676#817 +-0.8125148285940548#818 +-0.8154194288965894#819 +-0.818303642822691#820 +-0.821167398263861#821 +-0.8240106236230851#822 +-0.8268332478166237#823 +-0.8296352002757886#824 +-0.8324164109487077#825 +-0.8351768103020761#826 +-0.8379163293228948#827 +-0.8406348995201958#828 +-0.8433324529267544#829 +-0.846008922100789#830 +-0.8486642401276465#831 +-0.851298340621476#832 +-0.8539111577268875#833 +-0.8565026261205996#834 +-0.8590726810130714#835 +-0.8616212581501235#836 +-0.8641482938145434#837 +-0.8666537248276792#838 +-0.8691374885510188#839 +-0.871599522887756#840 +-0.874039766284343#841 +-0.8764581577320294#842 +-0.8788546367683873#843 +-0.8812291434788229#844 +-0.8835816184980748#845 +-0.8859120030116978#846 +-0.8882202387575335#847 +-0.8905062680271669#848 +-0.8927700336673693#849 +-0.8950114790815267#850 +-0.8972305482310553#851 +-0.8994271856368026#852 +-0.9016013363804337#853 +-0.9037529461058055#854 +-0.9058819610203243#855 +-0.9079883278962918#856 +-0.910071994072235#857 +-0.9121329074542238#858 +-0.9141710165171721#859 +-0.9161862703061274#860 +-0.9181786184375433#861 +-0.9201480111005403#862 +-0.9220943990581507#863 +-0.9240177336485493#864 +-0.9259179667862707#865 +-0.9277950509634104#866 +-0.9296489392508137#867 +-0.9314795852992485#868 +-0.9332869433405637#869 +-0.9350709681888342#870 +-0.93683161524149#871 +-0.9385688404804313#872 +-0.94028260047313#873 +-0.9419728523737139#874 +-0.9436395539240392#875 +-0.9452826634547468#876 +-0.9469021398863032#877 +-0.948497942730029#878 +-0.9500700320891098#879 +-0.9516183686595943#880 +-0.953142913731377#881 +-0.9546436291891659#882 +-0.9561204775134351#883 +-0.9575734217813633#884 +-0.9590024256677567#885 +-0.9604074534459575#886 +-0.961788469988736#887 +-0.9631454407691704#888 +-0.9644783318615088#889 +-0.965787109942018#890 +-0.9670717422898164#891 +-0.9683321967876919#892 +-0.9695684419229054#893 +-0.970780446787978#894 +-0.9719681810814642#895 +-0.9731316151087093#896 +-0.9742707197825917#897 +-0.9753854666242503#898 +-0.9764758277637964#899 +-0.9775417759410103#900 +-0.9785832845060235#901 +-0.9796003274199839#902 +-0.980592879255708#903 +-0.9815609151983155#904 +-0.9825044110458504#905 +-0.983423343209886#906 +-0.9843176887161145#907 +-0.9851874252049211#908 +-0.9860325309319437#909 +-0.9868529847686158#910 +-0.9876487662026955#911 +-0.9884198553387775#912 +-0.9891662328987912#913 +-0.9898878802224824#914 +-0.9905847792678797#915 +-0.9912569126117455#916 +-0.9919042634500123#917 +-0.9925268155982018#918 +-0.9931245534918303#919 +-0.9936974621867977#920 +-0.9942455273597606#921 +-0.9947687353084911#922 +-0.995267072952219#923 +-0.9957405278319587#924 +-0.9961890881108212#925 +-0.9966127425743095#926 +-0.9970114806305993#927 +-0.9973852923108035#928 +-0.9977341682692219#929 +-0.9980580997835744#930 +-0.9983570787552193#931 +-0.9986310977093558#932 +-0.9988801497952104#933 +-0.9991042287862094#934 +-0.999303329080133#935 +-0.9994774456992562#936 +-0.9996265742904736#937 +-0.9997507111254075#938 +-0.9998498531005012#939 +-0.9999239977370973#940 +-0.9999731431814987#941 +-0.9999972882050158#942 +-0.9999964322039964#943 +-0.9999705751998416#944 +-0.9999197178390047#945 +-0.9998438613929753#946 +-0.9997430077582475#947 +-0.9996171594562722#948 +-0.9994663196333945#949 +-0.9992904920607747#950 +-0.9990896811342941#951 +-0.9988638918744454#952 +-0.9986131299262065#953 +-0.9983374015589003#954 +-0.998036713666037#955 +-0.9977110737651422#956 +-0.9973604899975695#957 +-0.9969849711282959#958 +-0.9965845265457033#959 +-0.9961591662613436#960 +-0.9957089009096887#961 +-0.995233741747864#962 +-0.9947337006553678#963 +-0.9942087901337736#964 +-0.9936590233064178#965 +-0.9930844139180716#966 +-0.9924849763345973#967 +-0.9918607255425893#968 +-0.9912116771489994#969 +-0.9905378473807462#970 +-0.9898392530843103#971 +-0.9891159117253119#972 +-0.9883678413880752#973 +-0.9875950607751759#974 +-0.9867975892069732#975 +-0.9859754466211276#976 +-0.9851286535721018#977 +-0.9842572312306469#978 +-0.9833612013832734#979 +-0.9824405864317063#980 +-0.9814954093923248#981 +-0.9805256938955875#982 +-0.9795314641854411#983 +-0.9785127451187143#984 +-0.9774695621644967#985 +-0.9764019414035013#986 +-0.9753099095274137#987 +-0.9741934938382235#988 +-0.9730527222475426#989 +-0.9718876232759065#990 +-0.9706982260520625#991 +-0.9694845603122403#992 +-0.9682466563994092#993 +-0.9669845452625191#994 +-0.9656982584557271#995 +-0.9643878281376085#996 +-0.9630532870703526#997 +-0.9616946686189439#998 +-0.9603120067503278#999 +-0.9589053360325611#1000 +-0.9574746916339486#1001 +-0.956020109322163#1002 +-0.9545416254633506#1003 +-0.9530392770212234#1004 +-0.9515131015561331#1005 +-0.9499631372241336#1006 +-0.9483894227760262#1007 +-0.9467919975563913#1008 +-0.9451709015026041#1009 +-0.9435261751438369#1010 +-0.9418578596000451#1011 +-0.9401659965809398#1012 +-0.9384506283849444#1013 +-0.9367117978981377#1014 +-0.9349495485931812#1015 +-0.9331639245282325#1016 +-0.9313549703458437#1017 +-0.9295227312718454#1018 +-0.9276672531142157#1019 +-0.9257885822619355#1020 +-0.9238867656838282#1021 +-0.9219618509273857#1022 +-0.9200138861175796#1023 +-0.9180429199556578#1024 +-0.9160490017179275#1025 +-0.9140321812545226#1026 +-0.9119925089881575#1027 +-0.9099300359128673#1028 +-0.9078448135927315#1029 +-0.9057368941605859#1030 +-0.9036063303167189#1031 +-0.9014531753275539#1032 +-0.8992774830243175#1033 +-0.897079307801694#1034 +-0.894858704616465#1035 +-0.8926157289861357#1036 +-0.8903504369875471#1037 +-0.8880628852554737#1038 +-0.8857531309812073#1039 +-0.883421231911128#1040 +-0.8810672463452596#1041 +-0.8786912331358127#1042 +-0.8762932516857129#1043 +-0.8738733619471158#1044 +-0.8714316244199084#1045 +-0.8689681001501958#1046 +-0.8664828507287758#1047 +-0.8639759382895988#1048 +-0.8614474255082142#1049 +-0.8588973756002032#1050 +-0.8563258523195992#1051 +-0.8537329199572933#1052 +-0.8511186433394268#1053 +-0.8484830878257706#1054 +-0.8458263193080918#1055 +-0.8431484042085053#1056 +-0.8404494094778137#1057 +-0.8377294025938334#1058 +-0.8349884515597079#1059 +-0.8322266249022069#1060 +-0.8294439916700137#1061 +-0.8266406214319988#1062 +-0.8238165842754801#1063 +-0.8209719508044716#1064 +-0.8181067921379171#1065 +-0.8152211799079132#1066 +-0.8123151862579177#1067 +-0.809388883840946#1068 +-0.806442345817755#1069 +-0.8034756458550141#1070 +-0.8004888581234628#1071 +-0.7974820572960571#1072 +-0.7944553185461021#1073 +-0.7914087175453727#1074 +-0.7883423304622218#1075 +-0.785256233959676#1076 +-0.7821505051935191#1077 +-0.7790252218103625#1078 +-0.7758804619457047#1079 +-0.7727163042219776#1080 +-0.7695328277465804#1081 +-0.7663301121099025#1082 +-0.7631082373833333#1083 +-0.7598672841172602#1084 +-0.7566073333390553#1085 +-0.7533284665510486#1086 +-0.7500307657284918#1087 +-0.7467143133175076#1088 +-0.7433791922330286#1089 +-0.7400254858567255#1090 +-0.7366532780349208#1091 +-0.7332626530764935#1092 +-0.7298536957507715#1093 +-0.7264264912854116#1094 +-0.722981125364269#1095 +-0.7195176841252552#1096 +-0.7160362541581846#1097 +-0.712536922502609#1098 +-0.7090197766456425#1099 +-0.7054849045197733#1100 +-0.7019323945006657#1101 +-0.698362335404951#1102 +-0.6947748164880059#1103 +-0.6911699274417223#1104 +-0.6875477583922642#1105 +-0.6839083998978144#1106 +-0.6802519429463105#1107 +-0.6765784789531705#1108 +-0.6728880997590068#1109 +-0.6691808976273305#1110 +-0.6654569652422443#1111 +-0.6617163957061256#1112 +-0.6579592825372989#1113 +-0.6541857196676971#1114 +-0.6503958014405143#1115 +-0.6465896226078459#1116 +-0.6427672783283204#1117 +-0.6389288641647198#1118 +-0.6350744760815914#1119 +-0.6312042104428474#1120 +-0.6273181640093562#1121 +-0.6234164339365238#1122 +-0.6194991177718638#1123 +-0.6155663134525595#1124 +-0.6116181193030148#1125 +-0.6076546340323961#1126 +-0.6036759567321645#1127 +-0.5996821868735988#1128 +-0.5956734243053078#1129 +-0.5916497692507348#1130 +-0.5876113223056512#1131 +-0.583558184435642#1132 +-0.5794904569735814#1133 +-0.575408241617099#1134 +-0.5713116404260383#1135 +-0.5672007558199036#1136 +-0.5630756905753006#1137 +-0.5589365478233664#1138 +-0.5547834310471911#1139 +-0.5506164440792306#1140 +-0.546435691098711#1141 +-0.5422412766290237#1142 +-0.5380333055351117#1143 +-0.5338118830208493#1144 +-0.5295771146264103#1145 +-0.5253291062256306#1146 +-0.5210679640233601#1147 +-0.5167937945528087#1148 +-0.512506704672882#1149 +-0.5082068015655098#1150 +-0.5038941927329669#1151 +-0.4995689859951847#1152 +-0.4952312894870563#1153 +-0.4908812116557327#1154 +-0.48651886125791133#1155 +-0.48214434735711736#1156 +-0.4777577793209766#1157 +-0.4733592668184817#1158 +-0.4689489198172499#1159 +-0.46452684858077364#1160 +-0.4600931636656643#1161 +-0.4556479759188878#1162 +-0.4511913964749934#1163 +-0.4467235367533354#1164 +-0.4422445084552871#1165 +-0.43775442356144867#1166 +-0.4332533943288471#1167 +-0.4287415332881297#1168 +-0.4242189532407511#1169 +-0.4196857672561526#1170 +-0.4151420886689356#1171 +-0.4105880310760279#1172 +-0.406023708333844#1173 +-0.40144923455543813#1174 +-0.39686472410765167#1175 +-0.39227029160825355#1176 +-0.387666051923075#1177 +-0.3830521201631375#1178 +-0.37842861168177494#1179 +-0.37379564207174987#1180 +-0.36915332716236315#1181 +-0.3645017830165586#1182 +-0.3598411259280209#1183 +-0.3551714724182682#1184 +-0.3504929392337391#1185 +-0.3458056433428737#1186 +-0.3411097019331894#1187 +-0.336405232408351#1188 +-0.3316923523852354#1189 +-0.3269711796909913#1190 +-0.32224183236009313#1191 +-0.3175044286313901#1192 +-0.3127590869451504#1193 +-0.3080059259400996#1194 +-0.3032450644504549#1195 +-0.29847662150295395#1196 +-0.29370071631387923#1197 +-0.2889174682860773#1198 +-0.28412699700597377#1199 +-0.2793294222405835#1200 +-0.2745248639345161#1201 +-0.2697134422069774#1202 +-0.26489527734876633#1203 +-0.2600704898192674#1204 +-0.25523920024343905#1205 +-0.2504015294087981#1206 +-0.2455575982623998#1207 +-0.24070752790781397#1208 +-0.23585143960209737#1209 +-0.2309894547527621#1210 +-0.22612169491474035#1211 +-0.22124828178734524#1212 +-0.2163693372112284#1213 +-0.21148498316533365#1214 +-0.20659534176384747#1215 +-0.20170053525314605#1216 +-0.19680068600873887#1217 +-0.1918959165322094#1218 +-0.1869863494481521#1219 +-0.18207210750110703#1220 +-0.17715331355249084#1221 +-0.1722300905775252#1222 +-0.1673025616621623#1223 +-0.16237085000000756#1224 +-0.15743507888923958#1225 +-0.15249537172952762#1226 +-0.14755185201894652#1227 +-0.14260464335088902#1228 +-0.1376538694109758#1229 +-0.13269965397396327#1230 +-0.12774212090064904#1231 +-0.12278139413477519#1232 +-0.11781759769992965#1233 +-0.11285085569644543#1234 +-0.10788129229829795#1235 +-0.10290903175000057#1236 +-0.09793419836349838#1237 +-0.09295691651506024#1238 +-0.08797731064216921#1239 +-0.08299550524041148#1240 +-0.07801162486036392#1241 +-0.07302579410448008#1242 +-0.06803813762397506#1243 +-0.06304878011570905#1244 +-0.05805784631906981#1245 +-0.05306546101285402#1246 +-0.04807174901214768#1247 +-0.043076835165205635#1248 +-0.03808084435033015#1249 +-0.0330839014727489#1250 +-0.028086131461492157#1251 +-0.02308765926626943#1252 +-0.018088609854345607#1253 +-0.013089108207416617#1254 +-0.008089279318484762#1255 +-0.0030892481887337484#1256 +0.0019108601755964752#1257 +0.006910920766335011#1258 +0.011910808576505354#1259 +0.0169103986034507#1260 +0.02190956585195915#1261 +0.026908185337388736#1262 +0.03190613208879216#1263 +0.036903281152041195#1264 +0.04189950759295072#1265 +0.04689468650040215#1266 +0.0518886929894664#1267 +0.05688140220452612#1268 +0.06187268932239722#1269 +0.06686242955544962#1270 +0.071850498154727#1271 +0.07683677041306575#1272 +0.08182112166821275#1273 +0.08680342730594202#1274 +0.0917835627631703#1275 +0.09676140353107118#1276 +0.10173682515818798#1277 +0.10670970325354522#1278 +0.11167991348975845#1279 +0.11664733160614266#1280 +0.12161183341181883#1281 +0.12657329478881893#1282 +0.131531591695189#1283 +0.1364866001680902#1284 +0.14143819632689822#1285 +0.1463862563763003#1286 +0.15133065660939024#1287 +0.1562712734107613#1288 +0.16120798325959665#1289 +0.1661406627327575#1290 +0.17106918850786887#1291 +0.17599343736640286#1292 +0.180913286196759#1293 +0.18582861199734246#1294 +0.19073929187963906#1295 +0.19564520307128758#1296 +0.2005462229191494#1297 +0.2054422288923747#1298 +0.21033309858546614#1299 +0.21521870972133889#1300 +0.22009894015437786#1301 +0.22497366787349135#1302 +0.2298427710051616#1303 +0.23470612781649156#1304 +0.23956361671824858#1305 +0.24441511626790413#1306 +0.24926050517266995#1307 +0.2540996622925307#1308 +0.2589324666432724#1309 +0.2637587973995072#1310 +0.26857853389769426#1311 +0.27339155563915635#1312 +0.27819774229309246#1313 +0.28299697369958643#1314 +0.28778912987261057#1315 +0.292574091003026#1316 +0.2973517374615776#1317 +0.3021219498018853#1318 +0.3068846087634297#1319 +0.31163959527453455#1320 +0.3163867904553429#1321 +0.3211260756207897#1322 +0.32585733228356906#1323 +0.33058044215709614#1324 +0.335295287158465#1325 +0.34000174941140043#1326 +0.34469971124920495#1327 +0.34938905521770103#1328 +0.354069664078167#1329 +0.3587414208102686#1330 +0.36340420861498446#1331 +0.36805791091752604#1332 +0.37270241137025245#1333 +0.377337593855579#1334 +0.3819633424888804#1335 +0.38657954162138797#1336 +0.3911860758430809#1337 +0.39578282998557185#1338 +0.40036968912498605#1339 +0.4049465385848346#1340 +0.40951326393888154#1341 +0.41406975101400467#1342 +0.4186158858930499#1343 +0.4231515549176793#1344 +0.4276766446912129#1345 +0.43219104208146336#1346 +0.43669463422356475#1347 +0.44118730852279403#1348 +0.44566895265738626#1349 +0.4501394545813426#1350 +0.45459870252723167#1351 +0.4590465850089838#1352 +0.4634829908246785#1353 +0.4679078090593242#1354 +0.47232092908763174#1355 +0.47672224057677975#1356 +0.48111163348917335#1357 +0.48548899808519497#1358 +0.48985422492594827#1359 +0.49420720487599384#1360 +0.4985478291060781#1361 +0.5028759890958538#1362 +0.5071915766365935#1363 +0.5114944838338946#1364 +0.515784603110377#1365 +0.5200618272083724#1366 +0.5243260491926062#1367 +0.5285771624528709#1368 +0.5328150607066914#1369 +0.5370396380019821#1370 +0.5412507887196959#1371 +0.5454484075764651#1372 +0.5496323896272328#1373 +0.5538026302678776#1374 +0.5579590252378281#1375 +0.56210147062267#1376 +0.5662298628567437#1377 +0.5703440987257337#1378 +0.574444075369249#1379 +0.5785296902833954#1380 +0.5826008413233368#1381 +0.5866574267058503#1382 +0.5906993450118702#1383 +0.5947264951890237#1384 +0.5987387765541573#1385 +0.6027360887958543#1386 +0.606718331976942#1387 +0.6106854065369912#1388 +0.6146372132948044#1389 +0.6185736534508959#1390 +0.6224946285899621#1391 +0.6264000406833412#1392 +0.6302897920914652#1393 +0.6341637855662996#1394 +0.6380219242537761#1395 +0.6418641116962132#1396 +0.6456902518347277#1397 +0.6495002490116367#1398 +0.6532940079728492#1399 +0.6570714338702469#1400 +0.6608324322640562#1401 +0.6645769091252091#1402 +0.6683047708376937#1403 +0.6720159242008952#1404 +0.6757102764319257#1405 +0.6793877351679439#1406 +0.6830482084684645#1407 +0.6866916048176565#1408 +0.6903178331266312#1409 +0.6939268027357199#1410 +0.6975184234167404#1411 +0.7010926053752522#1412 +0.7046492592528021#1413 +0.7081882961291582#1414 +0.7117096275245328#1415 +0.7152131654017945#1416 +0.7186988221686693#1417 +0.7221665106799307#1418 +0.7256161442395778#1419 +0.7290476366030035#1420 +0.7324609019791505#1421 +0.7358558550326559#1422 +0.739232410885985#1423 +0.7425904851215531#1424 +0.7459299937838362#1425 +0.7492508533814698#1426 +0.7525529808893364#1427 +0.7558362937506415#1428 +0.759100709878977#1429 +0.7623461476603739#1430 +0.7655725259553424#1431 +0.768779764100901#1432 +0.7719677819125926#1433 +0.7751364996864897#1434 +0.7782858382011864#1435 +0.7814157187197798#1436 +0.784526062991838#1437 +0.7876167932553569#1438 +0.7906878322387035#1439 +0.7937391031625489#1440 +0.7967705297417869#1441 +0.7997820361874415#1442 +0.8027735472085621#1443 +0.8057449880141055#1444 +0.8086962843148058#1445 +0.8116273623250316#1446 +0.8145381487646309#1447 +0.8174285708607633#1448 +0.8202985563497188#1449 +0.8231480334787254#1450 +0.8259769310077424#1451 +0.8287851782112412#1452 +0.8315727048799744#1453 +0.8343394413227303#1454 +0.8370853183680755#1455 +0.8398102673660847#1456 +0.8425142201900562#1457 +0.8451971092382158#1458 +0.8478588674354067#1459 +0.8504994282347665#1460 +0.8531187256193907#1461 +0.8557166941039838#1462 +0.8582932687364956#1463 +0.8608483850997459#1464 +0.8633819793130346#1465 +0.8658939880337387#1466 +0.8683843484588964#1467 +0.8708529983267768#1468 +0.8732998759184363#1469 +0.8757249200592625#1470 +0.8781280701205031#1471 +0.8805092660207812#1472 +0.8828684482275984#1473 +0.8852055577588225#1474 +0.8875205361841624#1475 +0.8898133256266285#1476 +0.8920838687639805#1477 +0.8943321088301596#1478 +0.8965579896167084#1479 +0.8987614554741759#1480 +0.9009424513135085#1481 +0.903100922607428#1482 +0.9052368153917945#1483 +0.9073500762669549#1484 +0.909440652399079#1485 +0.9115084915214801#1486 +0.9135535419359212#1487 +0.9155757525139081#1488 +0.9175750726979675#1489 +0.9195514525029107#1490 +0.9215048425170839#1491 +0.9234351939036028#1492 +0.9253424584015744#1493 +0.9272265883273026#1494 +0.9290875365754814#1495 +0.9309252566203716#1496 +0.9327397025169648#1497 +0.9345308289021316#1498 +0.9362985909957559#1499 +0.9380429446018542#1500 +0.9397638461096811#1501 +0.941461252494819#1502 +0.9431351213202543#1503 +0.9447854107374378#1504 +0.9464120794873314#1505 +0.9480150869014395#1506 +0.9495943929028258#1507 +0.9511499580071151#1508 +0.9526817433234805#1509 +0.954189710555616#1510 +0.9556738220026935#1511 +0.9571340405603057#1512 +0.9585703297213937#1513 +0.9599826535771594#1514 +0.9613709768179639#1515 +0.9627352647342095#1516 +0.9640754832172079#1517 +0.9653915987600334#1518 +0.9666835784583596#1519 +0.9679513900112827#1520 +0.9691950017221292#1521 +0.9704143824992478#1522 +0.971609501856787#1523 +0.9727803299154575#1524 +0.9739268374032789#1525 +0.9750489956563115#1526 +0.9761467766193734#1527 +0.9772201528467414#1528 +0.9782690975028371#1529 +0.9792935843628984#1530 +0.9802935878136347#1531 +0.9812690828538676#1532 +0.9822200450951553#1533 +0.9831464507624029#1534 +0.984048276694457#1535 +0.9849255003446842#1536 +0.985778099781535#1537 +0.986606053689092#1538 +0.9874093413676033#1539 +0.9881879427339993#1540 +0.9889418383223956#1541 +0.9896710092845786#1542 +0.9903754373904782#1543 +0.9910551050286219#1544 +0.9917099952065767#1545 +0.9923400915513724#1546 +0.9929453783099123#1547 +0.9935258403493662#1548 +0.9940814631575491#1549 +0.9946122328432839#1550 +0.9951181361367487#1551 +0.9955991603898084#1552 +0.9960552935763314#1553 +0.9964865242924896#1554 +0.9968928417570443#1555 +0.9972742358116148#1556 +0.9976306969209333#1557 +0.9979622161730826#1558 +0.9982687852797193#1559 +0.9985503965762809#1560 +0.9988070430221773#1561 +0.999038718200967#1562 +0.9992454163205174#1563 +0.99942713221315#1564 +0.9995838613357688#1565 +0.9997155997699745#1566 +0.9998223442221624#1567 +0.9999040920236046#1568 +0.9999608411305168#1569 +0.9999925901241092#1570 +0.9999993382106224#1571 +0.9999810852213469#1572 +0.9999378316126273#1573 +0.999869578465851#1574 +0.9997763274874213#1575 +0.9996580810087146#1576 +0.9995148419860219#1577 +0.9993466140004753#1578 +0.9991534012579582#1579 +0.9989352085890002#1580 +0.9986920414486563#1581 +0.9984239059163708#1582 +0.9981308086958247#1583 +0.9978127571147688#1584 +0.99746975912484#1585 +0.9971018233013628#1586 +0.9967089588431346#1587 +0.9962911755721959#1588 +0.9958484839335852#1589 +0.9953808949950765#1590 +0.9948884204469045#1591 +0.9943710726014706#1592 +0.9938288643930362#1593 +0.9932618093773986#1594 +0.9926699217315527#1595 +0.9920532162533362#1596 +0.9914117083610597#1597 +0.9907454140931213#1598 +0.9900543501076055#1599 +0.9893385336818665#1600 +0.9885979827120973#1601 +0.9878327157128809#1602 +0.9870427518167282#1603 +0.9862281107735995#1604 +0.9853888129504108#1605 +0.9845248793305243#1606 +0.9836363315132244#1607 +0.982723191713177#1608 +0.9817854827598747#1609 +0.9808232280970655#1610 +0.979836451782167#1611 +0.9788251784856651#1612 +0.9777894334904969#1613 +0.9767292426914185#1614 +0.9756446325943581#1615 +0.9745356303157527#1616 +0.973402263581871#1617 +0.9722445607281189#1618 +0.9710625506983328#1619 +0.9698562630440544#1620 +0.9686257279237925#1621 +0.9673709761022696#1622 +0.9660920389496518#1623 +0.9647889484407648#1624 +0.9634617371542948#1625 +0.9621104382719737#1626 +0.9607350855777497#1627 +0.9593357134569425#1628 +0.9579123568953835#1629 +0.9564650514785418#1630 +0.9549938333906335#1631 +0.9534987394137181#1632 +0.951979806926778#1633 +0.9504370739047846#1634 +0.9488705789177487#1635 +0.947280361129756#1636 +0.9456664602979884#1637 +0.9440289167717294#1638 +0.9423677714913561#1639 +0.9406830659873149#1640 +0.9389748423790838#1641 +0.9372431433741187#1642 +0.9354880122667867#1643 +0.9337094929372823#1644 +0.9319076298505318#1645 +0.9300824680550803#1646 +0.9282340531819666#1647 +0.9263624314435814#1648 +0.9244676496325129#1649 +0.9225497551203758#1650 +0.9206087958566281#1651 +0.9186448203673715#1652 +0.9166578777541385#1653 +0.914648017692665#1654 +0.9126152904316478#1655 +0.9105597467914889#1656 +0.9084814381630245#1657 +0.9063804165062408#1658 +0.9042567343489741#1659 +0.9021104447855981#1660 +0.8999416014756964#1661 +0.8977502586427206#1662 +0.8955364710726356#1663 +0.8933002941125486#1664 +0.8910417836693263#1665 +0.8887609962081968#1666 +0.8864579887513381#1667 +0.8841328188764522#1668 +0.8817855447153259#1669 +0.8794162249523771#1670 +0.8770249188231881#1671 +0.8746116861130243#1672 +0.8721765871553393#1673 +0.869719682830267#1674 +0.8672410345630995#1675 +0.8647407043227509#1676 +0.8622187546202082#1677 +0.8596752485069692#1678 +0.8571102495734646#1679 +0.8545238219474699#1680 +0.8519160302925008#1681 +0.8492869398061975#1682 +0.8466366162186939#1683 +0.8439651257909746#1684 +0.8412725353132186#1685 +0.8385589121031288#1686 +0.83582432400425#1687 +0.8330688393842716#1688 +0.8302925271333189#1689 +0.827495456662231#1690 +0.8246776979008249#1691 +0.8218393212961476#1692 +0.8189803978107147#1693 +0.8161009989207362#1694 +0.8132011966143297#1695 +0.8102810633897203#1696 +0.8073406722534284#1697 +0.8043800967184445#1698 +0.8013994108023905#1699 +0.7983986890256706#1700 +0.7953780064096068#1701 +0.7923374384745641#1702 +0.7892770612380622#1703 +0.786196951212875#1704 +0.7830971854051179#1705 +0.7799778413123215#1706 +0.776838996921496#1707 +0.7736807307071796#1708 +0.7705031216294775#1709 +0.7673062491320879#1710 +0.764090193140315#1711 +0.7608550340590718#1712 +0.7576008527708692#1713 +0.7543277306337939#1714 +0.7510357494794747#1715 +0.7477249916110366#1716 +0.7443955398010426#1717 +0.7410474772894247#1718 +0.7376808877814032#1719 +0.734295855445393#1720 +0.7308924649109002#1721 +0.7274708012664058#1722 +0.7240309500572385#1723 +0.720572997283436#1724 +0.7170970293975949#1725 +0.7136031333027092#1726 +0.7100913963499977#1727 +0.7065619063367206#1728 +0.7030147515039831#1729 +0.699450020534531#1730 +0.6958678025505323#1731 +0.6922681871113496#1732 +0.6886512642113011#1733 +0.6850171242774098#1734 +0.6813658581671439#1735 +0.6776975571661447#1736 +0.674012312985944#1737 +0.670310217761672#1738 +0.6665913640497532#1739 +0.6628558448255925#1740 +0.659103753481251#1741 +0.6553351838231111#1742 +0.6515502300695304#1743 +0.6477489868484874#1744 +0.6439315491952148#1745 +0.6400980125498239#1746 +0.6362484727549182#1747 +0.6323830260531977#1748 +0.6285017690850523#1749 +0.6246047988861457#1750 +0.6206922128849899#1751 +0.6167641089005085#1752 +0.612820585139592#1753 +0.6088617401946422#1754 +0.604887673041107#1755 +0.6008984830350063#1756 +0.5968942699104477#1757 +0.5928751337771334#1758 +0.5888411751178568#1759 +0.5847924947859908#1760 +0.5807291940029664#1761 +0.5766513743557417#1762 +0.5725591377942618#1763 +0.5684525866289113#1764 +0.5643318235279547#1765 +0.5601969515149712#1766 +0.5560480739662773#1767 +0.5518852946083439#1768 +0.5477087175152022#1769 +0.5435184471058416#1770 +0.5393145881415996#1771 +0.5350972457235423#1772 +0.5308665252898368#1773 +0.5266225326131154#1774 +0.5223653737978309#1775 +0.5180951552776039#1776 +0.5138119838125619#1777 +0.5095159664866701#1778 +0.5052072107050544#1779 +0.500885824191316#1780 +0.4965519149848381#1781 +0.4922055914380849#1782 +0.48784696221389273#1783 +0.4834761362827533#1784 +0.47909322292008927#1785 +0.4746983317035223#1786 +0.47029157251013354#1787 +0.4658730555137165#1788 +0.4614428911820225#1789 +0.457001190273999#1790 +0.45254806383702073#1791 +0.4480836232041127#1792 +0.4436079799911676#1793 +0.4391212460941545#1794 +0.43462353368632184#1795 +0.4301149552153929#1796 +0.4255956234007543#1797 +0.421065651230638#1798 +0.4165251519592965#1799 +0.41197423910417136#1800 +0.40741302644305505#1801 +0.4028416280112465#1802 +0.39826015809869997#1803 +0.3936687312471678#1804 +0.38906746224733657#1805 +0.38445646613595746#1806 +0.37983585819297#1807 +0.37520575393862005#1808 +0.3705662691305715#1809 +0.3659175197610125#1810 +0.3612596220537552#1811 +0.3565926924613304#1812 +0.3519168476620756#1813 +0.3472322045572184#1814 +0.34253888026795376#1815 +0.3378369921325154#1816 +0.33312665770324285#1817 +0.3284079947436421#1818 +0.3236811212254414#1819 +0.31894615532564213#1820 +0.31420321542356394#1821 +0.3094524200978852#1822 +0.3046938881236786#1823 +0.29992773846944126#1824 +0.29515409029412093#1825 +0.29037306294413634#1826 +0.28558477595039367#1827 +0.28078934902529823#1828 +0.27598690205976134#1829 +0.27117755512020303#1830 +0.26636142844555016#1831 +0.2615386424442305#1832 +0.25670931769116206#1833 +0.25187357492473905#1834 +0.24703153504381276#1835 +0.24218331910466936#1836 +0.23732904831800322#1837 +0.2324688440458865#1838 +0.22760282779873497#1839 +0.2227311212322701#1840 +0.21785384614447761#1841 +0.21297112447256228#1842 +0.2080830782898995#1843 +0.2031898298029832#1844 +0.19829150134837065#1845 +0.19338821538962375#1846 +0.18848009451424758#1847 +0.1835672614306253#1848 +0.17864983896495043#1849 +0.1737279500581561#1850 +0.16880171776284136#1851 +0.16387126524019463#1852 +0.15893671575691473#1853 +0.1539981926821289#1854 +0.1490558194843085#1855 +0.1441097197281822#1856 +0.13916001707164674#1857 +0.13420683526267524#1858 +0.12925029813622346#1859 +0.12429052961113374#1860 +0.11932765368703695#1861 +0.1143617944412523#1862 +0.10939307602568533#1863 +0.1044216226637239#1864 +0.09944755864713259#1865 +0.09447100833294511#1866 +0.0894920961403554#1867 +0.0845109465476069#1868 +0.0795276840888805#1869 +0.07454243335118108#1870 +0.06955531897122263#1871 +0.06456646563231223#1872 +0.059575998061232885#1873 +0.054584041025125096#1874 +0.049590719328367665#1875 +0.04459615780945739#1876 +0.03960048133788796#1877 +0.03460381481102812#1878 +0.029606283150999082#1879 +0.02460801130155131#1880 +0.01960912422494083#1881 +0.014609746898805002#1882 +0.009610004313037981#1883 +0.004610021466665799#1884 +-3.900766352787359E-4#1885 +-0.005390164984881294#1886 +-0.010390118574471368#1887 +-0.015389812399747599#1888 +-0.020389121462903018#1889 +-0.02538792077575013#1890 +-0.03038608536284575#1891 +-0.03538349026461554#1892 +-0.04038001054047812#1893 +-0.04537552127196872#1894 +-0.050369897565862284#1895 +-0.05536301455729594#1896 +-0.06035474741289075#1897 +-0.06534497133387268#1898 +-0.07033356155919271#1899 +-0.07532039336864602#1900 +-0.08030534208599005#1901 +-0.08528828308206167#1902 +-0.09026909177789293#1903 +-0.09524764364782572#1904 +-0.10022381422262505#1905 +-0.10519747909259092#1906 +-0.11016851391066866#1907 +-0.11513679439555781#1908 +-0.1201021963348192#1909 +-0.1250645955879805#1910 +-0.13002386808963973#1911 +-0.13497988985256723#1912 +-0.13993253697080524#1913 +-0.14488168562276588#1914 +-0.14982721207432675#1915 +-0.15476899268192437#1916 +-0.15970690389564546#1917 +-0.16464082226231586#1918 +-0.16957062442858686#1919 +-0.17449618714401938#1920 +-0.17941738726416515#1921 +-0.18433410175364556#1922 +-0.18924620768922767#1923 +-0.19415358226289745#1924 +-0.19905610278493005#1925 +-0.20395364668695723#1926 +-0.2088460915250317#1927 +-0.21373331498268833#1928 +-0.21861519487400213#1929 +-0.22349160914664326#1930 +-0.2283624358849282#1931 +-0.23322755331286787#1932 +-0.23808683979721232#1933 +-0.24294017385049144#1934 +-0.2477874341340524#1935 +-0.25262849946109334#1936 +-0.257463248799693#1937 +-0.26229156127583675#1938 +-0.2671133161764385#1939 +-0.2719283929523589#1940 +-0.27673667122141876#1941 +-0.2815380307714092#1942 +-0.28633235156309667#1943 +-0.2911195137332245#1944 +-0.2958993975975091#1945 +-0.3006718836536328#1946 +-0.305436852584231#1947 +-0.3101941852598754#1948 +-0.3149437627420526#1949 +-0.31968546628613737#1950 +-0.32441917734436165#1951 +-0.32914477756877814#1952 +-0.33386214881421933#1953 +-0.3385711731412511#1954 +-0.3432717328191215#1955 +-0.3479637103287039#1956 +-0.35264698836543545#1957 +-0.35732144984224945#1958 +-0.361986977892503#1959 +-0.3666434558728984#1960 +-0.3712907673663999#1961 +-0.3759287961851435#1962 +-0.3805574263733427#1963 +-0.3851765422101866#1964 +-0.3897860282127338#1965 +-0.39438576913879897#1966 +-0.39897564998983465#1967 +-0.4035555560138058#1968 +-0.4081253727080591#1969 +-0.4126849858221854#1970 +-0.41723428136087615#1971 +-0.42177314558677365#1972 +-0.42630146502331423#1973 +-0.43081912645756554#1974 +-0.43532601694305695#1975 +-0.43982202380260327#1976 +-0.44430703463112187#1977 +-0.44878093729844293#1978 +-0.4532436199521127#1979 +-0.45769497102019024#1980 +-0.46213487921403634#1981 +-0.46656323353109636#1982 +-0.4709799232576751#1983 +-0.475384837971705#1984 +-0.4797778675455064#1985 +-0.4841589021485414#1986 +-0.48852783225015933#1987 +-0.4928845486223354#1988 +-0.49722894234240117#1989 +-0.5015609047957682#1990 +-0.5058803276786432#1991 +-0.5101871030007359#1992 +-0.5144811230879588#1993 +-0.5187622805851191#1994 +-0.5230304684586029#1995 +-0.5272855799990512#1996 +-0.5315275088240276#1997 +-0.5357561488806775#1998 +-0.5399713944483807#1999 +-0.5441731401413934#2000 +-0.5483612809114837#2001 +-0.5525357120505574#2002 +-0.5566963291932762#2003 +-0.5608430283196667#2004 +-0.5649757057577212#2005 +-0.5690942581859894#2006 +-0.5731985826361617#2007 +-0.5772885764956439#2008 +-0.5813641375101216#2009 +-0.5854251637861175#2010 +-0.5894715537935389#2011 +-0.5935032063682155#2012 +-0.597520020714429#2013 +-0.6015218964074331#2014 +-0.6055087333959641#2015 +-0.6094804320047422#2016 +-0.6134368929369639#2017 +-0.6173780172767841#2018 +-0.6213037064917892#2019 +-0.6252138624354607#2020 +-0.6291083873496288#2021 +-0.6329871838669167#2022 +-0.6368501550131742#2023 +-0.6406972042099032#2024 +-0.6445282352766715#2025 +-0.6483431524335176#2026 +-0.6521418603033454#2027 +-0.6559242639143089#2028 +-0.659690268702186#2029 +-0.6634397805127431#2030 +-0.6671727056040896#2031 +-0.6708889506490203#2032 +-0.6745884227373499#2033 +-0.678271029378235#2034 +-0.681936678502487#2035 +-0.6855852784648737#2036 +-0.6892167380464105#2037 +-0.6928309664566411#2038 +-0.6964278733359074#2039 +-0.7000073687576082#2040 +-0.703569363230448#2041 +-0.7071137677006744#2042 +-0.7106404935543035#2043 +-0.7141494526193368#2044 +-0.7176405571679648#2045 +-0.7211137199187603#2046 +-0.7245688540388606#2047 +-0.7280058731461386#2048 +-0.7314246913113622#2049 +-0.7348252230603428#2050 +-0.7382073833760722#2051 +-0.741571087700848#2052 +-0.7449162519383877#2053 +-0.7482427924559315#2054 +-0.7515506260863327#2055 +-0.7548396701301374#2056 +-0.7581098423576514#2057 +-0.7613610610109973#2058 +-0.7645932448061572#2059 +-0.7678063129350055#2060 +-0.7710001850673294#2061 +-0.7741747813528366#2062 +-0.7773300224231525#2063 +-0.7804658293938036#2064 +-0.7835821238661903#2065 +-0.7866788279295468#2066 +-0.7897558641628889#2067 +-0.7928131556369494#2068 +-0.7958506259161022#2069 +-0.7988681990602722#2070 +-0.8018657996268346#2071 +-0.804843352672501#2072 +-0.8078007837551925#2073 +-0.8107380189359017#2074 +-0.8136549847805407#2075 +-0.816551608361777#2076 +-0.8194278172608569#2077 +-0.8222835395694162#2078 +-0.825118703891278#2079 +-0.827933239344237#2080 +-0.8307270755618326#2081 +-0.8335001426951075#2082 +-0.8362523714143544#2083 +-0.8389836929108488#2084 +-0.8416940388985699#2085 +-0.8443833416159072#2086 +-0.8470515338273554#2087 +-0.8496985488251945#2088 +-0.8523243204311582#2089 +-0.854928782998088#2090 +-0.857511871411575#2091 +-0.8600735210915872#2092 +-0.8626136679940842#2093 +-0.8651322486126191#2094 +-0.867629199979925#2095 +-0.8701044596694903#2096 +-0.8725579657971192#2097 +-0.874989657022478#2098 +-0.8773994725506302#2099 +-0.8797873521335552#2100 +-0.8821532360716551#2101 +-0.8844970652152468#2102 +-0.8868187809660419#2103 +-0.8891183252786103#2104 +-0.8913956406618324#2105 +-0.893650670180336#2106 +-0.8958833574559198#2107 +-0.8980936466689633#2108 +-0.9002814825598215#2109 +-0.9024468104302075#2110 +-0.9045895761445593#2111 +-0.9067097261313932#2112 +-0.9088072073846438#2113 +-0.9108819674649886#2114 +-0.9129339545011592#2115 +-0.9149631171912382#2116 +-0.9169694048039421#2117 +-0.9189527671798887#2118 +-0.9209131547328523#2119 +-0.9228505184510025#2120 +-0.9247648098981304#2121 +-0.9266559812148585#2122 +-0.9285239851198382#2123 +-0.9303687749109315#2124 +-0.9321903044663783#2125 +-0.93398852824595#2126 +-0.935763401292088#2127 +-0.9375148792310273#2128 +-0.9392429182739063#2129 +-0.9409474752178612#2130 +-0.9426285074471065#2131 +-0.9442859729340003#2132 +-0.9459198302400948#2133 +-0.9475300385171728#2134 +-0.9491165575082684#2135 +-0.9506793475486737#2136 +-0.9522183695669307#2137 +-0.953733585085808#2138 +-0.9552249562232621#2139 +-0.9566924456933859#2140 +-0.9581360168073393#2141 +-0.9595556334742679#2142 +-0.9609512602022041#2143 +-0.9623228620989553#2144 +-0.9636704048729758#2145 +-0.9649938548342245#2146 +-0.9662931788950064#2147 +-0.9675683445708009#2148 +-0.968819319981073#2149 +-0.9700460738500711#2150 +-0.9712485755076085#2151 +-0.9724267948898301#2152 +-0.9735807025399644#2153 +-0.9747102696090597#2154 +-0.9758154678567055#2155 +-0.976896269651738#2156 +-0.9779526479729322#2157 +-0.9789845764096758#2158 +-0.979992029162631#2159 +-0.9809749810443782#2160 +-0.9819334074800466#2161 +-0.9828672845079288#2162 +-0.9837765887800786#2163 +-0.9846612975628961#2164 +-0.9855213887376952#2165 +-0.9863568408012572#2166 +-0.9871676328663679#2167 +-0.9879537446623399#2168 +-0.9887151565355197#2169 +-0.9894518494497786#2170 +-0.9901638049869892#2171 +-0.9908510053474854#2172 +-0.9915134333505073#2173 +-0.9921510724346315#2174 +-0.9927639066581843#2175 +-0.9933519206996405#2176 +-0.9939150998580071#2177 +-0.9944534300531896#2178 +-0.9949668978263454#2179 +-0.9954554903402192#2180 +-0.9959191953794643#2181 +-0.9963580013509482#2182 +-0.9967718972840426#2183 +-0.9971608728308967#2184 +-0.9975249182666971#2185 +-0.9978640244899103#2186 +-0.9981781830225102#2187 +-0.9984673860101904#2188 +-0.9987316262225601#2189 +-0.9989708970533256#2190 +-0.9991851925204547#2191 +-0.9993745072663266#2192 +-0.9995388365578659#2193 +-0.9996781762866607#2194 +-0.9997925229690657#2195 +-0.9998818737462889#2196 +-0.9999462263844632#2197 +-0.9999855792747024#2198 +-0.9999999314331414#2199 +-0.9999892825009603#2200 +-0.9999536327443943#2201 +-0.999892983054726#2202 +-0.999807334948264#2203 +-0.9996966905663046#2204 +-0.9995610526750781#2205 +-0.99940042466568#2206 +-0.999214810553986#2207 +-0.9990042149805516#2208 +-0.9987686432104962#2209 +-0.9985081011333714#2210 +-0.9982225952630136#2211 +-0.9979121327373817#2212 +-0.9975767213183776#2213 +-0.9972163693916535#2214 +-0.996831085966401#2215 +-0.9964208806751266#2216 +-0.9959857637734107#2217 +-0.9955257461396512#2218 +-0.9950408392747914#2219 +-0.9945310553020325#2220 +-0.9939964069665307#2221 +-0.9934369076350784#2222 +-0.9928525712957703#2223 +-0.9922434125576528#2224 +-0.99160944665036#2225 +-0.990950689423732#2226 +-0.9902671573474191#2227 +-0.9895588675104697#2228 +-0.9888258376209037#2229 +-0.9880680860052687#2230 +-0.9872856316081831#2231 +-0.9864784939918614#2232 +-0.9856466933356257#2233 +-0.9847902504354009#2234 +-0.9839091867031953#2235 +-0.9830035241665643#2236 +-0.9820732854680608#2237 +-0.9811184938646683#2238 +-0.98013917322722#2239 +-0.9791353480398014#2240 +-0.9781070433991387#2241 +-0.9770542850139713#2242 +-0.9759770992044087#2243 +-0.9748755129012727#2244 +-0.9737495536454245#2245 +-0.9725992495870751#2246 +-0.9714246294850826#2247 +-0.9702257227062325#2248 +-0.9690025592245042#2249 +-0.9677551696203205#2250 +-0.9664835850797842#2251 +-0.9651878373938978#2252 +-0.9638679589577689#2253 +-0.9625239827698001#2254 +-0.9611559424308641#2255 +-0.9597638721434639#2256 +-0.9583478067108772#2257 +-0.9569077815362865#2258 +-0.9554438326218945#2259 +-0.9539559965680228#2260 +-0.9524443105721981#2261 +-0.9509088124282217#2262 +-0.9493495405252242#2263 +-0.9477665338467067#2264 +-0.9461598319695652#2265 +-0.9445294750631017#2266 +-0.9428755038880198#2267 +-0.9411979597954054#2268 +-0.9394968847256935#2269 +-0.9377723212076188#2270 +-0.9360243123571531#2271 +-0.9342529018764272#2272 +-0.9324581340526379#2273 +-0.9306400537569413#2274 +-0.9287987064433308#2275 +-0.9269341381475007#2276 +-0.925046395485695#2277 +-0.9231355256535423#2278 +-0.9212015764248758#2279 +-0.9192445961505387#2280 +-0.9172646337571754#2281 +-0.9152617387460086#2282 +-0.9132359611916016#2283 +-0.9111873517406057#2284 +-0.9091159616104953#2285 +-0.9070218425882862#2286 +-0.9049050470292413#2287 +-0.902765627855562#2288 +-0.9006036385550645#2289 +-0.8984191331798429#2290 +-0.896212166344918#2291 +-0.8939827932268711#2292 +-0.8917310695624655#2293 +-0.8894570516472526#2294 +-0.8871607963341641#2295 +-0.8848423610320912#2296 +-0.8825018037044489#2297 +-0.880139182867727#2298 +-0.8777545575900273#2299 +-0.8753479874895865#2300 +-0.8729195327332859#2301 +-0.8704692540351471#2302 +-0.8679972126548141#2303 +-0.8655034703960216#2304 +-0.8629880896050502#2305 +-0.8604511331691672#2306 +-0.8578926645150549#2307 +-0.8553127476072241#2308 +-0.8527114469464158#2309 +-0.8500888275679879#2310 +-0.8474449550402896#2311 +-0.8447798954630222#2312 +-0.8420937154655863#2313 +-0.839386482205416#2314 +-0.8366582633663#2315 +-0.8339091271566893#2316 +-0.8311391423079922#2317 +-0.8283483780728558#2318 +-0.8255369042234343#2319 +-0.8227047910496449#2320 +-0.8198521093574107#2321 +-0.8169789304668901#2322 +-0.8140853262106937#2323 +-0.8111713689320887#2324 +-0.8082371314831904#2325 +-0.8052826872231398#2326 +-0.8023081100162708#2327 +-0.7993134742302628#2328 +-0.7962988547342815#2329 +-0.7932643268971075#2330 +-0.7902099665852512#2331 +-0.787135850161057#2332 +-0.7840420544807932#2333 +-0.7809286568927315#2334 +-0.7777957352352124#2335 +-0.7746433678346996#2336 +-0.7714716335038213#2337 +-0.7682806115394006#2338 +-0.7650703817204723#2339 +-0.7618410243062883#2340 +-0.7585926200343117#2341 +-0.7553252501181975#2342 +-0.7520389962457629#2343 +-0.7487339405769441#2344 +-0.7454101657417431#2345 +-0.7420677548381616#2346 +-0.7387067914301232#2347 +-0.7353273595453843#2348 +-0.7319295436734334#2349 +-0.7285134287633792#2350 +-0.7250791002218256#2351 +-0.7216266439107379#2352 +-0.7181561461452949#2353 +-0.7146676936917317#2354 +-0.7111613737651702#2355 +-0.7076372740274387#2356 +-0.7040954825848801#2357 +-0.7005360879861493#2358 +-0.6969591792199993#2359 +-0.6933648457130565#2360 +-0.6897531773275846#2361 +-0.6861242643592386#2362 +-0.6824781975348065#2363 +-0.678815068009942#2364 +-0.675134967366884#2365 +-0.671437987612169#2366 +-0.6677242211743291#2367 +-0.6639937609015816#2368 +-0.6602467000595086#2369 +-0.6564831323287239#2370 +-0.6527031518025321#2371 +-0.6489068529845753#2372 +-0.6450943307864706#2373 +-0.6412656805254378#2374 +-0.6374209979219152#2375 +-0.633560379097168#2376 +-0.6296839205708835#2377 +-0.6257917192587595#2378 +-0.6218838724700804#2379 +-0.6179604779052844#2380 +-0.6140216336535215#2381 +-0.6100674381902004#2382 +-0.6060979903745269#2383 +-0.6021133894470326#2384 +-0.598113735027093#2385 +-0.5940991271104377#2386 +-0.5900696660666497#2387 +-0.5860254526366568#2388 +-0.5819665879302124#2389 +-0.5778931734233677#2390 +-0.5738053109559348#2391 +-0.569703102728941#2392 +-0.5655866513020726#2393 +-0.5614560595911121#2394 +-0.5573114308653642#2395 +-0.5531528687450743#2396 +-0.5489804771988379#2397 +-0.5447943605410014#2398 +-0.5405946234290538#2399 +-0.5363813708610107#2400 +-0.5321547081727881#2401 +-0.5279147410355705#2402 +-0.5236615754531676#2403 +-0.519395317759365#2404 +-0.5151160746152651#2405 +-0.5108239530066209#2406 +-0.506519060241161#2407 +-0.502201503945907#2408 +-0.4978713920644825#2409 +-0.4935288328544144#2410 +-0.48917393488442656#2411 +-0.48480680703172513#2412 +-0.4804275584792769#2413 +-0.4760362987130791#2414 +-0.4716331375194228#2415 +-0.46721818498214757#2416 +-0.4627915514798893#2417 +-0.45835334768332103#2418 +-0.4539036845523856#2419 +-0.44944267333352184#2420 +-0.44497042555688315#2421 +-0.44048705303354907#2422 +-0.4359926678527301#2423 +-0.4314873823789651#2424 +-0.4269713092493122#2425 +-0.4224445613705327#2426 +-0.41790725191626826#2427 +-0.41335949432421154#2428 +-0.40880140229327#2429 +-0.40423308978072336#2430 +-0.3996546709993746#2431 +-0.39506626041469434#2432 +-0.3904679727419593#2433 +-0.3858599229433842#2434 +-0.38124222622524756#2435 +-0.37661499803501136#2436 +-0.37197835405843477#2437 +-0.3673324102166821#2438 +-0.3626772826634242#2439 +-0.35801308778193497#2440 +-0.3533399421821812#2441 +-0.34865796269790755#2442 +-0.34396726638371544#2443 +-0.3392679705121366#2444 +-0.33456019257070085#2445 +-0.3298440502589993#2446 +-0.32511966148574134#2447 +-0.32038714436580695#2448 +-0.31564661721729353#2449 +-0.31089819855855805#2450 +-0.3061420071052539#2451 +-0.30137816176736276#2452 +-0.29660678164622173#2453 +-0.2918279860315458#2454 +-0.28704189439844535#2455 +-0.2822486264044393#2456 +-0.2774483018864633#2457 +-0.2726410408578739#2458 +-0.2678269635054479#2459 +-0.26300619018637766#2460 +-0.2581788414252621#2461 +-0.25334503791109336#2462 +-0.2485049004942394#2463 +-0.24365855018342264#2464 +-0.23880610814269476#2465 +-0.2339476956884072#2466 +-0.22908343428617836#2467 +-0.22421344554785672#2468 +-0.21933785122848035#2469 +-0.214456773223233#2470 +-0.20957033356439664#2471 +-0.2046786544183003#2472 +-0.199781858082266#2473 +-0.19488006698155108#2474 +-0.18997340366628748#2475 +-0.18506199080841776#2476 +-0.18014595119862828#2477 +-0.17522540774327927#2478 +-0.17030048346133195#2479 +-0.16537130148127305#2480 +-0.16043798503803638#2481 +-0.15550065746992187#2482 +-0.15055944221551193#2483 +-0.14561446281058535#2484 +-0.14066584288502887#2485 +-0.13571370615974612#2486 +-0.1307581764435647#2487 +-0.1257993776301405#2488 +-0.12083743369486062#2489 +-0.1158724686917435#2490 +-0.11090460675033763#2491 +-0.1059339720726181#2492 +-0.10096068892988144#2493 +-0.09598488165963873#2494 +-0.09100667466250695#2495 +-0.08602619239909891#2496 +-0.08104355938691153#2497 +-0.07605890019721283#2498 +-0.07107233945192747#2499 +-0.06608400182052104#2500 +-0.061094012016883296#2501 +-0.056102494796210045#2502 +-0.05110957495188422#2503 +-0.046115377312355856#2504 +-0.04112002673802128#2505 +-0.03612364811810144#2506 +-0.031126366367519556#2507 +-0.026128306423778083#2508 +-0.021129593243835173#2509 +-0.016130351800980592#2510 +-0.011130707081711249#2511 +-0.006130784082606411#2512 +-0.001130707807202643#2513 +0.0038693967371314156#2514 +0.008869404542320372#2515 +0.013869190602707415#2516 +0.0188686299181796#2517 +0.023867597497292982#2518 +0.028865968360397534#2519 +0.03386361754276179#2520 +0.03886042009769709#2521 +0.04385625109968139#2522 +0.048850985647482505#2523 +0.053844498867280835#2524 +0.05883666591579129#2525 +0.06382736198338455#2526 +0.0688164622972074#2527 +0.07380384212430227#2528 +0.07878937677472556#2529 +0.08377294160466514#2530 +0.08875441201955656#2531 +0.093733663477198#2532 +0.09871057149086404#2533 +0.10368501163241786#2534 +0.10865685953542219#2535 +0.11362599089824853#2536 +0.11859228148718484#2537 +0.12355560713954157#2538 +0.12851584376675582#2539 +0.1334728673574936#2540 +0.1384265539807505#2541 +0.1433767797889498#2542 +0.14832342102103904#2543 +0.15326635400558397#2544 +0.1582054551638607#2545 +0.1631406010129451#2546 +0.16807166816880012#2547 +0.17299853334936047#2548 +0.17792107337761487#2549 +0.18283916518468557#2550 +0.18775268581290516#2551 +0.19266151241889076#2552 +0.1975655222766151#2553 +0.20246459278047496#2554 +0.2073586014483563#2555 +0.21224742592469656#2556 +0.21713094398354355#2557 +0.2220090335316114#2558 +0.2268815726113329#2559 +0.2317484394039086#2560 +0.23660951223235246#2561 +0.24146466956453383#2562 +0.24631379001621598#2563 +0.25115675235409074#2564 +0.25599343549880954#2565 +0.26082371852801045#2566 +0.2656474806793415#2567 +0.27046460135347977#2568 +0.27527496011714647#2569 +0.28007843670611793#2570 +0.2848749110282325#2571 +0.28966426316639277#2572 +0.29444637338156365#2573 +0.2992211221157662#2574 +0.30398838999506633#2575 +0.3087480578325597#2576 +0.31350000663135114#2577 +0.3182441175875301#2578 +0.32298027209314034#2579 +0.32770835173914586#2580 +0.3324282383183909#2581 +0.33713981382855523#2582 +0.3418429604751045#2583 +0.3465375606742351#2584 +0.351223497055814#2585 +0.3559006524663131#2586 +0.36056890997173807#2587 +0.365228152860552#2588 +0.3698782646465932#2589 +0.3745191290719875#2590 +0.37915063011005495#2591 +0.3837726519682105#2592 +0.3883850790908588#2593 +0.3929877961622835#2594 +0.3975806881095302#2595 +0.40216364010528316#2596 +0.40673653757073636#2597 +0.411299266178458#2598 +0.415851711855249#2599 +0.4203937607849945#2600 +0.4249252994115099#2601 +0.4294462144413796#2602 +0.43395639284678944#2603 +0.4384557218683527#2604 +0.4429440890179291#2605 +0.447421382081437#2606 +0.4518874891216592#2607 +0.45634229848104124#2608 +0.4607856987844829#2609 +0.46521757894212296#2610 +0.4696378281521164#2611 +0.47404633590340456#2612 +0.4784429919784781#2613 +0.48282768645613255#2614 +0.4872003097142164#2615 +0.4915607524323718#2616 +0.49590890559476775#2617 +0.5002446604928256#2618 +0.5045679087279368#2619 +0.5088785422141728#2620 +0.5131764531809883#2621 +0.5174615341759139#2622 +0.5217336780672441#2623 +0.5259927780467153#2624 +0.5302387276321753#2625 +0.5344714206702466#2626 +0.5386907513389796#2627 +0.542896614150499#2628 +0.5470889039536398#2629 +0.5512675159365781#2630 +0.5554323456294494#2631 +0.5595832889069624#2632 +0.5637202419910007#2633 +0.5678431014532183#2634 +0.5719517642176251#2635 +0.576046127563164#2636 +0.5801260891262788#2637 +0.5841915469034741#2638 +0.5882423992538642#2639 +0.5922785449017157#2640 +0.5962998829389786#2641 +0.6003063128278092#2642 +0.604297734403084#2643 +0.6082740478749037#2644 +0.6122351538310878#2645 +0.6161809532396609#2646 +0.6201113474513273#2647 +0.6240262382019387#2648 +0.6279255276149498#2649 +0.631809118203866#2650 +0.6356769128746803#2651 +0.6395288149283012#2652 +0.6433647280629696#2653 +0.6471845563766672#2654 +0.6509882043695135#2655 +0.6547755769461538#2656 +0.6585465794181369#2657 +0.6623011175062814#2658 +0.6660390973430341#2659 +0.669760425474816#2660 +0.6734650088643587#2661 +0.677152754893031#2662 +0.6808235713631537#2663 +0.6844773665003056#2664 +0.6881140489556168#2665 +0.6917335278080537#2666 +0.6953357125666911#2667 +0.6989205131729754#2668 +0.7024878400029757#2669 +0.7060376038696243#2670 +0.7095697160249471#2671 +0.7130840881622821#2672 +0.7165806324184868#2673 +0.7200592613761355#2674 +0.7235198880657044#2675 +0.7269624259677462#2676 +0.7303867890150528#2677 +0.7337928915948077#2678 +0.7371806485507255#2679 +0.7405499751851818#2680 +0.7439007872613306#2681 +0.7472330010052095#2682 +0.7505465331078351#2683 +0.7538413007272853#2684 +0.7571172214907707#2685 +0.7603742134966938#2686 +0.7636121953166967#2687 +0.7668310859976969#2688 +0.7700308050639114#2689 +0.7732112725188682#2690 +0.776372408847407#2691 +0.7795141350176664#2692 +0.7826363724830605#2693 +0.7857390431842419#2694 +0.7888220695510542#2695
\ No newline at end of file diff --git a/MPChartExample/src/main/assets/n.txt b/MPChartExample/src/main/assets/n.txt new file mode 100644 index 00000000..b95d9c7f --- /dev/null +++ b/MPChartExample/src/main/assets/n.txt @@ -0,0 +1,100 @@ +0.0#0 +0.05#1 +0.1#2 +0.15#3 +0.2#4 +0.25#5 +0.3#6 +0.35000002#7 +0.40000004#8 +0.45000005#9 +0.50000006#10 +0.5500001#11 +0.6000001#12 +0.6500001#13 +0.7000001#14 +0.7500001#15 +0.80000013#16 +0.85000014#17 +0.90000015#18 +0.95000017#19 +1.0000001#20 +1.0500001#21 +1.1#22 +1.15#23 +1.1999999#24 +1.2499999#25 +1.2999998#26 +1.3499998#27 +1.3999997#28 +1.4499997#29 +1.4999996#30 +1.5499996#31 +1.5999995#32 +1.6499995#33 +1.6999995#34 +1.7499994#35 +1.7999994#36 +1.8499993#37 +1.8999993#38 +1.9499992#39 +1.9999992#40 +2.0499992#41 +2.0999992#42 +2.1499991#43 +2.199999#44 +2.249999#45 +2.299999#46 +2.349999#47 +2.399999#48 +2.4499989#49 +2.4999988#50 +2.5499988#51 +2.5999987#52 +2.6499987#53 +2.6999986#54 +2.7499986#55 +2.7999985#56 +2.8499985#57 +2.8999984#58 +2.9499984#59 +2.9999983#60 +3.0499983#61 +3.0999982#62 +3.1499982#63 +3.1999981#64 +3.249998#65 +3.299998#66 +3.349998#67 +3.399998#68 +3.449998#69 +3.4999979#70 +3.5499978#71 +3.5999978#72 +3.6499977#73 +3.6999977#74 +3.7499976#75 +3.7999976#76 +3.8499975#77 +3.8999975#78 +3.9499974#79 +3.9999974#80 +4.0499973#81 +4.0999975#82 +4.1499977#83 +4.199998#84 +4.249998#85 +4.2999983#86 +4.3499985#87 +4.3999987#88 +4.449999#89 +4.499999#90 +4.549999#91 +4.5999994#92 +4.6499996#93 +4.7#94 +4.75#95 +4.8#96 +4.8500004#97 +4.9000006#98 +4.950001#99
\ No newline at end of file diff --git a/MPChartExample/src/main/assets/nlogn.txt b/MPChartExample/src/main/assets/nlogn.txt new file mode 100644 index 00000000..b379c6eb --- /dev/null +++ b/MPChartExample/src/main/assets/nlogn.txt @@ -0,0 +1,100 @@ +0.0#0 +-0.14978661516463596#1 +-0.2302585112404076#2 +-0.28456800308013386#3 +-0.32188758430308656#4 +-0.34657359027997264#5 +-0.36119184372932583#6 +-0.36743774476238833#7 +-0.3665162897559837#8 +-0.359328453690093#9 +-0.3465735719901158#10 +-0.32881032165064733#11 +-0.3064953334396977#12 +-0.28000884117531694#13 +-0.24967239173581385#14 +-0.21576146942391214#15 +-0.1785147391820012#16 +-0.13814097027046854#17 +-0.0948243254478918#18 +-0.04872847133564503#19 +1.1920929665620834E-7#20 +0.05122974739322425#21 +0.10484122389898727#22 +0.16072620655739048#23 +0.21878578358651998#24 +0.2789292933326941#25 +0.34107333312798316#26 +0.4051409208357928#27 +0.4710607807659298#28 +0.538766731719029#29 +0.6081971595287982#30 +0.6792945600019588#31 +0.7520051408885056#32 +0.8262784736489888#33 +0.9020671874662887#34 +0.9793266992836409#35 +1.0580149747177598#36 +1.1380923155552924#37 +1.219521170237435#38 +1.3022659643057064#39 +1.3862929482479571#40 +1.4715702653505391#41 +1.5580670118770785#42 +1.6457543452870462#43 +1.7346045724760228#44 +1.8245912594493057#45 +1.9156891473526845#46 +2.0078740758078952#47 +2.1011229127752893#48 +2.195413490263484#49 +2.290724545289105#50 +2.3870356655613914#51 +2.4843272394282487#52 +2.582580409673842#53 +2.6817770308042372#54 +2.7818996294980054#55 +2.8829313679339723#56 +2.984856009739134#57 +3.0876578883268277#58 +3.191321877419036#59 +3.2958333635676733#60 +3.401178220508231#61 +3.507342785195528#62 +3.6143138353859015#63 +3.7220785686430475#64 +3.8306245826562813#65 +3.939939856770217#66 +4.050012734634095#67 +4.160831907887155#68 +4.272386400803882#69 +4.384665555829532#70 +4.497659019942356#71 +4.6113567317842685#72 +4.725748909506607#73 +4.840826039281976#74 +4.956578864437172#75 +5.072998375165778#76 +5.190075798782273#77 +5.307802590482506#78 +5.4261704245780376#79 +5.545171186174402#80 +5.664796963265484#81 +5.785040614042304#82 +5.9058940410526075#83 +6.027349897205024#84 +6.149401010352234#85 +6.2720403771158635#86 +6.395261156998629#87 +6.519056666767231#88 +6.643420375090577#89 +6.768345897419035#90 +6.893826991091276#91 +7.019857550656251#92 +7.146431603398553#93 +7.273543305056277#94 +7.401186935721112#95 +7.529356895911067#96 +7.658047702806867#97 +7.787253986643549#98 +7.916970487249359#99
\ No newline at end of file diff --git a/MPChartExample/src/main/assets/othersine.txt b/MPChartExample/src/main/assets/othersine.txt new file mode 100644 index 00000000..142857b0 --- /dev/null +++ b/MPChartExample/src/main/assets/othersine.txt @@ -0,0 +1,8000 @@ +0.0#0 +0.09983341664682815#1 +0.19866933079506122#2 +0.2955202066613396#3 +0.3894183423086505#4 +0.479425538604203#5 +0.5646424733950354#6 +0.644217687237691#7 +0.7173560908995227#8 +0.7833269096274833#9 +0.8414709848078964#10 +0.8912073600614353#11 +0.9320390859672263#12 +0.963558185417193#13 +0.9854497299884603#14 +0.9974949866040544#15 +0.9995736030415051#16 +0.9916648104524686#17 +0.973847630878195#18 +0.9463000876874144#19 +0.9092974268256815#20 +0.8632093666488735#21 +0.8084964038195899#22 +0.7457052121767197#23 +0.6754631805511504#24 +0.5984721441039558#25 +0.5155013718214634#26 +0.42737988023382895#27 +0.33498815015590383#28 +0.23924932921398112#29 +0.1411200080598659#30 +0.04158066243328916#31 +-0.05837414342758142#32 +-0.15774569414324996#33 +-0.25554110202683294#34 +-0.3507832276896215#35 +-0.44252044329485407#36 +-0.5298361409084948#37 +-0.6118578909427207#38 +-0.6877661591839753#39 +-0.7568024953079294#40 +-0.8182771110644114#41 +-0.8715757724135886#42 +-0.9161659367494552#43 +-0.9516020738895161#44 +-0.977530117665097#45 +-0.9936910036334644#46 +-0.9999232575641008#47 +-0.9961646088358408#48 +-0.9824526126243328#49 +-0.958924274663139#50 +-0.9258146823277331#51 +-0.8834546557201545#52 +-0.8322674422239027#53 +-0.7727644875559894#54 +-0.7055403255703945#55 +-0.6312666378723244#56 +-0.5506855425976414#57 +-0.4646021794137613#58 +-0.37387666483024096#59 +-0.27941549819893097#60 +-0.18216250427210112#61 +-0.0830894028175026#62 +0.016813900484343496#63 +0.11654920485048659#64 +0.21511998808780858#65 +0.3115413635133711#66 +0.40484992061659103#67 +0.4941133511386012#68 +0.5784397643881929#69 +0.6569865987187824#70 +0.7289690401258698#71 +0.7936678638491472#72 +0.8504366206285593#73 +0.8987080958116223#74 +0.9379999767747351#75 +0.9679196720314837#76 +0.9881682338769986#77 +0.9985433453746043#78 +0.9989413418397726#79 +0.9893582466233836#80 +0.9698898108450894#81 +0.9407305566797773#82 +0.9021718337562995#83 +0.8545989080882879#84 +0.7984871126234988#85 +0.734397097874123#86 +0.662969230082194#87 +0.5849171928917747#88 +0.5010208564578985#89 +0.41211848524177114#90 +0.3190983623493673#91 +0.22288991410026324#92 +0.12445442350707933#93 +0.024775425453375525#94 +-0.07515112046179159#95 +-0.17432678122296213#96 +-0.27176062641092535#97 +-0.36647912925191023#98 +-0.457535893775304#99 +-0.5440211108893535#100 +-0.6250706488928668#101 +-0.6998746875935284#102 +-0.7676858097635688#103 +-0.8278264690856417#104 +-0.8796957599716599#105 +-0.9227754216127984#106 +-0.9566350162701817#107 +-0.980936230066487#108 +-0.9954362533063752#109 +-0.9999902065507036#110 +-0.9945525882039916#111 +-0.9791777291513221#112 +-0.9540192499020964#113 +-0.9193285256646855#114 +-0.8754521746884406#115 +-0.822828594968723#116 +-0.7619835839190494#117 +-0.6935250847771416#118 +-0.6181371122370543#119 +-0.5365729180004575#120 +-0.4496474645346253#121 +-0.3582292822368536#122 +-0.26323179136582836#123 +-0.16560417544833742#124 +-0.06632189735122905#125 +0.03362304722110829#126 +0.13323204141991404#127 +0.23150982510150958#128 +0.3274744391376645#129 +0.4201670368266135#130 +0.5086614643723477#131 +0.5920735147071987#132 +0.6695697621965786#133 +0.7403758899524271#134 +0.8037844265516019#135 +0.8591618148564795#136 +0.9059547423084483#137 +0.9436956694440937#138 +0.972007501394968#139 +0.9906073556948657#140 +0.9993093887479164#141 +0.9980266527163638#142 +0.9867719642746191#143 +0.9656577765492868#144 +0.9348950555246957#145 +0.8947911721405201#146 +0.8457468311429532#147 +0.7882520673753391#148 +0.7228813495120019#149 +0.6502878401571452#150 +0.5711968696600193#151 +0.4863986888538323#152 +0.3967405731306479#153 +0.3031183567457395#154 +0.20646748193783482#155 +0.10775365229948292#156 +0.007963183785976422#157 +-0.09190685022764096#158 +-0.19085858137414927#159 +-0.28790331666502617#160 +-0.3820714171839697#161 +-0.4724219863984317#162 +-0.558052271286747#163 +-0.6381066823479201#164 +-0.7117853423690981#165 +-0.7783520785342762#166 +-0.8371417780197293#167 +-0.8875670335814898#168 +-0.9291240127343579#169 +-0.961397491879549#170 +-0.9840650050816383#171 +-0.9969000660415941#172 +-0.9997744310730117#173 +-0.9926593804706357#174 +-0.9756260054681622#175 +-0.9488444979181307#176 +-0.9125824497911917#177 +-0.8672021794855902#178 +-0.8131571116614967#179 +-0.7509872467716855#180 +-0.6813137655555104#181 +-0.6048328224062927#182 +-0.5223085896267406#183 +-0.43456562207190313#184 +-0.34248061846961925#185 +-0.24697366173662777#186 +-0.14899902581420232#187 +-0.049535640878370965#188 +0.05042268780681122#189 +0.14987720966295234#190 +0.24783420798295983#191 +0.3433149288198987#192 +0.4353653603728964#193 +0.5230657651577025#194 +0.6055398697196067#195 +0.6819636200681407#196 +0.7515734153521554#197 +0.8136737375071116#198 +0.8676441006416744#199 +0.9129452507276334#200 +0.949124553647899#201 +0.9758205177669794#202 +0.9927664058359092#203 +0.9997929001426696#204 +0.9968297942787976#205 +0.9839066946186122#206 +0.9611527245021096#207 +0.9287952340772312#208 +0.887157528692338#209 +0.8366556385360404#210 +0.777794161801075#211 +0.71116122290596#212 +0.6374225961502142#213 +0.5573150535176319#214 +0.47163900309416484#215 +0.3812504916549073#216 +0.28705265132769103#217 +0.18998667579539935#218 +0.09102241619980542#219 +-0.008851309290446507#220 +-0.10863659542412214#221 +-0.20733642060680393#222 +-0.30396460881109105#223 +-0.39755568312147854#224 +-0.487174512460553#225 +-0.5719256551096047#226 +-0.6509623056662873#227 +-0.7234947560442817#228 +-0.7887982859754514#229 +-0.846220404175201#230 +-0.8951873678197072#231 +-0.9352099151945603#232 +-0.9658881542360861#233 +-0.986915558120659#234 +-0.9980820279794003#235 +-0.9992759921366252#236 +-0.9904855208971471#237 +-0.9717984457438473#238 +-0.9434014817545319#239 +-0.9055783620065937#240 +-0.8587070026098931#241 +-0.8032557266939103#242 +-0.7397785850778432#243 +-0.6689098203779662#244 +-0.5913575298650613#245 +-0.5078965903905548#246 +-0.4193609160731571#247 +-0.326635126104645#248 +-0.2306457059273127#249 +-0.13235175009768851#250 +-0.0327353793307601#251 +0.06720807252556354#252 +0.16648000353724682#253 +0.2640885213845585#254 +0.3590583540222545#255 +0.4504405942754718#256 +0.5373221810065527#257 +0.6188350221201147#258 +0.6941646682523136#259 +0.7625584504796671#260 +0.823333000738138#261 +0.875881079810939#262 +0.9196776446620603#263 +0.9542850944927288#264 +0.9793576431039386#265 +0.9946447738778491#266 +0.999993742857021#267 +0.9953511049115485#268 +0.9807632477451307#269 +0.9563759284044698#270 +0.9224328169230419#271 +0.8792730616506684#272 +0.8273279005953128#273 +0.7671163526354526#274 +0.6992400316550114#275 +0.624377135416297#276 +0.5432756692321434#277 +0.45674597214408225#278 +0.3656526202825023#279 +0.2709057883077459#280 +0.17345215524576615#281 +0.07426544558423022#282 +-0.025663299860690898#283 +-0.12533562609656307#284 +-0.223755640186928#285 +-0.31993996188432605#286 +-0.4129275492406663#287 +-0.501789301020694#288 +-0.5856373399744128#289 +-0.6636338842130738#290 +-0.734999618048874#291 +-0.7990214786597013#292 +-0.8550597807771457#293 +-0.9025546082102497#294 +-0.941031408343004#295 +-0.9701057337072216#296 +-0.9894870832545573#297 +-0.9989818049469563#298 +-0.9984950306638061#299 +-0.9880316240928376#300 +-0.9676961321337658#301 +-0.9376917403002256#302 +-0.8983182425572844#303 +-0.8499690458792419#304 +-0.7931272394571857#305 +-0.7283607678314815#306 +-0.6563167561776644#307 +-0.5777150444455955#308 +-0.49334099495663#309 +-0.40403764532290903#310 +-0.3106972850942102#311 +-0.21425254029571766#312 +-0.11566705493706401#313 +-0.015925862599924186#314 +0.08397445569192384#315 +0.18303572898076265#316 +0.28026816976919344#317 +0.37470026364963#318 +0.465388476355119#319 +0.5514266812418447#320 +0.6319552130070282#321 +0.7061694571804652#322 +0.7733278895663422#323 +0.8327594853078859#324 +0.8838704235459204#325 +0.9261500206806009#326 +0.9591758329531347#327 +0.9826178773641765#328 +0.9962419287548808#329 +0.9999118601072645#330 +0.9935910026803725#331 +0.9773425123922165#332 +0.9513287387867192#333 +0.9158096028907363#334 +0.8711400001690751#335 +0.8177662545263231#336 +0.7562216587859281#337 +0.6871211462045894#338 +0.6111551462624274#339 +0.529082686119843#340 +0.44172380666903255#341 +0.34995136895646245#342 +0.2546823328438221#343 +0.15686859504819245#344 +0.05748747810470466#345 +-0.04246803471717159#346 +-0.14199922097421971#347 +-0.24011159795399523#348 +-0.33582485921735605#349 +-0.42818266949635647#350 +-0.5162622200801217#351 +-0.5991834492144473#352 +-0.676117835387937#353 +-0.7462966756450723#354 +-0.8090187662120443#355 +-0.8636574086930742#356 +-0.9096666718336256#357 +-0.9465868462850383#358 +-0.974049037868381#359 +-0.9917788534431466#360 +-0.9995991425528098#361 +-0.9974317674536307#362 +-0.9852983838411613#363 +-0.9633202244736941#364 +-0.9317168878546153#365 +-0.8908041440767483#366 +-0.840990779751967#367 +-0.7827745135504952#368 +-0.7167370231604792#369 +-0.6435381333568037#370 +-0.5639092232500512#371 +-0.4786459185881904#372 +-0.38860014212710114#373 +-0.2946716015000064#374 +-0.19779879963620456#375 +-0.09894965755002794#376 +8.881568059804928E-4#377 +0.10071709699276916#378 +0.19953970523905196#379 +0.29636857870964317#380 +0.39023623530819473#381 +0.48020478043849585#382 +0.5653752781372515#383 +0.6448967329450791#384 +0.7179745927718371#385 +0.783878687798465#386 +0.8419505260924545#387 +0.8916098730415694#388 +0.9323605488662917#389 +0.9637953862841635#390 +0.9856002987906811#391 +0.997557418907825#392 +0.9995472750438832#393 +0.9915499852141032#394 +0.9736454556949117#395 +0.9460125826268136#396 +0.9089274645432923#397 +0.862760643685528#398 +0.8079734036668093#399 +0.7451131604791498#400 +0.6748079928936466#401 +0.5977603669050155#402 +0.5147401169235761#403 +0.42657675384429683#404 +0.33415117684813256#405 +0.23838687174859532#406 +0.1402406838267691#407 +0.040693257349552474#408 +-0.059260762703698414#409 +-0.15862266880501766#410 +-0.2563996696333202#411 +-0.35161480971710896#412 +-0.4433167308506074#413 +-0.5305891777504746#414 +-0.6125601529757225#415 +-0.6884106296379023#416 +-0.7573827348470396#417 +-0.8187873221270313#418 +-0.8720108571394337#419 +-0.9165215479157646#420 +-0.9518746583470648#421 +-0.9777169518400896#422 +-0.9937902207405829#423 +-0.9999338662588075#424 +-0.9960865031195645#425 +-0.9822865729035719#426 +-0.9586719599518976#427 +-0.9254786136712014#428 +-0.8830381910052587#429 +-0.831774742628409#430 +-0.7722004759713906#431 +-0.7049106374140062#432 +-0.6305775647800578#433 +-0.549943969560057#434 +-0.46381551598351894#435 +-0.3730527710882991#436 +-0.2785626062192159#437 +-0.18128913586934542#438 +-0.08220428440008934#439 +0.017701925105768793#440 +0.11743126282744855#441 +0.21598726618857098#442 +0.312385196181835#443 +0.4056618765556671#444 +0.49488531755294296#445 +0.5791640280445662#446 +0.6576559230141424#447 +0.7295767373931061#448 +0.7942078621780435#449 +0.8509035245343125#450 +0.8990972401447438#451 +0.9383074733336821#452 +0.9681424484122837#453 +0.9883040641716944#454 +0.9985908724117905#455 +0.9989000907450034#456 +0.989228629563962#457 +0.969673122911827#458 +0.9404289629468755#459 +0.9017883476486434#460 +0.8541373612723012#461 +0.7979521167223996#462 +0.7337939983901085#463 +0.6623040529859501#464 +0.5841965844129685#465 +0.5002520166782486#466 +0.4113090961542109#467 +0.318256511102111#468 +0.2220240121926944#469 +0.12357312274482915#470 +0.023887531502341068#471 +-0.07603673605875032#472 +-0.1752012696875459#473 +-0.2726152501434634#474 +-0.367305349134568#475 +-0.4583254544921258#476 +-0.5447661234106508#477 +-0.6257636692997951#478 +-0.7005087914552633#479 +-0.7682546613239306#480 +-0.8283243845678764#481 +-0.8801177643688576#482 +-0.923117298396518#483 +-0.9568933495206096#484 +-0.9811084386031781#485 +-0.995520616478555#486 +-0.9999858814294422#487 +-0.9944596180044706#488 +-0.9789970428010428#489 +-0.9537526527593436#490 +-0.918978681479984#491 +-0.8750225789892403#492 +-0.8223235401332446#493 +-0.7614081162882599#494 +-0.6928849542333831#495 +-0.6174387147531208#496 +-0.5358232317331488#497 +-0.4488539801013109#498 +-0.3573999278716999#499 +-0.26237485370350366#500 +-0.16472821672669768#501 +-0.06543566986026736#502 +0.03451068858925011#503 +0.13411222764610073#504 +0.2323737616559199#505 +0.32831349385182623#506 +0.42097282614317716#507 +0.5094259371108206#508 +0.5927890325086789#509 +0.6702291758437122#510 +0.740972610802025#511 +0.8043124923661843#512 +0.859615949376982#513 +0.9063304079728589#514 +0.9439891127252716#515 +0.9722157903046471#516 +0.9907284090791111#517 +0.9993419970813273#518 +0.9979704901872514#519 +0.9866275920404088#520 +0.9654266371296195#521 +0.9345794583882479#522 +0.8943942706295563#523 +0.8452725909661725#524 +0.7877052269838246#525 +0.7222673727541837#526 +0.6496128616858338#527 +0.5704676336369813#528 +0.48562248156435645#529 +0.3959251501813905#530 +0.3022718655732663#531 +0.20559838040212833#532 +0.10687062417580104#533 +0.007075051999440675#534 +-0.09279121175779685#535 +-0.19173033639984702#536 +-0.2887537548982128#537 +-0.38289204132693666#538 +-0.47320459704600304#539 +-0.5587890488520287#540 +-0.6387902651930264#541 +-0.712408900360203#542 +-0.7789093812860535#543 +-0.8376272571473031#544 +-0.8879758383378954#545 +-0.929452058477602#546 +-0.9616415008850029#547 +-0.984222539291978#548 +-0.9969695514270638#549 +-0.9997551733586085#550 +-0.9925515720730763#551 +-0.9754307235733183#552 +-0.948563693718144#553 +-0.9122189289888067#554 +-0.8667595742605005#555 +-0.8126398443788057#556 +-0.7504004857950958#557 +-0.6806633736067427#558 +-0.6041252979867081#559 +-0.5215510020864632#560 +-0.43376554097521025#561 +-0.3416460379623573#562 +-0.2461129206713498#563 +-0.14812072443110932#564 +-0.04864855487455499#565 +0.0513096949612317#566 +0.1507552752856959#567 +0.24869455873257396#568 +0.34414896835608744#569 +0.4361647552483109#570 +0.5238225280829925#571 +0.6062464393697752#572 +0.6826129366328042#573 +0.7521589910748351#574 +0.8141897215087521#575 +0.8680853373806932#576 +0.9133073315123875#577 +0.9494038606868752#578 +0.9760142603165708#579 +0.9928726480846032#580 +0.9998105805530361#581 +0.9967587361940206#582 +0.9837476080275863#583 +0.9609071989454651#584 +0.9284657227651701#585 +0.8867473239929686#586 +0.8361688390791232#587 +0.7772356315258688#588 +0.7105365424623492#589 +0.6367380071386995#590 +0.5565773961253213#591 +0.4708556477498852#592 +0.38042926538631583#593 +0.28620175955620214#594 +0.18911462035032636#595 +0.09013791037089226#596 +-0.009739427813336072#597 +-0.10951945285428034#598 +-0.20820519572462254#599 +-0.30481062110277163#600 +-0.3983704795118571#601 +-0.48794995177343276#602 +-0.5726539894116975#603 +-0.6516362576820022#604 +-0.7241075918678563#605 +-0.7893438823539132#606 +-0.8466933096898865#607 +-0.8955828573550356#608 +-0.935524037149826#609 +-0.966117770008547#610 +-0.9870583734654177#611 +-0.9981366159327402#612 +-0.999241807273761#613 +-0.9903629047819286#614 +-0.9715886235159662#615 +-0.9431065498883311#616 +-0.9052012673637889#617 +-0.8582515129955042#618 +-0.8027263932095995#619 +-0.7391806966488114#620 +-0.6682493509077604#621 +-0.5906410785463059#622 +-0.5071313157679993#623 +-0.418554464517864#624 +-0.3257955554139773#625 +-0.2297814048140864#626 +-0.131471354372927#627 +-0.03184768561752508#628 +0.06809419468512197#629 +0.1673557003034234#630 +0.26494504308473243#631 +0.3598871425747261#632 +0.4512333686989858#633 +0.5380710201611258#634 +0.6195324438524475#635 +0.6948037041549939#636 +0.7631327155171924#637 +0.8238367570440802#638 +0.8763092940188087#639 +0.9200260381970413#640 +0.9545501863217811#641 +0.9795367845171353#642 +0.9947361749534073#643 +0.9999964903456082#644 +0.9952651713611683#645 +0.9805894917754141#646 +0.9561160861276317#647 +0.9220894845972212#648 +0.8788496697389755#649 +0.8268286794897758#650 +0.7665462903883387#651 +0.6986048241398573#652 +0.6236831294166234#653 +0.542529799026492#654 +0.4559556902209967#655 +0.3648258228777264#656 +0.27005073650764577#657 +0.17257739244528622#658 +0.07337971212411498#659 +-0.026551154024492412#660 +-0.12621672981873175#661 +-0.2246211897703263#662 +-0.3207813090436296#663 +-0.41373628751317226#664 +-0.5025573497609173#665 +-0.5863570250932251#666 +-0.664298014854665#667 +-0.7356015584394067#668 +-0.7995552144097693#669 +-0.8555199789755651#670 +-0.9029366707087443#671 +-0.9413315176993833#672 +-0.9703208913280009#673 +-0.9896151393559127#674 +-0.9990214800346544#675 +-0.9984459283174868#676 +-0.9878942349269157#677 +-0.9674718288953736#678 +-0.9373827641531779#679 +-0.8979276806891099#680 +-0.849500800655026#681 +-0.7925859894284285#682 +-0.7277519209895582#683 +-0.6556463959189626#684 +-0.5769898687882292#685 +-0.4925682496160574#686 +-0.40322505131513814#687 +-0.30985296158995934#688 +-0.21338492349634555#689 +-0.1147848137828343#690 +-0.015037812152819907#691 +0.08485944232538563#692 +0.18390880930667822#693 +0.2811206202575485#694 +0.37552356689692795#695 +0.46617440618746125#696 +0.552167384908141#697 +0.6326432896410897#698 +0.7067980317480133#699 +0.773890681558078#700 +0.8332508714922635#701 +0.8842854941546171#702 +0.9264846284653002#703 +0.9594266346234597#704 +0.9827823669927427#705 +0.9963184628156941#706 +0.9998996738972894#707 +0.9934902179601922#708 +0.9771541361694416#709 +0.9510546532542999#710 +0.9154525466207135#711 +0.870703540749673#712 +0.8172547529157873#713 +0.7556402257392723#714 +0.6864755912086206#715 +0.610451919489274#716 +0.5283288139789675#717 +0.44092682160167046#718 +0.3491192341739591#719 +0.2538233627618576#720 +0.1559913722118884#721 +0.056600767434670324#722 +-0.04335537350102874#723 +-0.14287832187608665#724 +-0.2409736772882528#725 +-0.3366613033722623#726 +-0.42898512099840763#727 +-0.5170226610991652#728 +-0.5998942816751899#729 +-0.6767719568874018#730 +-0.7468875504174615#731 +-0.8095404904319502#732 +-0.8641047694645521#733 +-0.9100351992757256#734 +-0.9468728581933795#735 +-0.9742496765065195#736 +-0.9918921140961338#737 +-0.9996238935576413#738 +-0.9973677615064493#739 +-0.9851462604682352#740 +-0.9630815036414816#741 +-0.9313939547827625#742 +-0.8904002254057634#743 +-0.8405099113036936#744 +-0.7822215000035158#745 +-0.7161173900433542#746 +-0.6428580718388172#747 +-0.5631755282810933#748 +-0.47786592100586434#749 +-0.38778163540941735#750 +-0.29382276389552614#751 +-0.19692811244968383#752 +-0.09806582040002382#753 +0.001776312910822753#754 +0.10160069789023536#755 +0.2004099222810544#756 +0.29721671697515395#757 +0.3910538204800225#758 +0.480983643475862#759 +0.5661076368981451#760 +0.645575269942848#761 +0.7185925282890948#762 +0.7844298476277866#763 +0.8424294032270155#764 +0.8920116826993384#765 +0.9326812762979901#766 +0.9640318268873135#767 +0.9857500901289341#768 +0.9976190643156452#769 +0.9995201585807343#770 +0.9914343778187229#771 +0.9734425124781813#772 +0.945724331330272#773 +0.9085567852786125#774 +0.8623112401573938#775 +0.807449766166722#776 +0.7445205210199198#777 +0.6741522729328512#778 +0.5970481181797517#779 +0.5139784559876693#780 +0.4257732909620477#781 +0.33331393995507175#782 +0.23752422623900496#783 +0.1393612489694287#784 +0.03980582016685425#785 +-0.06014733523277261#786 +-0.15949951834081932#787 +-0.2572580349851358#788 +-0.3524461143820813#789 +-0.44411266870731736#790 +-0.5313417960509607#791 +-0.6132619318067095#792 +-0.6890545570572891#793 +-0.7579623769449068#794 +-0.8192968873111423#795 +-0.8724452540029098#796 +-0.9168764361087397#797 +-0.9521464919440266#798 +-0.9779030147695946#799 +-0.9938886539233454#800 +-0.9999436861830043#801 +-0.9960076116677604#802 +-0.9821197583330767#803 +-0.9584188890187596#804 +-0.9251418149765318#805 +-0.882621029730285#806 +-0.8312813869106968#807 +-0.7716358552581907#808 +-0.7042803932088473#809 +-0.6298879942747078#810 +-0.5492019627150644#811 +-0.463028486686005#812 +-0.37222858307484785#813 +-0.277709494504018#814 +-0.18041562446265824#815 +-0.0813191011391443#816 +0.018589935762430915#817 +0.1183132281708837#818 +0.2168543739126067#819 +0.3132287824327208#820 +0.406473512498437#821 +0.4956568935895487#822 +0.5798878348422998#823 +0.6583247285347402#824 +0.7301838591528853#825 +0.7947472340170689#826 +0.8513697572274626#827 +0.8994856752490656#828 +0.9386142297340143#829 +0.9683644611000755#830 +0.9884391148695585#831 +0.998637611737797#832 +0.9988580516952584#833 +0.9890982321787556#834 +0.9694556700787299#835 +0.9401266273827171#836 +0.9014041501904432#837 +0.853675140694064#838 +0.7974164913793547#839 +0.7331903200736304#840 +0.6616383534502285#841 +0.5834755151077143#842 +0.4994827822896071#843 +0.41049938261791885#844 +0.31741440880816796#845 +0.22115793514885987#846 +0.12269172450663844#847 +0.022999618709638837#848 +-0.07692229167484431#849 +-0.17607561994804152#850 +-0.2734696588295798#851 +-0.36813127927714384#852 +-0.4591146536701932#853 +-0.5455107062068977#854 +-0.6264561960890486#855 +-0.701142342738765#856 +-0.7688229068666809#857 +-0.8288216466482501#858 +-0.880539074508522#859 +-0.9234584470038253#860 +-0.9571509279514455#861 +-0.9812798732190074#862 +-0.9956041943613665#863 +-0.9999807674966593#864 +-0.9943658633528207#865 +-0.9788155841960154#866 +-0.9534853032753393#867 +-0.9186281123846742#868 +-0.8745922930531441#869 +-0.8218178366312031#870 +-0.7608320480425032#871 +-0.6922442771274011#872 +-0.6167398302207777#873 +-0.5350731227976723#874 +-0.4480601416032317#875 +-0.35657029158288345#876 +-0.2615177090755071#877 +-0.16385212806530994#878 +-0.06454939075379683#879 +0.035398302732936385#880 +0.13499230807988533#881 +0.23323751490702455#882 +0.3291522895832851#883 +0.4217782833853109#884 +0.5101900080011152#885 +0.5935040827033676#886 +0.6708880607976146#887 +0.7415687471544812#888 +0.8048399237198179#889 +0.8600694058120545#890 +0.9067053587025647#891 +0.9442818113658633#892 +0.9724233123080624#893 +0.990848680954091#894 +0.999373817111055#895 +0.9979135404365095#896 +0.9864824415322831#897 +0.9651947361600082#898 +0.9342631240349845#899 +0.8939966636009335#900 +0.8447976840201904#901 +0.7871577652337052#902 +0.7216528262567685#903 +0.6489373707865839#904 +0.5697379476176754#905 +0.4848458912064981#906 +0.3951094149191295#907 +0.30142513596369747#908 +0.20472911668761928#909 +0.1059875117520471#910 +0.006186914633861963#911 +-0.09367550009022263#912 +-0.19260194018240928#913 +-0.2896039653540304#914 +-0.3837123634341776#915 +-0.47398683441733475#916 +-0.5595253856302109#917 +-0.6394733441443728#918 +-0.7130318963856286#919 +-0.7794660696152083#920 +-0.8381120755344199#921 +-0.888383942637911#922 +-0.9297793710472535#923 +-0.9618847513252905#924 +-0.9843792971249118#925 +-0.9970382503801957#926 +-0.9997351270147091#927 +-0.9924429807285888#928 +-0.9752346722370627#929 +-0.9482821412702676#930 +-0.9118546886083012#931 +-0.8663162853168473#932 +-0.8121219360685991#933 +-0.7498131328869748#934 +-0.6800124447368134#935 +-0.6034172970210714#936 +-0.5207930031367345#937 +-0.4329651177163347#938 +-0.3408111879589536#939 +-0.2452519854686876#940 +-0.1472423062091467#941 +-0.047761430497799545#942 +0.05219666163925169#943 +0.15163322198712595#944 +0.2495547133041842#945 +0.3449827364177279#946 +0.43696380606511737#947 +0.524578877803335#948 +0.6069525307972649#949 +0.6832617147353013#950 +0.7527439734759979#951 +0.8147050632577988#952 +0.8685258893532176#953 +0.9136686918587087#954 +0.9496824188138638#955 +0.9762072329635024#956 +0.9929781071325793#957 +0.9998274722901109#958 +0.9966868918435423#959 +0.9835877454345576#960 +0.9606609154040736#961 +0.9281354790591521#962 +0.8863364198082719#963 +0.8356813800345357#964 +0.7766764881510327#965 +0.7099113015330387#966 +0.6360529158556042#967 +0.5558392996940816#968 +0.4700719209860606#969 +0.3796077390286655#970 +0.28535064202453175#971 +0.1882424157296708#972 +0.08925333344150882#973 +-0.010627538651171125#974 +-0.11040222389064579#975 +-0.20907380660312846#976 +-0.3056563929506449#977 +-0.3991849616563692#978 +-0.4887250061782283#979 +-0.5733818719893634#980 +-0.6523096956704291#981 +-0.7247198564972739#982 +-0.7898888560785331#983 +-0.8471655473123978#984 +-0.8959776404332164#985 +-0.9358374211416584#986 +-0.9663466236847766#987 +-0.9872004101957622#988 +-0.9981904165331424#989 +-0.9992068341864074#990 +-0.9902395074463488#991 +-0.9713780348775489#992 +-0.9428108740791415#993 +-0.9048234586787762#994 +-0.8577953463741634#995 +-0.8021964265180238#996 +-0.7385822251390002#997 +-0.6675883543092127#998 +-0.5899241613185386#999 +-0.5063656411109719#1000 +-0.41774768279965196#1001 +-0.3249557277308229#1002 +-0.22891692244659007#1003 +-0.1305908549431452#1004 +-0.03095996678470595#1005 +0.06898026312784167#1006 +0.16823126505305938#1007 +0.26580135578772984#1008 +0.3607156472376163#1009 +0.45202578717704495#1010 +0.5388194348708605#1011 +0.6202293768814718#1012 +0.6954421919788581#1013 +0.7637063785766175#1014 +0.8243398634874052#1015 +0.8767368169727581#1016 +0.9203737059935807#1017 +0.9548145251792146#1018 +0.9797151532489783#1019 +0.9948267913582519#1020 +0.9999984490142912#1021 +0.9951784527233196#1022 +0.9804149622949977#1023 +0.955855489645524#1024 +0.9217454249073299#1025 +0.8784255845719909#1026 +0.8263288061645024#1027 +0.7659756234738067#1028 +0.697969065551239#1029 +0.6229886314435827#1030 +0.5417835008632049#1031 +0.4551650486320175#1032 +0.3639987376924607#1033 +0.2691954716878667#1034 +0.17170249351436012#1035 +0.07249392078295652#1036 +-0.02743898724160609#1037 +-0.1270977339757739#1038 +-0.225486562164981#1039 +-0.3216224031609835#1040 +-0.41454469941883354#1041 +-0.5033250020703501#1042 +-0.5870762476783056#1043 +-0.6649616214810665#1044 +-0.7362029185690774#1045 +-0.8000883194510767#1046 +-0.8559795023191575#1047 +-0.9033180209492709#1048 +-0.9416308845112984#1049 +-0.9705352835370772#1050 +-0.989742414826066#1051 +-0.9990603670714583#1052 +-0.9983960383745241#1053 +-0.987756066488005#1054 +-0.9672467624938841#1055 +-0.9370730485781962#1056 +-0.8975364105162827#1057 +-0.8490318853265837#1058 +-0.79204411419133#1059 +-0.7271425000820525#1060 +-0.6549755184733097#1061 +-0.5762642379901035#1062 +-0.4917951157285321#1063 +-0.40241213923645325#1064 +-0.3090083936688921#1065 +-0.21251713837638628#1066 +-0.11390248208604994#1067 +-0.014149749845864671#1068 +0.08574436201749502#1069 +0.18478174455889376#1070 +0.28197284898938413#1071 +0.37634657392060444#1072 +0.466959968288848#1073 +0.5529076530103934#1074 +0.63333086723003#1075 +0.7074260487756557#1076 +0.7744528630858774#1077 +0.8337416003882263#1078 +0.8846998672178285#1079 +0.926818505417086#1080 +0.9596766794756827#1081 +0.9829460813798933#1082 +0.9963942109577327#1083 +0.9998866989438198#1084 +0.9933886495526604#1085 +0.9769649891458017#1086 +0.9507798175090885#1087 +0.915094768221848#1088 +0.8702663945006491#1089 +0.8167426066374239#1090 +0.7550581966278896#1091 +0.6858294947067065#1092 +0.6097482111795045#1093 +0.5275745250821587#1094 +0.4401294887231446#1095 +0.3482868240002752#1096 +0.2529641924603128#1097 +0.15511402632813187#1098 +0.05571401211876051#1099 +-0.04424267808309759#1100 +-0.1437573100702344#1101 +-0.24183556653499838#1102 +-0.33749748195915497#1103 +-0.42978723410541103#1104 +-0.5177826942772574#1105 +-0.600604640924089#1106 +-0.6774255445323065#1107 +-0.7474778360266712#1108 +-0.8100615760667802#1109 +-0.864551448609587#1110 +-0.910403008860601#1111 +-0.9471581231863048#1112 +-0.9744495466339814#1113 +-0.9920045923218871#1114 +-0.9996478560364346#1115 +-0.9973029688131155#1116 +-0.9849933599899484#1117 +-0.9628420231092787#1118 +-0.9310702870069596#1119 +-0.8899956043677858#1120 +-0.840028379843203#1121 +-0.7816678694236923#1122 +-0.7154971920379454#1123 +-0.6421775032212828#1124 +-0.5624413890680937#1125 +-0.4770855464737418#1126 +-0.3869628228025392#1127 +-0.29297369451879685#1128 +-0.19605726992365072#1129 +-0.0971819058953447#1130 +0.0026644676126004055#1131 +0.1024842186409163#1132 +0.20127998123335095#1133 +0.29806462078761803#1134 +0.3918710971780397#1135 +0.48176212710082145#1136 +0.5668395490989988#1137 +0.6462532976948229#1138 +0.7192098969630194#1139 +0.7849803886799459#1140 +0.8429076158332012#1141 +0.8924127887172654#1142 +0.9330012680089154#1143 +0.9642675070398367#1144 +0.9858991038848767#1145 +0.9976799227788151#1146 +0.9994922536734847#1147 +0.9913179883576629#1148 +0.9732388013883325#1149 +0.9454353340255065#1150 +0.9081853893244696#1151 +0.8618611564194799#1152 +0.8069254917329687#1153 +0.743927294267167#1154 +0.6734960211867176#1155 +0.5963353984907568#1156 +0.5132163896153517#1157 +0.42496949222169395#1158 +0.3324764401379949#1159 +0.2366613933665366#1160 +0.13848170418241593#1161 +0.038918351586070044#1162 +-0.06103386031462717#1163 +-0.16037624205817258#1164 +-0.2581161974044102#1165 +-0.35327714102805435#1166 +-0.4449082562364434#1167 +-0.5320939952156349#1168 +-0.6139632268815225#1169 +-0.6896979409336707#1170 +-0.7585414211438385#1171 +-0.819805806214395#1172 +-0.8728789626610285#1173 +-0.9172306010481774#1174 +-0.9524175744657799#1175 +-0.9780883063067141#1176 +-0.9939863031040413#1177 +-0.9999527173289418#1178 +-0.9959279345427144#1179 +-0.9819521690445431#1180 +-0.9581650620635117#1181 +-0.9248042865096023#1182 +-0.8822031722245435#1183 +-0.8307873754602152#1184 +-0.771070625862084#1185 +-0.7036495934524011#1186 +-0.629197926900574#1187 +-0.5484595226483394#1188 +-0.46224109214241743#1189 +-0.37140410144039926#1190 +-0.27685616372666233#1191 +-0.1795419707414492#1192 +-0.08043385373327268#1193 +0.019477931753509533#1194 +0.1191951001847589#1195 +0.217721310575624#1196 +0.31407212160031445#1197 +0.40728482780441533#1198 +0.49642807863955946#1199 +0.5806111842102433#1200 +0.6589930147528394#1201 +0.730790404926155#1202 +0.7952859789406399#1203 +0.851835318340144#1204 +0.8998734008181136#1205 +0.938920245733708#1206 +0.9685857099197014#1207 +0.988573385864046#1208 +0.9986835633157533#1209 +0.9988152247237061#1210 +0.9889670545706377#1211 +0.9692374525173453#1212 +0.9398235502258059#1213 +0.9010192416847732#1214 +0.8532122467181903#1215 +0.7968802370168715#1216 +0.7325860634008656#1217 +0.6609721320001158#1218 +0.5827539855447597#1219 +0.4987131538986974#1220 +0.409689345271531#1221 +0.3165720561317042#1222 +0.22029168365181864#1223 +0.12181022948763352#1224 +0.022111687775516597#1225 +-0.07780778661170105#1226 +-0.17694983131492942#1227 +-0.27432385179549673#1228 +-0.36895691902833305#1229 +-0.45990349068718106#1230 +-0.5462548586909652#1231 +-0.6271482287145591#1232 +-0.70177534094448#1233 +-0.7693905459437702#1234 +-0.8293182549346921#1235 +-0.8809596900584754#1236 +-0.9237988671657521#1237 +-0.9574077513596155#1238 +-0.9814505337788207#1239 +-0.9956869868889223#1240 +-0.9999748647563899#1241 +-0.9942713243229557#1242 +-0.9786333534792907#1243 +-0.953217201660839#1244 +-0.9182768186551078#1245 +-0.8741613172193351#1246 +-0.8213114848612212#1247 +-0.7602553796358565#1248 +-0.6916030539641876#1249 +-0.616040459190884#1250 +-0.5343225917852477#1251 +-0.4472659496660599#1252 +-0.35574037402427566#1253 +-0.2606603581573747#1254 +-0.1629759101546243#1255 +-0.06366306073028243#1256 +0.03628588895266636#1257 +0.1358722820277203#1258 +0.2341010841741585#1259 +0.3299908256710588#1260 +0.42258340791831867#1261 +0.510953676441162#1262 +0.5942186647278355#1263 +0.6715464165391247#1264 +0.7421642985400877#1265 +0.805366720196939#1266 +0.8605221838044265#1267 +0.9070795942021564#1268 +0.9445737651352686#1269 +0.9726300672417244#1270 +0.9909681712250566#1271 +0.9994048488120352#1272 +0.9978558035090056#1273 +0.9863365128645896#1274 +0.9649620738231349#1275 +0.9339460527140935#1276 +0.8935983513678535#1277 +0.8443221106790897#1278 +0.7866096825562044#1279 +0.7210377105038093#1280 +0.6482613679914285#1281 +0.5690078121768063#1282 +0.48406891839188965#1283 +0.3942933679863122#1284 +0.3005781685838748#1285 +0.20385969147888025#1286 +0.10510431572368364#1287 +0.005298772388643717#1288 +-0.09455971452856225#1289 +-0.1934733920354848#1290 +-0.2904539473629896#1291 +-0.38453238285975366#1292 +-0.4747686978964897#1293 +-0.5602612810415106#1294 +-0.6401559186641225#1295 +-0.7136543299548559#1296 +-0.7800221430834386#1297 +-0.8385962327993722#1298 +-0.8887913461602351#1299 +-0.9301059501856239#1300 +-0.9621272430089094#1301 +-0.9845352784570335#1302 +-0.9971061628469102#1303 +-0.9997142920570979#1304 +-0.9923336065226613#1305 +-0.9750378516137301#1306 +-0.9479998407961381#1307 +-0.9114897289363962#1308 +-0.8658723130035688#1309 +-0.8116033871385435#1310 +-0.749225188509642#1311 +-0.6793609794580729#1312 +-0.6027088200666426#1313 +-0.5200345933741548#1314 +-0.43216435292525485#1315 +-0.3399760691164684#1316 +-0.24439085680621755#1317 +-0.14636377183963595#1318 +-0.04687426844626337#1319 +0.05308358714285112#1320 +0.15251104907633528#1321 +0.25041467102089904#1322 +0.3458162323487072#1323 +0.43776251219453577#1324 +0.5253348137235645#1325 +0.6076581434464698#1326 +0.6839099538651353#1327 +0.753328362095355#1328 +0.8152197623487677#1329 +0.8689657562126182#1330 +0.9140293314822825#1331 +0.9499602278097037#1332 +0.9763994355559533#1333 +0.9930827828968712#1334 +0.9998435753406082#1335 +0.9966142612838874#1336 +0.9834271069652942#1337 +0.9604138740716864#1338 +0.9278045032189735#1339 +0.8859248164614908#1340 +0.8351932617857352#1341 +0.7761167321164042#1342 +0.7092855006098496#1343 +0.6353673228398167#1344 +0.5551007648044826#1345 +0.4692878234191396#1346 +0.37878591322812316#1347 +0.28449929940210755#1348 +0.1873700626194315#1349 +0.08836868610737038#1350 +-0.011515641105471527#1351 +-0.11128490783895244#1352 +-0.2099422525592064#1353 +-0.306501923689571#1354 +-0.3999991289144955#1355 +-0.4894996750654395#1356 +-0.57410930227021#1357 +-0.6529826191020013#1358 +-0.7253315494510825#1359 +-0.7904332067207822#1360 +-0.8476371166714086#1361 +-0.8963717167438338#1362 +-0.9361500669236509#1363 +-0.9665747150848376#1364 +-0.9873416682000192#1365 +-0.9982434297383107#1366 +-0.9991710729020646#1367 +-0.9901153289874269#1368 +-0.9711666799941617#1369 +-0.9425144545594192#1370 +-0.9044449362485765#1371 +-0.857338503104486#1372 +-0.8016658270358069#1373 +-0.7379831710188773#1374 +-0.6669268311019312#1375 +-0.5892067787453151#1376 +-0.5055995670213429#1377 +-0.41694057155269054#1378 +-0.3241156437153132#1379 +-0.2280522595043203#1380 +-0.12971025250041487#1381 +-0.03007222353003439#1382 +0.06986627715730269#1383 +0.1691066970980048#1384 +0.2666574588205459#1385 +0.36154386735978916#1386 +0.45281784908688705#1387 +0.5395674245475895#1388 +0.6209258206594904#1389 +0.6960801312221501#1390 +0.7642794392071385#1391 +0.8248423196727637#1392 +0.8771636483368399#1393 +0.9207206477784876#1394 +0.9550781108573155#1395 +0.9798927491593076#1396 +0.9949166230211789#1397 +0.9999996188615343#1398 +0.9950909490661519#1399 +0.9802396594410367#1400 +0.9555941391629392#1401 +0.9214006381237522#1402 +0.8780008064829905#1403 +0.8258282810123316#1404 +0.7654043523403342#1405 +0.6973327563887936#1406 +0.6222936420429795#1407 +0.5410367753288019#1408 +0.4543740479985197#1409 +0.36317136537672806#1410 +0.2683399945205851#1411 +0.1708274591406018#1412 +0.07160807225693622#1413 +-0.028326798814238986#1414 +-0.1279786378752571#1415 +-0.226351756690739#1416 +-0.32246324357531025#1417 +-0.415352784322254#1418 +-0.5040922573456266#1419 +-0.5877950071643484#1420 +-0.6656247035706814#1421 +-0.7368036979652107#1422 +-0.8006207933645937#1423 +-0.8564383504467267#1424 +-0.9036986586320765#1425 +-0.941929508543436#1426 +-0.9707489101659298#1427 +-0.9898689095649735#1428 +-0.9990984660268033#1429 +-0.9983453608741385#1430 +-0.987617118884721#1431 +-0.9670209331062237#1432 +-0.9367625938187515#1433 +-0.8971444323463876#1434 +-0.848562300262541#1435 +-0.7915016141718754#1436 +-0.7265325055880536#1437 +-0.6543041243681132#1438 +-0.5755381526216753#1439 +-0.4910215939018614#1440 +-0.40159890972594#1441 +-0.30816358199498733#1442 +-0.211649185618078#1443 +-0.1130200605403922#1444 +-0.013261676377251867#1445 +0.08662921407252257#1446 +0.1856545340510954#1447 +0.2828248552946596#1448 +0.37716928407358735#1449 +0.46774516204164157#1450 +0.5536474849665701#1451 +0.6340179452332398#1452 +0.7080535077696084#1453 +0.7750144337077156#1454 +0.8342316716099273#1455 +0.8851135424097409#1456 +0.9271516512734351#1457 +0.9599259673131953#1458 +0.9831090203969006#1459 +0.9964691731214373#1460 +0.999872935257061#1461 +0.9932862975376467#1462 +0.9767750714700341#1463 +0.9505042317672048#1464 +0.9147362679754845#1465 +0.8698285617657631#1466 +0.816229816093974#1467 +0.7544755719094801#1468 +0.6851828572069336#1469 +0.609044021886516#1470 +0.5268198200225961#1471 +0.43933180866049054#1472 +0.34745413909003786#1473 +0.2521048226148663#1474 +0.15423655808690193#1475 +0.05482721285436108#1476 +-0.04512994776555348#1477 +-0.14463618486537203#1478 +-0.24269726501638209#1479 +-0.3383333943203984#1480 +-0.4305890081865166#1481 +-0.518542319016638#1482 +-0.6013145264024473#1483 +-0.6780785978085996#1484 +-0.748067532008433#1485 +-0.8105820227066887#1486 +-0.8649974457768529#1487 +-0.910770100298956#1488 +-0.9474426410394413#1489 +-0.97464864809356#1490 +-0.9921162880319376#1491 +-0.9996710299703442#1492 +-0.9972373894245966#1493 +-0.9848396825265736#1494 +-0.962601783065463#1495 +-0.930745884781808#1496 +-0.8895902812810987#1497 +-0.8395461857492807#1498 +-0.7811136222465291#1499 +-0.7148764296321258#1500 +-0.6414964280395691#1501 +-0.5617068061885679#1502 +-0.4763047956057153#1503 +-0.38614370495060346#1504 +-0.292124394037764#1505 +-0.19518627274318584#1506 +-0.09629791473136161#1507 +0.0035526202125998304#1508 +0.10336765854973708#1509 +0.20214988141145054#1510 +0.2989122894799676#1511 +0.3926880647592674#1512 +0.4825402307009092#1513 +0.5675710141639814#1514 +0.6469308156675612#1515 +0.7198266983078874#1516 +0.7855303105217932#1517 +0.843385163534764#1518 +0.892813190779766#1519 +0.9333205237473006#1520 +0.9645024265563005#1521 +0.9860473399412646#1522 +0.9977399942494521#1523 +0.9994635603440932#1524 +0.9912008169225054#1525 +0.9730343225856573#1526 +0.9451455909399181#1527 +0.9078132769731031#1528 +0.8614103928259461#1529 +0.8064005807780915#1530 +0.7433334806876951#1531 +0.6728392381716484#1532 +0.5956222083988731#1533 +0.5124539184063026#1534 +0.42416535825576057#1535 +0.3316386780559536#1536 +0.23579837381018381#1537 +0.13760205015788235#1538 +0.03803085230559389#1539 +-0.06192033725160367#1540 +-0.16125283926712547#1541 +-0.2589741562157922#1542 +-0.35410788900102547#1543 +-0.44570349281186655#1544 +-0.5328457746525187#1545 +-0.6146640376482388#1546 +-0.6903407807606958#1547 +-0.7591198669881154#1548 +-0.8203140784362564#1549 +-0.8733119827724461#1550 +-0.9175840424553352#1551 +-0.9526879056989698#1552 +-0.9782728263056137#1553 +-0.9940831682058159#1554 +-0.9999609596895136#1555 +-0.9958474718071414#1556 +-0.9817838051698816#1557 +-0.9579104792859435#1558 +-0.9244660285360871#1559 +-0.8817846188169394#1560 +-0.8302927086658156#1561 +-0.7705047882279834#1562 +-0.7030182386411985#1563 +-0.6285073632008448#1564 +-0.5477166499443011#1565 +-0.4614533329725679#1566 +-0.370579326833965#1567 +-0.2760026145588766#1568 +-0.17866817539345065#1569 +-0.07954854287934016#1570 +0.02036591237996836#1571 +0.12007687817485184#1572 +0.21858807549515108#1573 +0.3149152130207141#1574 +0.408095821834904#1575 +0.49719887209586344#1576 +0.5813340755789376#1577 +0.6596607811423243#1578 +0.7313963742354008#1579 +0.7958240965246156#1580 +0.8523002075058284#1581 +0.9002604165466352#1582 +0.9392255210918378#1583 +0.9688061946969714#1584 +0.9887068770494445#1585 +0.998728727109482#1586 +0.9987716098640673#1587 +0.9888350968428918#1588 +0.9690184703994884#1589 +0.9395197317147739#1590 +0.9006336224346992#1591 +0.8527486797091522#1592 +0.7963433540571888#1593 +0.7319812288476018#1594 +0.6603053891601949#1595 +0.5820319962922426#1596 +0.49794313211153723#1597 +0.4088789847528897#1598 +0.31572945373601446#1599 +0.21942525838369095#1600 +0.12092863838194484#1601 +0.021223739399179705#1602 +-0.07869322017202651#1603 +-0.1778239030997941#1604 +-0.275177828368556#1605 +-0.369782267737956#1606 +-0.46069196492188513#1607 +-0.5469985802768322#1608 +-0.6278397666313447#1609 +-0.7024077855739117#1610 +-0.7699575781081692#1611 +-0.8298142090361076#1612 +-0.8813796106874666#1613 +-0.9241385586142015#1614 +-0.9576638195428573#1615 +-0.9816204201482128#1616 +-0.9957689939960187#1617 +-0.9999681732132844#1618 +-0.994176000989335#1619 +-0.9784503507943949#1620 +-0.9529483481270028#1621 +-0.91792480056797#1622 +-0.8737296518272608#1623 +-0.8208044852221184#1624 +-0.7596781115225273#1625 +-0.6909612852488008#1626 +-0.6153406022143034#1627 +-0.5335716392870412#1628 +-0.4464714049153578#1629 +-0.35491017584958534#1630 +-0.2598028016244306#1631 +-0.16209956368483314#1632 +-0.06277668048788872#1633 +0.03717344654927897#1634 +0.13675214879643402#1635 +0.2349644687770656#1636 +0.33082910145460404#1637 +0.42338819910797#1638 +0.511716941829381#1639 +0.5949327780191651#1640 +0.6722042425496124#1641 +0.742759264489685#1642 +0.8058928813825473#1643 +0.8609742829974049#1644 +0.9074531141768128#1645 +0.9448649738034854#1646 +0.9728360549427497#1647 +0.9910868797978722#1648 +0.9994350921598212#1649 +0.9977972794502282#1650 +0.9861898061522987#1651 +0.9647286503023048#1652 +0.9336282446753849#1653 +0.8931993342441357#1654 +0.8438458713175653#1655 +0.78606097938315#1656 +0.7204220259799529#1657 +0.6475848538330251#1658 +0.5682772278896909#1659 +0.48329156373276017#1660 +0.3934770100259633#1661 +0.2997309641011942#1662 +0.20299010546101035#1663 +0.10422103678666807#1664 +0.0044106259636479345#1665 +-0.09544385437604187#1666 +-0.19434469127235002#1667 +-0.29130370025527885#1668 +-0.3853520989574582#1669 +-0.47555018686732337#1670 +-0.5609967345060028#1671 +-0.6408379882143644#1672 +-0.714276200577364#1673 +-0.7805776012525157#1674 +-0.8390797285606031#1675 +-0.8891980485837959#1676 +-0.9304317956353363#1677 +-0.9623689757447501#1678 +-0.9846904831654123#1679 +-0.9971732887736847#1680 +-0.9996926685021967#1681 +-0.9922234495414972#1682 +-0.9748402618584459#1683 +-0.9477167925182539#1684 +-0.9111240502607415#1685 +-0.8654276576705933#1686 +-0.8110841979973509#1687 +-0.7486366531265098#1688 +-0.6787089782840057#1689 +-0.6019998676818485#1690 +-0.5192757733965142#1691 +-0.43136324723315195#1692 +-0.3391406820931682#1693 +-0.24352953536271474#1694 +-0.14548512201507893#1695 +-0.04598706941925612#1696 +0.053970470772899765#1697 +0.1533887558613586#1698 +0.25127443120483245#1699 +0.34664945549199166#1700 +0.4385608730069506#1701 +0.5260903352477752#1702 +0.6083632767611484#1703 +0.6845576535112877#1704 +0.753912156472218#1705 +0.8157338183759043#1706 +0.8694049376121297#1707 +0.9143892500987989#1708 +0.9502372874553822#1709 +0.976590867942398#1710 +0.9931866752949559#1711 +0.9998588896918333#1712 +0.996540844572318#1713 +0.9832656927464438#1714 +0.9601660751430733#1715 +0.9274727955055809#1716 +0.8855125142771431#1717 +0.8347044847175692#1718 +0.775556363863317#1719 +0.7086591401861929#1720 +0.6346812286318964#1721 +0.5543617920388316#1722 +0.4685033556673605#1723 +0.3779637886326811#1724 +0.2836477323602019#1725 +0.18649756170745438#1726 +0.08748396906602378#1727 +-0.012403734475959032#1728 +-0.11216750400318758#1729 +-0.21081053290806362#1730 +-0.30734721265281995#1731 +-0.40081298064423065#1732 +-0.49027395782420097#1733 +-0.5748362796806161#1734 +-0.6536550274460741#1735 +-0.7259426702469165#1736 +-0.7909769338513953#1737 +-0.848108017395044#1738 +-0.8967650859761198#1739 +-0.9364619742492493#1740 +-0.966802044028854#1741 +-0.9874821473667896#1742 +-0.9982956555064372#1743 +-0.9991345234489356#1744 +-0.9899903695030964#1745 +-0.970954559032491#1746 +-0.9422172915629393#1747 +-0.9040657003717193#1748 +-0.8568809835467744#1749 +-0.8011345951814257#1750 +-0.7373835347609137#1751 +-0.666264781807661#1752 +-0.5884889313924426#1753 +-0.5048330941033291#1754 +-0.41613313141356995#1755 +-0.32327530403005167#1756 +-0.2271874166692736#1757 +-0.12882954773931182#1758 +-0.029184456553725577#1759 +0.07075223607464673#1760 +0.16998199574774103#1761 +0.26751335150790145#1762 +0.3623718022879524#1763 +0.45360955380373474#1764 +0.5403149886012937#1765 +0.6216217746371384#1766 +0.6967175213816488#1767 +0.7648518969567075#1768 +0.8253441252037987#1769 +0.8775897877743497#1770 +0.9210668632780755#1771 +0.9553409431481533#1772 +0.9800695721080259#1773 +0.9950056698713242#1774 +0.9999999998864149#1775 +0.995002660458693#1776 +0.9800635833518199#1777 +0.9553320348860447#1778 +0.9210551245184746#1779 +0.8775753358070623#1780 +0.8253271044281046#1781 +0.7648324774385712#1782 +0.6966958971544762#1783 +0.6215981617630594#1784 +0.5402896230123407#1785 +0.4535826889444879#1786 +0.36234370658320497#1787 +0.26748430568064796#1788 +0.1699522900142862#1789 +0.0707221672448598#1790 +-0.029214588042036787#1791 +-0.12885944082227627#1792 +-0.22721677266508764#1793 +-0.32330382962330895#1794 +-0.4161605415859719#1795 +-0.5048591149814937#1796 +-0.5885133029843566#1797 +-0.6662872606004342#1798 +-0.7374038961538791#1799 +-0.8011526357302755#1800 +-0.8568965229963079#1801 +-0.9040785834568934#1802 +-0.9422273895602254#1803 +-0.9709617710460383#1804 +-0.9899946234728495#1805 +-0.9991357768706348#1806 +-0.9982938958563073#1807 +-0.9874773922266732#1808 +-0.966794340910539#1809 +-0.9364514001197477#1810 +-0.8967517464886383#1811 +-0.848092045833332#1812 +-0.790958489798018#1813 +-0.7259219379887585#1814 +-0.6536322141330055#1815 +-0.5748116132557202#1816 +-0.49024768474624164#1817 +-0.4007853634251181#1818 +-0.30731852723467856#1819 +-0.21078106590610934#1820 +-0.11213754984196339#1821 +-0.012373592447542393#1822 +0.08751399779244858#1823 +0.18652717709477906#1824 +0.2836766385012659#1825 +0.37799169670687793#1826 +0.46852998682643804#1827 +0.5543868801930514#1828 +0.6347045231087146#1829 +0.7086804082348972#1830 +0.7755753929805951#1831 +0.8347210847707713#1832 +0.8855265194040249#1833 +0.9274840657715442#1834 +0.960174497939346#1835 +0.9832711839152297#1836 +0.9965433492476736#1837 +0.9998583828478708#1838 +0.9931831619958922#1839 +0.9765843832919562#1840 +0.9502278962460459#1841 +0.9143770461644276#1842 +0.8693900428904013#1843 +0.8157163816899551#1844 +0.7538923520436499#1845 +0.6845356792194047#1846 +0.6083393521658111#1847 +0.5260646993956318#1848 +0.43853378204296184#1849 +0.3466211801001145#1850 +0.25124525390343583#1851 +0.1533589681803935#1852 +0.05394037034102778#1853 +-0.04601718184846958#1854 +-0.145514945568195#1855 +-0.24355877205264906#1856 +-0.3391690397965793#1857 +-0.4313904426092411#1858 +-0.5193015347180733#1859 +-0.6020239375502678#1860 +-0.6787311162011166#1861 +-0.7486566378975624#1862 +-0.8111018299411188#1863 +-0.8654427606145227#1864 +-0.9111364733012091#1865 +-0.9477264115283458#1866 +-0.9748469807281929#1867 +-0.9922272011381739#1868 +-0.9996934153410891#1869 +-0.9971710233926254#1870 +-0.98468522819934#1871 +-0.9623607836995489#1872 +-0.9304207483632138#1873 +-0.8891842564654433#1874 +-0.8390633294023081#1875 +-0.7805587589092471#1876 +-0.7142551033155872#1877 +-0.6408148468309454#1878 +-0.5609717802219951#1879 +-0.47552366901768395#1880 +-0.3853242824997751#1881 +-0.29127486312240225#1882 +-0.1943151215953794#1883 +-0.09541384760541509#1884 +0.0044407700101977065#1885 +0.10425101691979201#1886 +0.20301962212912839#1887 +0.2997597223835154#1888 +0.39350472257923697#1889 +0.48331795366231456#1890 +0.5683020315160732#1891 +0.6476078233265996#1892 +0.7204429318371323#1893 +0.7860796127195201#1894 +0.8438620459549884#1895 +0.8932128885709812#1896 +0.9336390432612995#1897 +0.9647365852513876#1898 +0.9861947981811614#1899 +0.9977992786801687#1900 +0.9994340786151946#1901 +0.9910828636056814#1902 +0.9728290762314595#1903 +0.9448551023020723#1904 +0.9074404485180556#1905 +0.8609589497323792#1906 +0.8058750337161689#1907 +0.7427390807499367#1908 +0.6721819244057498#1909 +0.5949085484667043#1910 +0.5116910429620009#1911 +0.42336088969859254#1912 +0.3308006543698204#1913 +0.23493516825074362#1914 +0.1367222875897472#1915 +0.03714332302553373#1916 +-0.06280676534440063#1917 +-0.16212930927617017#1918 +-0.25983191074247675#1919 +-0.35493835764565523#1920 +-0.4464983778062608#1921 +-0.5335971337685674#1922 +-0.6153643635540208#1923 +-0.6909830760312574#1924 +-0.7596977140214278#1925 +-0.8208217035757736#1926 +-0.8737443139955725#1927 +-0.9179367600513992#1928 +-0.9529574854303443#1929 +-0.9784565746207341#1930 +-0.9941792491522566#1931 +-0.999968413258218#1932 +-0.9957662235245147#1933 +-0.9816146668419067#1934 +-0.9576551408868839#1935 +-0.9241270413228225#1936 +-0.8813653698376505#1937 +-0.8297973869177182#1938 +-0.7699383428022528#1939 +-0.7023863292732867#1940 +-0.6278163037202744#1941 +-0.5469733451889683#1942 +-0.4606652097978839#1943 +-0.36975425990617233#1944 +-0.27514884767398695#1945 +-0.1777942391079601#1946 +-0.07866316927572836#1947 +0.021253876941319732#1948 +0.12095856144556782#1949 +0.21945466798743643#1950 +0.3157580560288433#1951 +0.40890649395014667#1952 +0.49796927335041663#1953 +0.5820565083781266#1954 +0.6603280271764242#1955 +0.7320017666026011#1956 +0.7963615863444993#1957 +0.8527644243577857#1958 +0.9006467221293312#1959 +0.9395300555675856#1960 +0.9690259152579552#1961 +0.9888395883204489#1962 +0.9987731030833557#1963 +0.998727207150748#1964 +0.9887023590996133#1965 +0.9687987238979044#1966 +0.9392151720892897#1967 +0.9002472927444187#1968 +0.8522844400326369#1969 +0.7958058429238293#1970 +0.731375816890965#1971 +0.6596381254564291#1972 +0.5813095479197075#1973 +0.49717271753556175#1974 +0.40806830170125163#1975 +0.3148866022857897#1976 +0.2185586600279604#1977 +0.12004695188501968#1978 +0.020335774281090385#1979 +-0.07957859165734228#1980 +-0.17869783461311994#1981 +-0.27603158787509413#1982 +-0.37060732475493247#1983 +-0.46148007575231387#1984 +-0.5477418703778104#1985 +-0.6285308092938824#1986 +-0.7030396761281532#1987 +-0.7705240029125717#1988 +-0.8303095085612607#1989 +-0.8817988360642393#1990 +-0.9244775210812064#1991 +-0.9579191322991703#1992 +-0.9817895321931679#1993 +-0.9958502156179638#1994 +-0.9999606928726213#1995 +-0.9940798934271551#1996 +-0.9782665762856902#1997 +-0.9526787428859168#1998 +-0.9175720584009519#1999 +-0.8732972972174424#2000 +-0.8202968381138436#2001 +-0.759100244157896#2002 +-0.6903189714875031#2003 +-0.6146402598431213#2004 +-0.5328202658954452#2005 +-0.44567650797790564#2006 +-0.3540796977137181#2007 +-0.25894504015316233#2008 +-0.16122308934724644#2009 +-0.0618902507258409#2010 +0.03806097482262027#2011 +0.13763190769193942#2012 +0.23582766803466082#2013 +0.33166711627264295#2014 +0.4241926563194016#2015 +0.5124798035636668#2016 +0.5956464220140248#2017 +0.6728615383101487#2018 +0.7433536445339318#2019 +0.8064184068615782#2020 +0.8614257030343491#2021 +0.9078259183318809#2022 +0.9451554371407925#2023 +0.9730412752486439#2024 +0.9912048065788938#2025 +0.9994645471305557#2026 +0.9977379683063444#2027 +0.9860423215111407#2028 +0.9644944657816552#2029 +0.9333097001695628#2030 +0.8927996125445465#2031 +0.8433689663113009#2032 +0.7855116561473892#2033 +0.7198057731708851#2034 +0.6469078288450127#2035 +0.5675461953326192#2036 +0.48251382784229224#2037 +0.3926603416820314#2038 +0.29888352318393624#2039 +0.20212035931994485#2040 +0.1033376756377367#2041 +0.003522476059450432#2042 +-0.09632791893524607#2043 +-0.19521583720571825#2044 +-0.29215322336060745#2045 +-0.38617151108069375#2046 +-0.47633130071339214#2047 +-0.5617317454435568#2048 +-0.6415195522570779#2049 +-0.7148975077626172#2050 +-0.7811324436842906#2051 +-0.8395625624367278#2052 +-0.8896040495877838#2053 +-0.9307569071393618#2054 +-0.9626099493421324#2055 +-0.9848449111276216#2056 +-0.9972396281075698#2057 +-0.9996702563670624#2058 +-0.9921125098719891#2059 +-0.97464190312707#2060 +-0.9474329966598855#2061 +-0.9107576528697868#2062 +-0.864982319668668#2063 +-0.8105643690545611#2064 +-0.7480475272018192#2065 +-0.6780564417289145#2066 +-0.6012904404259155#2067 +-0.5185165438023752#2068 +-0.4305618012719435#2069 +-0.338305027548012#2070 +-0.24266802181759525#2071 +-0.1446063574285605#2072 +-0.04509983411660629#2073 +0.054857311829817915#2074 +0.15426634164985503#2075 +0.2521339931777998#2076 +0.34748240519032947#2077 +0.43935888787260957#2078 +0.5268454417800063#2079 +0.6090679301850868#2080 +0.6852048131628486#2081 +0.7544953561460856#2082 +0.8162472309337178#2083 +0.8698434332053228#2084 +0.9147484474243518#2085 +0.9505135975323528#2086 +0.9767815299718332#2087 +0.993289784244882#2088 +0.9998734153317062#2089 +0.9964666417667453#2090 +0.9831035029053308#2091 +0.9599175188136995#2092 +0.9271403561806276#2093 +0.8850995135804554#2094 +0.8342150492155885#2095 +0.7749953838337934#2096 +0.7080322207561459#2097 +0.633994633773039#2098 +0.5536223819800354#2099 +0.4677185183495166#2100 +0.37714136589083663#2101 +0.2827959415705366#2102 +0.18562491368197392#2103 +0.08659918301533971#2104 +-0.013291818062099673#2105 +-0.11305001168715346#2106 +-0.21167864696479485#2107 +-0.308192259173622#2108 +-0.4016265162036029#2109 +-0.49104785384375327#2110 +-0.5755628036471371#2111 +-0.6543269201722473#2112 +-0.7265532184027201#2113 +-0.7915200370414769#2114 +-0.8485782491118543#2115 +-0.8971577478197825#2116 +-0.9367731428724192#2117 +-0.967028610337507#2118 +-0.9876218475852627#2119 +-0.9983470937963259#2120 +-0.9990971858558507#2121 +-0.9898646290919259#2122 +-0.970741672159859#2123 +-0.9419193853241061#2124 +-0.9036857513473486#2125 +-0.8564227880619233#2126 +-0.8006027313739196#2127 +-0.7367833168381062#2128 +-0.6656022069486314#2129 +-0.5877706198261639#2130 +-0.5040662229615295#2131 +-0.4153253630192043#2132 +-0.32243470933790386#2133 +-0.22632239462364384#2134 +-0.1279487413545418#2135 +-0.02829666655605602#2136 +0.07163813918102345#2137 +0.17085716031182666#2138 +0.26836903317466254#2139 +0.3631994513690255#2140 +0.45440090070308614#2141 +0.5410621264422896#2142 +0.6223172382654424#2143 +0.6973543619545768#2144 +0.7654237513737662#2145 +0.8258452796846828#2146 +0.8780152349491458#2147 +0.9214123522192472#2148 +0.9556030218444039#2149 +0.9802456219556541#2150 +0.995093931838447#2151 +0.9999995920886321#2152 +0.9949135869705855#2153 +0.9798867341662368#2154 +0.9550691770215901#2155 +0.9207088843640407#2156 +0.8771491728798204#2157 +0.824825276807153#2158 +0.7642599992196163#2159 +0.6960584883506457#2160 +0.6209021911524217#2161 +0.5395420445031802#2162 +0.4527909720941514#2163 +0.3615157619647542#2164 +0.2666284058430285#2165 +0.16907698682575256#2166 +0.06983620644553508#2167 +-0.030102354224705447#2168 +-0.1297401421220481#2169 +-0.22808160940569652#2170 +-0.3241441606419197#2171 +-0.41696797057282303#2172 +-0.5056255743730492#2173 +-0.5892311345717338#2174 +-0.6669492920476956#2175 +-0.7380035126616422#2176 +-0.8016838461286017#2177 +-0.8573540196064917#2178 +-0.9044577951240342#2179 +-0.9425245273266959#2180 +-0.9711738660094966#2181 +-0.99011955645053#2182 +-0.9991722995735218#2183 +-0.9982416433616265#2184 +-0.9873368866240788#2185 +-0.9665669860855675#2186 +-0.9361394677266565#2187 +-0.896358353252788#2188 +-0.8476211224098967#2189 +-0.7904147414981781#2190 +-0.7253107977657867#2191 +-0.6529597882979938#2192 +-0.5740846204653375#2193 +-0.48947338887213754#2194 +-0.3999715009757185#2195 +-0.3064732300545506#2196 +-0.2099127799252589#2197 +-0.11125495068689388#2198 +-0.01148549875726277#2199 +0.08839871247934979#2200 +0.18739967300159813#2201 +0.28452819793731066#2202 +0.3788138111717516#2203 +0.4693144420241625#2204 +0.5551258381065974#2205 +0.6353906003148769#2206 +0.709306749677019#2207 +0.7761357404620275#2208 +0.8352098394847063#2209 +0.8859387978749215#2210 +0.9278157486492024#2211 +0.9604222711580919#2212 +0.9834325718069646#2213 +0.9966167392779312#2214 +0.999843041727728#2215 +0.9930792430087505#2216 +0.9763929247619841#2217 +0.9499508111635871#2218 +0.9140171030720339#2219 +0.8689508382204706#2220 +0.8152023038303673#2221 +0.7533085374904468#2222 +0.6838879612546183#2223 +0.6076342025732385#2224 +0.5253091637969104#2225 +0.43773540950004725#2226 +0.34578794768754867#2227 +0.2503854870040551#2228 +0.15248125730085532#2229 +0.05305348527830788#2230 +-0.046904379631989734#2231 +-0.1463935914855311#2232 +-0.24442008696423675#2233 +-0.3400044177285349#2234 +-0.43219153674140776#2235 +-0.5200603407826888#2236 +-0.6027328738079627#2237 +-0.6793830991951469#2238 +-0.7492451532293688#2239 +-0.8116209973600432#2240 +-0.8658873927713292#2241 +-0.9115021275783626#2242 +-0.9480094344291783#2243 +-0.9750445443814343#2244 +-0.9923373315531067#2245 +-0.9997150121310117#2246 +-0.9971038707695518#2247 +-0.9845299971300822#2248 +-0.9621190252016383#2249 +-0.9300948780076469#2250 +-0.8887775302410945#2251 +-0.8385798111831653#2252 +-0.780003279849526#2253 +-0.7136332135784356#2254 +-0.6401327601330475#2255 +-0.5602363117481685#2256 +-0.4747421673258055#2257 +-0.3845045560964199#2258 +-0.2904251024428272#2259 +-0.19344381716740122#2260 +-0.09452970521486317#2261 +0.005328916304815557#2262 +0.10513429305428211#2263 +0.2038892027003272#2264 +0.3006069188298006#2265 +0.3943210699937632#2266 +0.4840952953715645#2267 +0.569032600578643#2268 +0.64828432013791#2269 +0.7210585970646649#2270 +0.7866282948398333#2271 +0.8443382627177061#2272 +0.8936118817756269#2273 +0.9339568262996617#2274 +0.9649699829403923#2275 +0.9863414784882509#2276 +0.9978577760242008#2277 +0.9994038085100443#2278 +0.9909641285002334#2279 +0.9726230624876389#2280 +0.9445638683411081#2281 +0.9070669042534167#2282 +0.8605068274948806#2283 +0.8053488509617559#2284 +0.7421440949227586#2285 +0.6715240804075154#2286 +0.5941944192571897#2287 +0.5109277638842079#2288 +0.42255608718475995#2289 +0.3299623697406341#2290 +0.23407177736911827#2291 +0.135842417171973#2292 +0.03625576444597857#2293 +-0.0636931438937977#2294 +-0.16300565139394135#2295 +-0.26068946030786144#2296 +-0.3557685463068644#2297 +-0.44729291059261544#2298 +-0.534348071971104#2299 +-0.6160642040464467#2300 +-0.6916248262387088#2301 +-0.7602749617879662#2302 +-0.8213286812325286#2303 +-0.8741759559893822#2304 +-0.9182887535581434#2305 +-0.9532263134472572#2306 +-0.9786395511071335#2307 +-0.9942745458675742#2308 +-0.9999750780291754#2309 +-0.9956841897589236#2310 +-0.9814447541940361#2311 +-0.9573990470677456#2312 +-0.9237873251372041#2313 +-0.8809454256173832#2314 +-0.8293014106066361#2315 +-0.7693712900317081#2316 +-0.7017538658471201#2317 +-0.6271247490039753#2318 +-0.5462296089686645#2319 +-0.45987672324004214#2320 +-0.3689289013078397#2321 +-0.2742948637454506#2322 +-0.17692016257434437#2323 +-0.07777773362082588#2324 +0.022141824737131294#2325 +0.12184014930142922#2326 +0.2203210873689061#2327 +0.3166006499598618#2328 +0.4097168435106797#2329 +0.4987392817955214#2330 +0.5827784820379505#2331 +0.6609947523288111#2332 +0.7326065815502183#2333 +0.7968984479763155#2334 +0.8532279685298386#2335 +0.901032317261481#2336 +0.9398338489207327#2337 +0.9692448714293358#2338 +0.9889715195723757#2339 +0.9988166912023702#2340 +0.9986820166187732#2341 +0.9885688414455068#2342 +0.968578213185931#2343 +0.9389098715895922#2344 +0.8998602529186711#2345 +0.8518195280548398#2346 +0.7952677040407854#2347 +0.7307698280085084#2348 +0.6589703414151602#2349 +0.5805866409970266#2350 +0.49640191077847906#2351 +0.407257296756089#2352 +0.31404350244587664#2353 +0.21769188926820557#2354 +0.1191651706923382#2355 +0.019447793121681437#2356 +-0.08046390036926145#2357 +-0.17957162516554395#2358 +-0.27688512964165996#2359 +-0.37143208942845196#2360 +-0.4622678225568002#2361 +-0.5484847284075876#2362 +-0.6292213561570731#2363 +-0.7036710121087649#2364 +-0.7710898199101781#2365 +-0.8308041531194559#2366 +-0.8822173658581055#2367 +-0.9248157542993909#2368 +-0.9581736894271621#2369 +-0.9819578697802895#2370 +-0.9959306516906896#2371 +-0.9999524237403014#2372 +-0.993983001712226#2373 +-0.9780820300981395#2374 +-0.9524083861502476#2375 +-0.917218592432299#2376 +-0.8728642537309242#2377 +-0.8197885439368322#2378 +-0.7585217779977886#2379 +-0.6896761131869558#2380 +-0.6139394326297725#2381 +-0.532068472203148#2382 +-0.44488125948072355#2383 +-0.35324894027176074#2384 +-0.2580870744201778#2385 +-0.16034648783323305#2386 +-0.061003772143360675#2387 +0.03894847307260204#2388 +0.13851155802027681#2389 +0.23669068126604687#2390 +0.33250486946414387#2391 +0.4249967789180523#2392 +0.5132422610422692#2393 +0.5963595961494876#2394 +0.6735183033022544#2395 +0.7439474382039768#2396 +0.8069432962194937#2397 +0.861876443559176#2398 +0.9081980063732902#2399 +0.9454451549180705#2400 +0.9732457279975278#2401 +0.9913219514750999#2402 +0.9994932137010042#2403 +0.9976778701241392#2404 +0.9858940590574525#2405 +0.9642595204459123#2406 +0.9329904194478973#2407 +0.8923991865843892#2408 +0.8428913960364823#2409 +0.7849617132822316#2410 +0.7191889525627104#2411 +0.6462302935614438#2412 +0.5668147150822461#2413 +0.4817357113339816#2414 +0.39184336359872296#2415 +0.2980358465005815#2416 +0.20125045374175918#2417 +0.1024542329737048#2418 +0.0026343233766439834#2419 +-0.09721190750880472#2420 +-0.19608682914840989#2421 +-0.29300251600885235#2422 +-0.3869906185830895#2423 +-0.47711203881853564#2424 +-0.5624663132743792#2425 +-0.6422006102546296#2426 +-0.7155182510205144#2427 +-0.7816866699410908#2428 +-0.840044734046876#2429 +-0.890009348851936#2430 +-0.9310812844412447#2431 +-0.9628501636109706#2432 +-0.9849985622218451#2433 +-0.9973051807962356#2434 +-0.999647055669374#2435 +-0.9920007876016487#2436 +-0.9744427755760723#2437 +-0.9471484534448972#2438 +-0.9103905370525548#2439 +-0.8645362993490856#2440 +-0.8100439007202268#2441 +-0.7474578112002859#2442 +-0.6774033703075353#2443 +-0.6005805388584559#2444 +-0.5177569051906351#2445 +-0.42976001567382827#2446 +-0.33746910614018294#2447 +-0.2418063168504405#2448 +-0.14372747877327008#2449 +-0.0442125632381852#2450 +0.05574410961404525#2451 +0.155143805749565#2452 +0.2529933562617591#2453 +0.34831508078667095#2454 +0.44015655616202054#2455 +0.5276001327246129#2456 +0.6097721031624384#2457 +0.6858514323093241#2458 +0.7550779606569172#2459 +0.8167599996172166#2460 +0.8702812426463021#2461 +0.9151069231755982#2462 +0.9507891578226558#2463 +0.9769714214938605#2464 +0.9933921096653152#2465 +0.9998871522487686#2466 +0.9963916529257024#2467 +0.9829405375698944#2468 +0.959668205279632#2469 +0.9268071855063493#2470 +0.8846858146972121#2471 +0.8337249556658711#2472 +0.774433792470347#2473 +0.7074047428142367#2474 +0.633307538804846#2475 +0.5528825352113574#2476 +0.4669333120847054#2477 +0.3763186456513355#2478 +0.28194392770502347#2479 +0.18475211923135468#2480 +0.08571432865325745#2481 +-0.014179891163352991#2482 +-0.11393243019470806#2483 +-0.212546594044612#2484 +-0.3090370625853853#2485 +-0.402439734950877#2486 +-0.49182136251362973#2487 +-0.5762888735966745#2488 +-0.6549982967505166#2489 +-0.7271631934368789#2490 +-0.7920625158626148#2491 +-0.8490478114509101#2492 +-0.8975497019650812#2493 +-0.9370835725477036#2494 +-0.9672544138320761#2495 +-0.9877607687452395#2496 +-0.9983977445674013#2497 +-0.9990590601522629#2498 +-0.9897381078531023#2499 +-0.9705280195441958#2500 +-0.9416207360779147#2501 +-0.9033050894751768#2502 +-0.8559639170113676#2503 +-0.8000702360328346#2504 +-0.7361825177239204#2505 +-0.664939107047496#2506 +-0.5870518446130994#2507 +-0.5032989542008693#2508 +-0.4145172670067797#2509 +-0.32159386030194986#2510 +-0.22545719404978#2511 +-0.12706783404090483#2512 +-0.027408854237334586#2513 +0.07252398577761245#2514 +0.17173219009991203#2515 +0.26922450314584817#2516 +0.36402681395014#2517 +0.4551918891607088#2518 +0.5418088374812179#2519 +0.6230122109958052#2520 +0.6979906524385796#2521 +0.7659950020072227#2522 +0.8263457827200938#2523 +0.8784399895256259#2524 +0.9217571143294733#2525 +0.9558643467393337#2526 +0.9804208985633203#2527 +0.9951814088529242#2528 +0.9999983954685079#2529 +0.9948237286720926#2530 +0.9797091120237905#2531 +0.9548055657769237#2532 +0.9203619179335726#2533 +0.8767223180374318#2534 +0.8243227985453299#2535 +0.7636869181350534#2536 +0.6954205304801045#2537 +0.620205730760064#2538 +0.5387940403910272#2539 +0.45199889807203436#2540 +0.3606875321744773#2541 +0.26577229568287974#2542 +0.16820155026545985#2543 +0.068950190557828#2544 +-0.03099009666195487#2545 +-0.13062074107985552#2546 +-0.2289462662303628#2547 +-0.32498423596827036#2548 +-0.41777507064588915#2549 +-0.5063916349156925#2550 +-0.5899485013602381#2551 +-0.6676107973902402#2552 +-0.738602547015509#2553 +-0.8022144241405411#2554 +-0.8578108399163944#2555 +-0.9048362933343682#2556 +-0.9428209216084585#2557 +-0.9713851948889993#2558 +-0.9902437083994649#2559 +-0.9992080341066545#2560 +-0.9981886034313139#2561 +-0.9871956021877676#2562 +-0.966338868810637#2563 +-0.9358267968855071#2564 +-0.8959642529491038#2565 +-0.8471495303636348#2566 +-0.7898703697011723#2567 +-0.7246990854010827#2568 +-0.6522868473933305#2569 +-0.5733571748237859#2570 +-0.48869870689008327#2571 +-0.39915732301944756#2572 +-0.30562769112106847#2573 +-0.20904432836008902#2574 +-0.11037226377100239#2575 +-0.010597396006535125#2576 +0.0892833574357961#2577 +0.18827202108378255#2578 +0.2853795329315549#2579 +0.37963562682020546#2580 +0.4700985270165206#2581 +0.5558643581247975#2582 +0.6360761763110162#2583 +0.7099325316023618#2584 +0.7766954757104277#2585 +0.8356979353665813#2586 +0.8863503774975581#2587 +0.9281466996450561#2588 +0.9606692867742049#2589 +0.9835931839449478#2590 +0.9966893431543875#2591 +0.9998269119087179#2592 +0.992974540658088#2593 +0.9762006960309414#2594 +0.9496729767380968#2595 +0.9136564389818304#2596 +0.8685109481019182#2597 +0.8146875829201173#2598 +0.7527241287096857#2599 +0.6832397038226994#2600 +0.6069285736641322#2601 +0.5245532138214233#2602 +0.43693669166044735#2603 +0.34495444250846585#2604 +0.2495255225937167#2605 +0.15160342613938146#2606 +0.052166558364490814#2607 +-0.047791540417606526#2608 +-0.14727212192563383#2609 +-0.24528120907307063#2610 +-0.3408395274586362#2611 +-0.4329922899524019#2612 +-0.520818736613183#2613 +-0.6034413346175079#2614 +-0.6800345462775168#2615 +-0.7498330775406523#2616 +-0.8121395245548596#2617 +-0.8663313418973455#2618 +-0.911867062842657#2619 +-0.9482917095192162#2620 +-0.9752413388978184#2621 +-0.9924466791900753#2622 +-0.9997358203231163#2623 +-0.9970359316082094#2624 +-0.9843739894409296#2625 +-0.9618765077619307#2626 +-0.9297682739714707#2627 +-0.888370102928013#2628 +-0.8380956314722081#2629 +-0.7794471855043118#2630 +-0.713010760909837#2631 +-0.6394501684823696#2632 +-0.5595004013455463#2633 +-0.4739602911447193#2634 +-0.38368452638521455#2635 +-0.28957511266730906#2636 +-0.19257236014443638#2637 +-0.0936454882549586#2638 +0.006217058398080305#2639 +0.10601748625869184#2640 +0.2047586224413277#2641 +0.3014538781527306#2642 +0.3951371063610338#2643 +0.48487225521753735#2644 +0.5697627207773633#2645 +0.6489603055696946#2646 +0.7216736935065267#2647 +0.7871763564514449#2648 +0.8448138134486051#2649 +0.8940101700801013#2650 +0.934273872612625#2651 +0.9652026194398814#2652 +0.986487380747257#2653 +0.9979154862355749#2654 +0.9993727500524254#2655 +0.9908446116994578#2656 +0.9724162815160672#2657 +0.9442718892858502#2658 +0.9066926444726718#2659 +0.860054026468659#2660 +0.8048220329282305#2661 +0.7415485236735729#2662 +0.6708657066937176#2663 +0.5934798213312947#2664 +0.5101640817724733#2665 +0.42175095134640345#2666 +0.32912382482680763#2667 +0.23320820184341287#2668 +0.13496243959558005#2669 +0.035368177263958724#2670 +-0.06457947220371922#2671 +-0.16388186493227264#2672 +-0.26154680423856425#2673 +-0.3565984543327818#2674 +-0.4480870905470817#2675 +-0.5350985886705324#2676 +-0.6167635585760615#2677 +-0.6922660308792223#2678 +-0.7608516098345607#2679 +-0.8218350110085325#2680 +-0.8746069084150397#2681 +-0.918640022699266#2682 +-0.9534943895386959#2683 +-0.9788217556211913#2684 +-0.9943690582769701#2685 +-0.9999809539971505#2686 +-0.9956013705747425#2687 +-0.9812740673596052#2688 +-0.9571421980294875#2689 +-0.9234468802458005#2690 +-0.8805247864856478#2691 +-0.8288047801217232#2692 +-0.7688036303612542#2693 +-0.7011208488589045#2694 +-0.6264326995944929#2695 +-0.54548544186685#2696 +-0.4590878739175849#2697 +-0.3681032516864081#2698 +-0.2734406634431365#2699 +-0.17604594647820584#2700 +-0.07689223660911715#2701 +0.023029755070976092#2702 +0.12272164105102494#2703 +0.22118733296007248#2704 +0.31744299415299343#2705 +0.4105268698810389#2706 +0.4995088968273724#2707 +0.5834999959922931#2708 +0.6616609560767109#2709 +0.7332108186040404#2710 +0.797434680999148#2711 +0.8536908396585681#2712 +0.9014172016407891#2713 +0.9401369009131222#2714 +0.9694630630394689#2715 +0.9891026707018031#2716 +0.9988594914323538#2717 +0.9986360383035573#2718 +0.988434543985213#2719 +0.9683569384363839#2720 +0.9386038304549402#2721 +0.8994725032607627#2722 +0.8513539441400785#2723 +0.7947289378297411#2724 +0.730163262675065#2725 +0.6583020375596216#2726 +0.5798632760906015#2727 +0.4956307124441966#2728 +0.4064459705527783#2729 +0.31320015487677#2730 +0.2168249467834381#2731 +0.11828329549464342#2732 +0.018559796616524828#2733 +-0.08134914561433308#2734 +-0.18044527407266456#2735 +-0.2777384529997385#2736 +-0.37225656111256417#2737 +-0.4630552047184104#2738 +-0.5492271537844082#2739 +-0.6299114066801492#2740 +-0.7043017930213666#2741 +-0.7716550286579311#2742 +-0.8312981423233815#2743 +-0.8826351997413644#2744 +-0.9251532580039342#2745 +-0.9584274907275325#2746 +-0.9821254327777841#2747 +-0.9960103021512207#2748 +-0.9999433658227904#2749 +-0.9938853259203851#2750 +-0.9778967123761879#2751 +-0.9521372781315993#2752 +-0.9168644029386548#2753 +-0.8724305217066197#2754 +-0.8192796030888767#2755 +-0.7579427134948966#2756 +-0.6890327108502228#2757 +-0.6132381211226626#2758 +-0.531316258798414#2759 +-0.4440856600460539#2760 +-0.3524179041737139#2761 +-0.2572289050967394#2762 +-0.15946975982860834#2763 +-0.06011724543396326#2764 +0.039835940604938974#2765 +0.13939109909332772#2766 +0.23755350779614662#2767 +0.3333423603738149#2768 +0.425800566274961#2769 +0.5140043136688397#2770 +0.5970722998677733#2771 +0.6741745370122875#2772 +0.7445406450354447#2773 +0.8074675490458203#2774 +0.862326504219411#2775 +0.908569378010082#2776 +0.9457341269087781#2777 +0.9734494130295364#2778 +0.9914383143948933#2779 +0.9995210918487465#2780 +0.997616984950588#2781 +0.9857450189071303#2782 +0.9640238144787292#2783 +0.932670402759958#2784 +0.8919980566766509#2785 +0.8424131608663822#2786 +0.7844111512175009#2787 +0.7185715646375037#2788 +0.6455522485118246#2789 +0.5660827877102146#2790 +0.4809572148158928#2791 +0.39102607641444626#2792 +0.29718793471350063#2793 +0.20038038940616668#2794 +0.10157070948483571#2795 +0.001746168609144461#2796 +-0.09809581940608277#2797 +-0.1969576664199707#2798 +-0.2938515775365379#2799 +-0.38780942082477593#2800 +-0.4778924005728819#2801 +-0.5632004374246865#2802 +-0.6428811616750538#2803 +-0.7161384298662196#2804 +-0.7822402795900505#2805 +-0.8405262430144722#2806 +-0.8904139460597256#2807 +-0.9314049272876644#2808 +-0.9630896183636759#2809 +-0.9851514363280947#2810 +-0.9973699467884874#2811 +-0.9996230664272368#2812 +-0.9918882828176945#2813 +-0.9742428793609076#2814 +-0.9468631630954215#2815 +-0.9100227030956302#2816 +-0.8640895970600148#2817 +-0.8095227934006172#2818 +-0.746867505582215#2819 +-0.6767497645296058#2820 +-0.5998701635335436#2821 +-0.5169968581541643#2822 +-0.4289578910645463#2823 +-0.33663291852203614#2824 +-0.24094442113370063#2825 +-0.14284848673503256#2826 +-0.04332525747633915#2827 +0.056630863433631995#2828 +0.15602114747584864#2829 +0.25385251978622037#2830 +0.34914748163137366#2831 +0.44095387725287755#2832 +0.5283544074928413#2833 +0.610475795143881#2834 +0.6864975104463086#2835 +0.7556599695502599#2836 +0.8172721240264376#2837 +0.8707183655935856#2838 +0.9154646770729435#2839 +0.9510639681113735#2840 +0.9771605423603803#2841 +0.9934936514764484#2842 +0.9999001004322978#2843 +0.9963158781076524#2844 +0.9827767968671937#2845 +0.9594181347352508#2846 +0.9264732837424994#2847 +0.8842714179499392#2848 +0.8332342044504877#2849 +0.7738715902107717#2850 +0.7067767068496035#2851 +0.6326199442629082#2852 +0.5521422523094861#2853 +0.4661477374849479#2854 +0.3754956285554135#2855 +0.281091691427704#2856 +0.1838791790358073#2857 +0.08482940666935936#2858 +-0.015067953087655503#2859 +-0.11481475883822152#2860 +-0.21341437347118883#2861 +-0.3098816222298437#2862 +-0.4032526362524221#2863 +-0.4925944832311636#2864 +-0.5770144889635445#2865 +-0.6556691566578302#2866 +-0.7277725948741954#2867 +-0.7926043698922097#2868 +-0.8495167040464284#2869 +-0.8979409481066987#2870 +-0.9373932630332972#2871 +-0.9674794543366784#2872 +-0.9878989107385114#2873 +-0.9984476077802041#2874 +-0.9990201463678514#2875 +-0.9896108058851415#2876 +-0.9703136013518633#2877 +-0.9413213440569057#2878 +-0.902923715051594#2879 +-0.8555043707523807#2880 +-0.7995371095727526#2881 +-0.7355811378860999#2882 +-0.6642754826204825#2883 +-0.5863326063127988#2884 +-0.5025312884186264#2885 +-0.41370884400533103#2886 +-0.3207527575766946#2887 +-0.22459181562111544#2888 +-0.12618682648403282#2889 +-0.026521020288540302#2890 +0.07340977517499168#2891 +0.17260708443102024#2892 +0.27007976075572954#2893 +0.3648538893874657#2894 +0.4559825185611017#2895 +0.5425551211370541#2896 +0.623706692287481#2897 +0.6986263923385901#2898 +0.7665656484126308#2899 +0.8268456339206427#2900 +0.878864051173344#2901 +0.9221011493405477#2902 +0.9561249176296516#2903 +0.9805954017946731#2904 +0.995268100846702#2905 +0.9999964100269597#2906 +0.9947330856330885#2907 +0.979530717062608#2908 +0.9545412013570396#2909 +0.920014225496878#2910 +0.876294771611817#2911 +0.8238196700333464#2912 +0.7631132346304763#2913 +0.6947820240388727#2914 +0.6195087811274721#2915 +0.5380456112574195#2916 +0.45120646749391313#2917 +0.35985901785623386#2918 +0.26491597586570953#2919 +0.16732598101391277#2920 +0.06806412027043987#2921 +-0.03187781466376874#2922 +-0.13150123701126137#2923 +-0.22981074246706656#2924 +-0.3258240549494714#2925 +-0.41858184117793273#2926 +-0.507157296014103#2927 +-0.5906654027924112#2928 +-0.6682717761140383#2929 +-0.7392009987500107#2930 +-0.8027443693538329#2931 +-0.8582669835710771#2932 +-0.9052140777938206#2933 +-0.9431165721752354#2934 +-0.9715957575203611#2935 +-0.9903670792231963#2936 +-0.9992429804422601#2937 +-0.9981347761065544#2938 +-0.987053539027478#2939 +-0.9661099892629551#2940 +-0.9355133878392158#2941 +-0.8955694458837944#2942 +-0.8466772700609979#2943 +-0.7893253748300435#2944 +-0.724086801370063#2945 +-0.6516133919420634#2946 +-0.5726292768965259#2947 +-0.4879236394023083#2948 +-0.3983428301892924#2949 +-0.3047819110916564#2950 +-0.2081757118858963#2951 +-0.1094894897807127#2952 +-0.009709284886053158#2953 +0.090167931973725#2954 +0.18914422066277686#2955 +0.28623064282173216#2956 +0.38045714301288247#2957 +0.47088224119345734#2958 +0.5566024396729995#2959 +0.6367612505636312#2960 +0.7105577535239129#2961 +0.7772545982901459#2962 +0.8361853720364713#2963 +0.8867612579515394#2964 +0.9284769185014516#2965 +0.9609155445953574#2966 +0.9837530202041103#2967 +0.9967611608204933#2968 +0.9998099934033869#2969 +0.9928690550254331#2970 +0.9760076972485352#2971 +0.9493943931859762#2972 +0.9132950541747605#2973 +0.8680703728774336#2974 +0.8141722193602262#2975 +0.7521391261567218#2976 +0.6825909074287959#2977 +0.6062224659883935#2978 +0.523796850058337#2979 +0.4361376291467138#2980 +0.3441206652125872#2981 +0.24866536134282327#2982 +0.1507254753803607#2983 +0.05127959029111491#2984 +-0.04867866351354105#2985 +-0.1481505362033963#2986 +-0.2461421377075628#2987 +-0.3416743683355274#2988 +-0.43379270161761196#2989 +-0.521576721617934#2990 +-0.6041493194261889#2991 +-0.6806854569399482#2992 +-0.7504204103726574#2993 +-0.8126574111209275#2994 +-0.8667746076460986#2995 +-0.9122312788092578#2996 +-0.9485732365781204#2997 +-0.9754373641237138#2998 +-0.9925552439637022#2999 +-0.9997558399011433#3000 +-0.9969672059616304#3001 +-0.9842172052536875#3002 +-0.9616332315697985#3003 +-0.9294409365097438#3004 +-0.8879619748444056#3005 +-0.8376107906476223#3006 +-0.778890476308#3007 +-0.712387745796065#3008 +-0.6387670724122129#3009 +-0.5587640495891363#3010 +-0.4731780410854005#3011 +-0.38286419400700217#3012 +-0.2887248944601604#3013 +-0.1917007512076325#3014 +-0.09276119741688045#3015 +0.007105195595686342#3016 +0.10690059584252641#3017 +0.20562788067234633#3018 +0.30230059969002754#3019 +0.39595283104289725#3020 +0.48564883259258895#3021 +0.5704923915411738#3022 +0.649635779093189#3023 +0.7222882206815403#3024 +0.7877237971255806#3025 +0.8452886977756067#3026 +0.8944077531727492#3027 +0.9345901819520811#3028 +0.9654344945677839#3029 +0.9866325048439754#3030 +0.9979724092691066#3031 +0.9993409032666355#3032 +0.9907243132969028#3033 +0.9722087334786201#3034 +0.9439791653648948#3035 +0.9063176694688648#3036 +0.8596005470082881#3037 +0.8042945800281633#3038 +0.7409523674688342#3039 +0.670206803780042#3040 +0.5927647552487915#3041 +0.5093999972250692#3042 +0.42094548281432353#3043 +0.32828502028537193#3044 +0.23234444235032745#3045 +0.13408235555017892#3046 +0.0344805621751064#3047 +-0.06546574957946144#3048 +-0.16475794920433068#3049 +-0.26240394186248667#3050 +-0.3574280810727624#3051 +-0.4488809170469727#3052 +-0.5358486832783511#3053 +-0.6174624265944348#3054 +-0.6929066894499258#3055 +-0.7614276577089293#3056 +-0.8223406925066218#3057 +-0.8750371709344767#3058 +-0.9189905671991826#3059 +-0.9537617134943233#3060 +-0.9790031880199306#3061 +-0.9944627863062665#3062 +-0.9999860411575177#3063 +-0.9955177660369557#3064 +-0.9811026064725701#3065 +-0.9568845939737097#3066 +-0.9231057069158529#3067 +-0.8801034527726663#3068 +-0.8283074958528935#3069 +-0.7682353642366102#3070 +-0.7004872788057198#3071 +-0.6257401560353084#3072 +-0.5447408444679848#3073 +-0.45829866245011713#3074 +-0.36727731169044214#3075 +-0.27258624743809257#3076 +-0.17517159150637399#3077 +-0.07600667893635255#3078 +0.0239176672451336#3079 +0.12360303600163591#3080 +0.22205340408014085#3081 +0.3182850879461725#3082 +0.41133657242450644#3083 +0.5002781178409661#3084 +0.5842210496739159#3085 +0.6623266378963246#3086 +0.7338144772889486#3087 +0.7979702849913142#3088 +0.8541530373799495#3089 +0.901801374964536#3090 +0.9404392113063745#3091 +0.969680489916708#3092 +0.9892330416055432#3093 +0.9989015037396196#3094 +0.9985892722412621#3095 +0.9882994668243924#3096 +0.9681348998233783#3097 +0.9382970489261745#3098 +0.8990840440758637#3099 +0.8508876886548145#3100 +0.7941895447147971#3101 +0.7295561213681458#3102 +0.6576332144159718#3103 +0.5791394537699889#3104 +0.49485912313998487#3105 +0.40563432373024166#3106 +0.31235656024266445#3107 +0.21595783325649234#3108 +0.11740132698658906#3109 +0.017671785465154324#3110 +-0.08223432669513268#3111 +-0.18131878064613588#3112 +-0.2785915572769423#3113 +-0.37308073915756135#3114 +-0.4638422216166124#3115 +-0.5499691459231215#3116 +-0.6306009603191937#3117 +-0.704932018368717#3118 +-0.7722196287102416#3119 +-0.8317914757835613#3120 +-0.8830523373845538#3121 +-0.9254900319286898#3122 +-0.9586805360001208#3123 +-0.9822922210534869#3124 +-0.9960891669367201#3125 +-0.9999335191272192#3126 +-0.9937868661286703#3127 +-0.9777106232660219#3128 +-0.951865419043858#3129 +-0.9165094901994781#3130 +-0.8719961014867792#3131 +-0.8187700159716086#3132 +-0.7573630511062297#3133 +-0.6883887649851336#3134 +-0.6125363258753749#3135 +-0.530563626275056#3136 +-0.4432897103020118#3137 +-0.3515865900757242#3138 +-0.2563705328604733#3139 +-0.1585929060257105#3140 +-0.05923067129778288#3141 +0.040723376718695616#3142 +0.14027053021635935#3143 +0.23841614694337318#3144 +0.3341795883400279#3145 +0.4266040177550728#3146 +0.5147659608412467#3147 +0.597784532605696#3148 +0.6748302389216413#3149 +0.7451332645594977#3150 +0.807991164926182#3151 +0.8627758846592893#3152 +0.908940032948667#3153 +0.9460223528844458#3154 +0.9736523301836125#3155 +0.99155389524625#3156 +0.9995481815517231#3157 +0.9975553128338268#3158 +0.985595201178036#3159 +0.9637873480665278#3160 +0.9323496503588747#3161 +0.8915962231386506#3162 +0.8419342611793482#3163 +0.783859970388803#3164 +0.7179536098837859#3165 +0.6448736942327173#3166 +0.5653504137957747#3167 +0.4801783389041825#3168 +0.3902084807761133#3169 +0.29633978849390213#3170 +0.19951016700196894#3171 +0.10068710587064418#3172 +8.58012460191664E-4#3173 +-0.09897965392714189#3174 +-0.19782834833075857#3175 +-0.2947004072712111#3176 +-0.3886279171572114#3177 +-0.4786723853582849#3178 +-0.5639341173129099#3179 +-0.6435612059791769#3180 +-0.7167580438083482#3181 +-0.7827932721924921#3182 +-0.8410070889579382#3183 +-0.8908178408904955#3184 +-0.931727835422099#3185 +-0.9633283134104351#3186 +-0.9853035333251733#3187 +-0.9974339260329675#3188 +-0.9995982886596559#3189 +-0.991774995609316#3190 +-0.9740422146400699#3191 +-0.9465771258376843#3192 +-0.9096541512907214#3193 +-0.8636422131557419#3194 +-0.8090010475090663#3195 +-0.7462766108158684#3196 +-0.6760956249136447#3197 +-0.5991593150147811#3198 +-0.5162364032960245#3199 +-0.4281554280805988#3200 +-0.33579646535715757#3201 +-0.24008233535141982#3202 +-0.14196938201151837#3203 +-0.04243791753539556#3204 +0.057517572584630666#3205 +0.1568983661321727#3206 +0.25471148306902575#3207 +0.34997960706347403#3208 +0.44175085051201957#3209 +0.5291082654856638#3210 +0.6111790055705121#3211 +0.6871430470606158#3212 +0.7562413823637792#3213 +0.8177836037545257#3214 +0.8711548016998724#3215 +0.9158217088321214#3216 +0.9513380281801238#3217 +0.9773488924210882#3218 +0.9935944095975676#3219 +0.9999122598719884#3220 +0.9962393173728123#3221 +0.9826122809273776#3222 +0.959167307379348#3223 +0.9261386511545373#3224 +0.8838563236681221#3225 +0.8327427959596674#3226 +0.7733087775021505#3227 +0.7061481133617248#3228 +0.6319318506941176#3229 +0.5514015338632693#3230 +0.4653617951751706#3231 +0.374672315257837#3232 +0.2802392334166466#3233 +0.18300609378993019#3234 +0.08394441776783579#3235 +-0.015956003128259934#3236 +-0.1156969969154514#3237 +-0.21428198455380562#3238 +-0.310725937434704#3239 +-0.40406521946109236#3240 +-0.4933672153808272#3241 +-0.5777396491699932#3242 +-0.6563394993599873#3243 +-0.7283814222293667#3244 +-0.7931455986987139#3245 +-0.8499849265249375#3246 +-0.8983314859329812#3247 +-0.9377022140824873#3248 +-0.9677037316720184#3249 +-0.9880362734550029#3250 +-0.9984966833949899#3251 +-0.9989804445336107#3252 +-0.9894827232894784#3253 +-0.9700984177537353#3254 +-0.941021209499695#3255 +-0.9025416283805849#3256 +-0.8550441496512888#3257 +-0.7990033524186914#3258 +-0.7349791778041159#3259 +-0.6636113341967335#3260 +-0.5856129054987965#3261 +-0.5017632262270028#3262 +-0.4129000946596174#3263 +-0.3199114018330162#3264 +-0.22372626002794793#3265 +-0.12530571938674848#3266 +-0.025633165417999926#3267 +0.07429550666640745#3268 +0.1734818426070331#3269 +0.27093480532180136#3270 +0.36568067702093243#3271 +0.4567727882732294#3272 +0.5433009768141075#3273 +0.6244006815860823#3274 +0.69926158114707#3275 +0.7671356901343803#3276 +0.8273448328872091#3277 +0.8792874195536663#3278 +0.9224444569777169#3279 +0.9563847343072394#3280 +0.9807691315103211#3281 +0.9953540077505189#3282 +0.9999936357655596#3283 +0.994641657925974#3284 +0.9793515494252069#3285 +0.9542760839731598#3286 +0.9196658073317829#3287 +0.8758665339446406#3288 +0.8233158916733028#3289 +0.7625389491644119#3290 +0.6941429695373308#3291 +0.6188113428117887#3292 +0.5372967577007027#3293 +0.4504136809933635#3294 +0.3590302196725045#3295 +0.264059447076288#3296 +0.16645027977133223#3297 +0.0671779962920478#3298 +-0.03276550752009386#3299 +-0.1323816292119314#3300 +-0.23067503742423134#3301 +-0.3266636169136169#3302 +-0.4193882815234355#3303 +-0.5079225570556044#3304 +-0.5913818382945464#3305 +-0.668932227690092#3306 +-0.7397988673861511#3307 +-0.8032736813442769#3308 +-0.8587224502053834#3309 +-0.9055911481999364#3310 +-0.9434114787903057#3311 +-0.9718055537349715#3312 +-0.9904896688229197#3313 +-0.9992771385523388#3314 +-0.9980801614304436#3315 +-0.9869106972569683#3316 +-0.9658803476258001#3317 +-0.9351992408387446#3318 +-0.8951739323729925#3319 +-0.8462043418801258#3320 +-0.7887797573211552#3321 +-0.7234739461629501#3322 +-0.6509394224833727#3323 +-0.5719009272663036#3324 +-0.4871481870292994#3325 +-0.3975280231372775#3326 +-0.30393589064335974#3327 +-0.20730693119798013#3328 +-0.10860662942263#3329 +-0.008821166106667043#3330 +0.09105243538514393#3331 +0.19001627104051966#3332 +0.2870815269266859#3333 +0.3812783590923355#3334 +0.47166558392780156#3335 +0.557340082160572#3336 +0.6374458225245284#3337 +0.711182414941391#3338 +0.777813107753807#3339 +0.836672149104373#3340 +0.8871714389081266#3341 +0.9288064049541939#3342 +0.9611610444245324#3343 +0.9839120804565766#3344 +0.9968321922187865#3345 +0.9997922862252552#3346 +0.9927627861951471#3347 +0.9758139285691194#3348 +0.9491150607300238#3349 +0.9129329489398365#3350 +0.867629112899349#3351 +0.813656213562821#3352 +0.751553530299355#3353 +0.6819415725917019#3354 +0.605515880110623#3355 +0.5230400731124144#3356 +0.4353382225977257#3357 +0.34328661646652237#3358 +0.24780500393905253#3359 +0.14984740572566616#3360 +0.05039258176723505#3361 +-0.04956574821064165#3362 +-0.14902883361665542#3363 +-0.2470028721795537#3364 +-0.34250893969192686#3365 +-0.4345927710972995#3366 +-0.5223342951911364#3367 +-0.6048568276681833#3368 +-0.6813358306622516#3369 +-0.7510071512560216#3370 +-0.8131746566443966#3371 +-0.8672171896633807#3372 +-0.9125947751871345#3373 +-0.9488540153809398#3374 +-0.9756326199024913#3375 +-0.9926630257872393#3376 +-0.9997750708490869#3377 +-0.9968976938847057#3378 +-0.9840596446935896#3379 +-0.9613891968195613#3380 +-0.9291128658839244#3381 +-0.8875531463162514#3382 +-0.8371252890966461#3383 +-0.7783331527052134#3384 +-0.7117641687346805#3385 +-0.6380834724681006#3386 +-0.5580272570669699#3387 +-0.4723954177725101#3388 +-0.38204355961682934#3389 +-0.28787444850026606#3390 +-0.19082899105292786#3391 +-0.09187683340666573#3392 +0.00799332718855293#3393 +0.10778362110074621#3394 +0.20649697669942857#3395 +0.3031470827657546#3396 +0.39676824338818645#3397 +0.48642502687682576#3398 +0.5712216122876458#3399 +0.6503107401692458#3400 +0.7229021780992223#3401 +0.7882706164253177#3402 +0.8457629153197103#3403 +0.8948046307362744#3404 +0.9349057540656031#3405 +0.9656656081390587#3406 +0.9867768506625949#3407 +0.9980285450793656#3408 +0.9993082681780738#3409 +0.9906032333885376#3410 +0.972000418540872#3411 +0.9436856968117622#3412 +0.9059419795411228#3413 +0.8591463894755079#3414 +0.8037664926822882#3415 +0.7403556267840615#3416 +0.6695473721920379#3417 +0.592049221580004#3418 +0.508635510851393#3419 +0.4201396822308988#3420 +0.32744595678526595#3421 +0.23148049957867578#3422 +0.1332021657375744#3423 +0.03359291988720454#3424 +-0.06635197531433547#3425 +-0.1656339035115813#3426 +-0.2632608724962278#3427 +-0.35825742586536535#3428 +-0.4496743894594147#3429 +-0.5365983551965742#3430 +-0.6181608075444406#3431 +-0.6935468014401158#3432 +-0.7620031049518906#3433 +-0.8228457253237202#3434 +-0.8754667432047455#3435 +-0.9193403867784948#3436 +-0.9540282851010776#3437 +-0.9791838481587489#3438 +-0.9945557298807602#3439 +-0.9999903395062136#3440 +-0.9954333762121745#3441 +-0.9809303716695452#3442 +-0.9566262351056599#3443 +-0.9227638054191856#3444 +-0.8796814248141186#3445 +-0.8278095581963233#3446 +-0.7676664921104855#3447 +-0.6998531561922808#3448 +-0.6250471188780957#3449 +-0.5439958173651854#3450 +-0.45750908946626917#3451 +-0.366451081977802#3452 +-0.27173161641083377#3453 +-0.17429709835521742#3454 +-0.07512106130779558#3455 +0.02480556055249268#3456 +0.12448433345136849#3457 +0.22291930003944738#3458 +0.3191269306688547#3459 +0.4121459504963556#3460 +0.5010469442238331#3461 +0.5849416425087233#3462 +0.6629917972576633#3463 +0.7344175571243525#3464 +0.7985052595264196#3465 +0.854614561326041#3466 +0.9021848369269034#3467 +0.9407407798598458#3468 +0.969897151887982#3469 +0.9893626321798219#3470 +0.9989427280907218#3471 +0.9985417184690987#3472 +0.9881636100705354#3473 +0.9679120975236041#3474 +0.9379895272474138#3475 +0.8986948756730775#3476 +0.8504207619700415#3477 +0.793649525125126#3478 +0.7289484045708101#3479 +0.6569638725163257#3480 +0.5784151746110389#3481 +0.49408714347967225#3482 +0.40482235693414975#3483 +0.3115127192146192#3484 +0.21509054937710928#3485 +0.11651926586970504#3486 +0.016783760373878607#3487 +-0.08311944290763014#3488 +-0.1821921441912403#3489 +-0.2794444417948066#3490 +-0.3739046229080092#3491 +-0.4646288726255491#3492 +-0.550710704233698#3493 +-0.6312900165258971#3494 +-0.7055616876497018#3495 +-0.7727836196181932#3496 +-0.8322841531077579#3497 +-0.8834687784560297#3498 +-0.9258260758059158#3499 +-0.9589328250437571#3500 +-0.9824582344748051#3501 +-0.9961672459844911#3502 +-0.9999228836614071#3503 +-0.9936876224153341#3504 +-0.9775237629155394#3505 +-0.9515928091030836#3506 +-0.9161538544968271#3507 +-0.8715609934166348#3508 +-0.8182597829899804#3509 +-0.7567827912924092#3510 +-0.6877442761033722#3511 +-0.6118340474455396#3512 +-0.5298105752310752#3513 +-0.4424934108809914#3514 +-0.35075499863825743#3515 +-0.2555119583933158#3516 +-0.15771592712113114#3517 +-0.05834405043910549#3518 +0.041610780708929006#3519 +0.14114985069081507#3520 +0.23927859802253518#3521 +0.3350165526978016#3522 +0.427407132720259#3523 +0.5155272019545877#3524 +0.5984962937976203#3525 +0.6754854085095959#3526 +0.7457252963055302#3527 +0.8085141434447857#3528 +0.8632245845219801#3529 +0.9093099708947372#3530 +0.9463098326162236#3531 +0.9738544792986461#3532 +0.9916686939374035#3533 +0.999574482788422#3534 +0.9974928538228081#3535 +0.9854446059890913#3536 +0.9635501213970051#3537 +0.9320281624992393#3538 +0.8911936862893262#3539 +0.841454697355472#3540 +0.7833081712335805#3541 +0.7173350887919758#3542 +0.6441946312626129#3543 +0.5646175939201048#3544 +0.4793990842169069#3545 +0.38939057733247995#3546 +0.2954914085147568#3547 +0.19863978721962608#3548 +0.09980342283217974#3549 +-3.01443655808235E-5#3550 +-0.0998634103708049#3551 +-0.19869887419005808#3552 +-0.2955490045395186#3553 +-0.38944610693113085#3554 +-0.47945199255605286#3555 +-0.5646673523571102#3556 +-0.6442407426276232#3557 +-0.7173770923554741#3558 +-0.783345647309845#3559 +-0.8414872714959365#3560 +-0.8912210330239467#3561 +-0.9320500085884833#3562 +-0.9635662485619702#3563 +-0.9854548530924759#3564 +-0.9974971184789425#3565 +-0.9995727223862718#3566 +-0.9916609260663253#3567 +-0.9738407815726398#3568 +-0.9462903418984395#3569 +-0.9092848819299848#3570 +-0.8631941479909019#3571 +-0.8084786634591391#3572 +-0.7456851273696038#3573 +-0.6754409519781194#3574 +-0.5984479938655606#3575 +-0.5154755412189004#3576 +-0.42735262735793816#3577 +-0.33495974730841055#3578 +-0.23922006018674727#3579 +-0.14109016529933546#3580 +-0.04155054411846003#3581 +0.05840423636446346#3582 +0.15777546102350673#3583 +0.2555702454296358#3584 +0.350811456423722#3585 +0.4425474753080707#3586 +0.5298617061058852#3587 +0.6118817338852807#3588 +0.6877880416409017#3589 +0.7568221986369429#3590 +0.8182944383963581#3591 +0.8715905506194918#3592 +0.9161780181703624#3593 +0.9516113378118588#3594 +0.9775364715268212#3595 +0.9936943839488795#3596 +0.9999236305582081#3597 +0.9961619707818016#3598 +0.9824469898807066#3599 +0.9589157234105169#3600 +0.9258032880074003#3601 +0.8834405321803889#3602 +0.8322507305824411#3603 +0.7727453547900252#3604 +0.7055189628481972#3605 +0.6312432586431493#3606 +0.5506603804590156#3607 +0.4645754857774538#3608 +0.3738487064102398#3609 +0.2793865543465253#3610 +0.1821328641846953#3611 +0.08305936264905144#3612 +-0.016844040582407176#3613 +-0.11657914372826583#3614 +-0.2151494266059326#3615 +-0.31157000753189684#3616 +-0.4048774839339524#3617 +-0.4941395583512405#3618 +-0.5784643536423021#3619 +-0.6570093243266599#3620 +-0.7289896750207507#3621 +-0.7936862018539796#3622 +-0.8504524785160569#3623 +-0.8987213151350112#3624 +-0.9380104254509017#3625 +-0.9679272456607052#3626 +-0.9881728567860709#3627 +-0.9985449713729435#3628 +-0.9989399546809362#3629 +-0.9893538601673995#3630 +-0.9698824689199713#3631 +-0.9407203326436097#3632 +-0.9021588297642675#3633 +-0.8545832540719774#3634 +-0.7984689649926625#3635 +-0.7343766379538854#3636 +-0.6629466623013117#3637 +-0.5848927427400513#3638 +-0.5009947682331652#3639 +-0.41209101960894357#3640 +-0.3190697937359677#3641 +-0.22286052795443187#3642 +-0.12442451344547048#3643 +-0.024745290327437247#3644 +0.07518117955184238#3645 +0.1743564639366335#3646 +0.27178963616835333#3647 +0.36650717619718665#3648 +0.45756269767262103#3649 +0.5440464039230273#3650 +0.6250941783432632#3651 +0.6998962183621539#3652 +0.7677051267220971#3653 +0.8278433792254051#3654 +0.8797100943321279#3655 +0.9227870369697753#3656 +0.9566437965668558#3657 +0.9809420875730321#3658 +0.9954391294965175#3659 +0.9999900726864973#3660 +0.9945494456229591#3661 +0.9791716092530895#3662 +0.9540102138346597#3663 +0.9193166637134389#3664 +0.8754376053740758#3665 +0.8228114638630091#3666 +0.7619640621903281#3667 +0.6935033674800697#3668 +0.6181134163636822#3669 +0.5365474803121163#3670 +0.44962053919628586#3671 +0.35820113827759426#3672 +0.26320270999078516#3673 +0.1655744472289955#3674 +0.0662918193221285#3675 +-0.033653174530243454#3676 +-0.13326191698696957#3677 +-0.2315391504196944#3678 +-0.3275029211980919#3679 +-0.4201943910459491#3680 +-0.508687417436272#3681 +-0.5920978073012736#3682 +-0.6695921515972314#3683 +-0.7403961524521645#3684 +-0.8038023596942209#3685 +-0.8591772394599432#3686 +-0.9059675042552137#3687 +-0.943705641221003#3688 +-0.9720145833673183#3689 +-0.9906114771019258#3690 +-0.9993105084099446#3691 +-0.9980247594460628#3692 +-0.9867670769889152#3693 +-0.9656499440803186#3694 +-0.9348843561318997#3695 +-0.894777712728688#3696 +-0.845730746194075#3697 +-0.788233517604903#3698 +-0.7228605202631786#3699 +-0.6502649395489006#3700 +-0.5711721265076578#3701 +-0.4863723503827509#3702 +-0.396712902506141#3703 +-0.3030896304435386#3704 +-0.20643798698165444#3705 +-0.10772368339317456#3706 +-0.00793304036894502#3707 +0.09193686697233655#3708 +0.19088817152911786#3709 +0.28793218457521963#3710 +0.3820992744107705#3711 +0.4724485546016347#3712 +0.558077285005646#3713 +0.6381298916537022#3714 +0.7118065153620489#3715 +0.778371003660846#3716 +0.837158266186306#3717 +0.8875809200437595#3718 +0.9291351587433763#3719 +0.9614057860680744#3720 +0.9840703645768764#3721 +0.996902437293236#3722 +0.9997737903882905#3723 +0.9926557342510572#3724 +0.9756193901455429#3725 +0.9488349795905833#3726 +0.9125701235626947#3727 +0.8671871685157403#3728 +0.8131395659349391#3729 +0.7509673415995165#3730 +0.6812916998236274#3731 +0.6048088165881917#3732 +0.5222828835806185#3733 +0.43453847264407314#3734 +0.3424522969281879#3735 +0.24694445106107385#3736 +0.1489692178679391#3737 +0.04950553349254367#3738 +-0.0504527938091558#3739 +-0.14990701347259025#3740 +-0.2478634118100764#3741 +-0.34334324086950585#3742 +-0.43539249776035166#3743 +-0.523091456735199#3744 +-0.6055638587853923#3745 +-0.6819856669313974#3746 +-0.7515932997279102#3747 +-0.8136912607172517#3748 +-0.8676590876000732#3749 +-0.9129575516895527#3750 +-0.9491340457061896#3751 +-0.9758271060801286#3752 +-0.9927700245756657#3753 +-0.9997935131517774#3754 +-0.9968273954322683#3755 +-0.9839013078849232#3756 +-0.961144403703719#3757 +-0.9287840623528019#3758 +-0.8871436176660437#3759 +-0.8366391272022538#3760 +-0.7777752151355816#3761 +-0.7111400302175752#3762 +-0.6373993691892722#3763 +-0.5572900243602457#3764 +-0.47161242182339913#3765 +-0.38122262386203104#3766 +-0.28702377545847707#3767 +-0.18995708036798664#3768 +-0.09099239692192086#3769 +0.008881452476101726#3770 +0.10866656133680092#3771 +0.20736590983701175#3772 +0.3039933267121866#3773 +0.3975833427536857#3774 +0.48720083745796805#3775 +0.5719503824415534#3776 +0.6509851882654402#3777 +0.7235155652752691#3778 +0.7888168139193128#3779 +0.8462364657068425#3780 +0.8952008024576104#3781 +0.9352205887042604#3782 +0.9658959599713982#3783 +0.9869204180892522#3784 +0.9980838936220705#3785 +0.9992748448124834#3786 +0.9904813720698726#3787 +0.9717913368671467#3788 +0.943391483857947#3789 +0.9055655749857984#3790 +0.8586915542285684#3791 +0.8032377713071723#3792 +0.7397583020899774#3793 +0.6688874124498796#3794 +0.5913332208893615#3795 +0.5078706232544888#3796 +0.41933355023176294#3797 +0.326606634988362#3798 +0.23061637420995554#3799 +0.13232187085208025#3800 +0.032705251100445504#3801 +-0.06723814870926637#3802 +-0.1665097271630519#3803 +-0.2641175954638214#3804 +-0.3590864880563847#3805 +-0.45046750715849865#3806 +-0.5373476038338433#3807 +-0.61885870087518#3808 +-0.6941863663448576#3809 +-0.7625779511095188#3810 +-0.8233501090614465#3811 +-0.8758956248869896#3812 +-0.9196894811612573#3813 +-0.954294104148681#3814 +-0.9793637358951378#3815 +-0.9946478889271355#3816 +-0.9999938490398477#3817 +-0.9953482011669674#3818 +-0.9807573630863935#3819 +-0.9563671216291374#3820 +-0.9224211760254981#3821 +-0.8792587029429098#3822 +-0.8273109675447968#3823 +-0.7670970144316195#3824 +-0.6992184815187981#3825 +-0.624353588669538#3826 +-0.5432503611461462#3827 +-0.45671915558887405#3828 +-0.3656245632002365#3829 +-0.27087677103551244#3830 +-0.17342246771455624#3831 +-0.07423538442204156#3832 +0.025693434292662947#3833 +0.12536553270503523#3834 +0.22378502015495372#3835 +0.31996852165697554#3836 +0.4129550034581306#3837 +0.5018153753695055#3838 +0.5856617739282951#3839 +0.663656433636034#3840 +0.7350200576345289#3841 +0.7990396041824644#3842 +0.8550754111327816#3843 +0.902567587225408#3844 +0.9410416063356517#3845 +0.970113048782383#3846 +0.9894914423224154#3847 +0.9989831644531418#3848 +0.9984933770245784#3849 +0.988026973830809#3850 +0.9676885317128129#3851 +0.9376812656612382#3852 +0.8983049983593889#3853 +0.8499531644540819#3854 +0.7931088794867078#3855 +0.7283401127624386#3856 +0.6562940123886756#3857 +0.5776904391850793#3858 +0.4933147740722138#3859 +0.40401007080500034#3860 +0.31066863245827525#3861 +0.21422309582942212#3862 +0.11563711283978116#3863 +0.01589572204319201#3864 +-0.08400449355362567#3865 +-0.18306536401904885#3866 +-0.2802971058805568#3867 +-0.37472821171400944#3868 +-0.4654151571246921#3869 +-0.5514518281311794#3870 +-0.6319785747567164#3871 +-0.7061908003676237#3872 +-0.7733470009368971#3873 +-0.8327761739073366#3874 +-0.8838845226272941#3875 +-0.9261613893705334#3876 +-0.9591843576594301#3877 +-0.9826234729107834#3878 +-0.9962445392329431#3879 +-0.9999114594337439#3880 +-0.9935875948586621#3881 +-0.9773361314721403#3882 +-0.951319448524317#3883 +-0.9157974961112352#3884 +-0.8711251978394099#3885 +-0.8177489045464752#3886 +-0.7562019345111574#3887 +-0.6870992447133262#3888 +-0.6111312863871298#3889 +-0.5290571062604954#3890 +-0.44169676241113176#3891 +-0.34992313051729185#3892 +-0.25465318237253#3893 +-0.15683882380665107#3894 +-0.05745738355731774#3895 +0.042498151875634736#3896 +0.14202905982306696#3897 +0.24014086035331167#3898 +0.33585325278691963#3899 +0.42820991053700425#3900 +0.5162880364083785#3901 +0.5992075828820926#3902 +0.6761400452593388#3903 +0.7463167398065342#3904 +0.809036484189094#3905 +0.8636726034535386#3906 +0.909679191556477#3907 +0.9465965658773408#3908 +0.9740558602151771#3909 +0.991782710377798#3910 +0.9995999955380961#3911 +0.9974296079668007#3912 +0.9852932334590895#3913 +0.9633121346572913#3914 +0.9317059394346487#3915 +0.8907904464462075#3916 +0.8409744697730445#3917 +0.7827557541871054#3918 +0.7167160018499767#3919 +0.6435150601371714#3920 +0.56388432866127#3921 +0.47861945136875983#3922 +0.38857236672872686#3923 +0.29464279544528593#3924 +0.19776925074571347#3925 +0.0989196610665116#3926 +-9.183011675747517E-4#3927 +-0.10074708803994468#3928 +-0.19956924331117867#3929 +-0.2963973686720675#3930 +-0.3902639895011276#3931 +-0.48023122155121406#3932 +-0.5654001419788951#3933 +-0.6449197710843588#3934 +-0.7179955750192778#3935 +-0.7838974045063832#3936 +-0.8419667902496881#3937 +-0.891623522142032#3938 +-0.9323714465326797#3939 +-0.9638034236305925#3940 +-0.9856053955106381#3941 +-0.9975595240765649#3942 +-0.9995463676272517#3943 +-0.9915460742787029#3944 +-0.9736385803175122#3945 +-0.9460028115039091#3946 +-0.9089148953047087#3947 +-0.8627454019189386#3948 +-0.8079556416629041#3949 +-0.7450930557099968#3950 +-0.6747857462394504#3951 +-0.5977362006469884#3952 +-0.5147142725229772#3953 +-0.4265494895298316#3954 +-0.3341227650358171#3955 +-0.23835759631986517#3956 +-0.14021083729202993#3957 +-0.04066313792551283#3958 +0.059290854073709855#3959 +0.1586524314579784#3960 +0.25642880619063935#3961 +0.351643029055936#3962 +0.44334375101263535#3963 +0.5306147287591743#3964 +0.6125839795338587#3965 +0.6884324936783796#3966 +0.7574024179115897#3967 +0.8188046275489766#3968 +0.8720256120087151#3969 +0.9165336048066015#3970 +0.9518838967909858#3971 +0.9777232795296128#3972 +0.993793574451522#3973 +0.9999342124819873#3974 +0.9960838383956331#3975 +0.9822809238575657#3976 +0.9586633830272128#3977 +0.9254671945656303#3978 +0.8830240438147254#3979 +0.8317580087069611#3980 +0.7721813225188363#3981 +0.7048892558053088#3982 +0.6305541686531807#3983 +0.5499187926813633#3984 +0.4637888099120561#3985 +0.37302480266230326#3986 +0.27853365488995285#3987 +0.18125949090892593#3988 +0.08217424201115783#3989 +-0.017732064749593147#3990 +-0.11746119858080742#3991 +-0.21601669894331174#3992 +-0.31241383185560057#3993 +-0.40568942903026955#3994 +-0.49491151153316204#3995 +-0.579188601808808#3996 +-0.6576786310294751#3997 +-0.7295973527685441#3998 +-0.7942261789315666#3999 +-0.850919359650971#4000 +-0.8991104354052828#4001 +-0.9383178968954163#4002 +-0.9681499961264257#4003 +-0.9883086606239754#4004 +-0.9985924716759744#4005 +-0.9988986768417671#4006 +-0.9892242166205548#4007 +-0.9696657550209166#4008 +-0.9404187137259883#4009 +-0.9017753195046023#4010 +-0.8541216843780113#4011 +-0.7979339477162029#4012 +-0.7337735188107056#4013 +-0.6622814674585256#4014 +-0.5841721186046438#4015 +-0.5002259150432908#4016 +-0.41128161949152625#4017 +-0.3182279339494287#4018 +-0.2219946200834764#4019 +-0.12354320935531402#4020 +-0.023857395717228277#4021 +0.07606679313265759#4022 +0.1752309477299004#4023 +0.2726442526210754#4024 +0.36733338626426704#4025 +0.4583522461361782#4026 +0.5447914018758033#4027 +0.6257871820119776#4028 +0.7005303034832253#4029 +0.7682739577265967#4030 +0.8283412725419662#4031 +0.8801320751753131#4032 +0.9231288890464878#4033 +0.9569021042041466#4034 +0.9811142698463743#4035 +0.9955234660175518#4036 +0.9999857207925835#4037 +0.9944564487967827#4038 +0.978990896688197#4039 +0.9537435911512637#4040 +0.9189667949172583#4041 +0.8750079862384708#4042 +0.8223063870003694#4043 +0.761388574161709#4044 +0.6928632183716221#4045 +0.6174150023336926#4046 +0.5357977796827074#4047 +0.4488270427283285#4048 +0.35737177432550127#4049 +0.26234576528501463#4050 +0.1646984840777792#4051 +0.06540559005971848#4052 +-0.034540814994005645#4053 +-0.13414209964198492#4054 +-0.2324030807718237#4055 +-0.3283419671408341#4056 +-0.421000169109596#4057 +-0.5094518765527665#4058 +-0.5928133092478203#4059 +-0.6702515473148938#4060 +-0.7409928534768989#4061 +-0.8043304039866315#4062 +-0.8596313509760083#4063 +-0.9063431456627741#4064 +-0.9439990592352849#4065 +-0.9722228462525142#4066 +-0.9907325039641293#4067 +-0.9993430899887548#4068 +-0.9979685701971142#4069 +-0.9866226783366094#4070 +-0.9654187788082579#4071 +-0.9345687339670693#4072 +-0.8943807872634282#4073 +-0.8452564833764284#4074 +-0.7876866561121733#4075 +-0.7222465241546325#4076 +-0.6495899436706947#4077 +-0.5704428751954832#4078 +-0.48559613007466035#4079 +-0.3958974689388687#4080 +-0.30224313115974216#4081 +-0.20556887992236214#4082 +-0.10684065238883424#4083 +-0.0070449083734608125#4084 +0.09282122603764317#4085 +0.19175992144079657#4086 +0.28878261509631514#4087 +0.382919888320631#4088 +0.47323115259733173#4089 +0.5588140476266991#4090 +0.6388134574115429#4091 +0.712430054293582#4092 +0.7789282855711821#4093 +0.8376437228988098#4094 +0.8879897010354305#4095 +0.9294631796096705#4096 +0.9616497693329252#4097 +0.9842278724401516#4098 +0.996971895988431#4099 +0.9997545059070827#4100 +0.9925478992776083#4101 +0.9754240821312622#4102 +0.9485541499885891#4103 +0.9122065783295403#4104 +0.8667445400752233#4105 +0.8126222768841236#4106 +0.7503805605196052#4107 +0.6806412896372068#4108 +0.6041012759788476#4109 +0.5215252820602374#4110 +0.433738379916617#4111 +0.34161770725571405#4112 +0.24608370338771093#4113 +0.148090912499914#4114 +0.04861844616676457#4115 +-0.0513397996093618#4116 +-0.15078507507847264#4117 +-0.24872375592031773#4118 +-0.34417727121014857#4119 +-0.43619188097592587#4120 +-0.5238482056528556#4121 +-0.606270412220094#4122 +-0.6826349652347802#4123 +-0.7521788553259561#4124 +-0.8142072229319841#4125 +-0.8681003011075967#4126 +-0.9133196080303462#4127 +-0.9494133273329757#4128 +-0.9760208225032105#4129 +-0.9928762402445782#4130 +-0.9998111667946672#4131 +-0.9967563106597709#4132 +-0.983742194952588#4133 +-0.9608988524153701#4134 +-0.928454526175744#4135 +-0.8867333892168279#4136 +-0.836152305347941#4137 +-0.7772166640392184#4138 +-0.710515330737084#4139 +-0.6367147631153636#4140 +-0.5565523520505097#4141 +-0.47082905385571255#4142 +-0.38040138739018#4143 +-0.28617287600582364#4144 +-0.18908501984059176#4145 +-0.09010788866030936#4146 +0.009769570757759355#4147 +0.10954941585420723#4148 +0.20823467939966173#4149 +0.30483933086178727#4150 +0.39839812849642603#4151 +0.48797626372403896#4152 +0.572678701428026#4153 +0.651659122849752#4154 +0.7241283817258269#4155 +0.7893623891767129#4156 +0.8467093485634559#4157 +0.8955962680242483#4158 +0.9355346856197043#4159 +0.9661255498830958#4160 +0.987063207010698#4161 +0.9981384548535612#4162 +0.9992406331962297#4163 +0.9903587294370351#4164 +0.9715814886223723#4165 +0.943096526735531#4166 +0.905188456099808#4167 +0.8582360416262537#4168 +0.8027084163198831#4169 +0.7391603938577652#4170 +0.6682269250741585#4171 +0.5906167537416616#4172 +0.5071053350377174#4173 +0.41852708745281125#4174 +0.32576705555673624#4175 +0.22975206692580843#4176 +0.13144147158809297#4177 +0.03181755651504257#4178 +-0.06812426906522044#4179 +-0.16738541946787286#4180 +-0.26497411008946486#4181 +-0.35991526699183735#4182 +-0.45126026951859527#4183 +-0.5380964285991342#4184 +-0.619556106036139#4185 +-0.694825383659648#4186 +-0.7631521957283619#4187 +-0.8238538433219311#4188 +-0.8763238156428974#4189 +-0.9200378500720962#4190 +-0.9545591704274494#4191 +-0.9795428510871975#4192 +-0.9947392633726951#4193 +-0.9999965697556514#4194 +-0.9952622409685223#4195 +-0.9805835808595879#4196 +-0.9561072537485367#4197 +-0.9220778190050644#4198 +-0.8788352874924923#4199 +-0.8268117242916139#4200 +-0.7665269316492288#4201 +-0.6985832552859171#4202 +-0.6236595659567079#4203 +-0.5425044763989001#4204 +-0.4559288614410496#4205 +-0.3647977560097223#4206 +-0.27002171198645003#4207 +-0.17254770027431887#4208 +-0.07334964897773245#4209 +0.026581287765269457#4210 +0.1262466330675262#4211 +0.2246505637437602#4212 +0.32080986024666885#4213 +0.413763730671632#4214 +0.5025834106718274#4215 +0.5863814433645755#4216 +0.6643205465071567#4217 +0.7356219783442121#4218 +0.7995733185379454#4219 +0.8555355864366431#4220 +0.9029496255581272#4221 +0.9413416904964934#4222 +0.9703281804296068#4223 +0.9896194719317152#4224 +0.9990228127949825#4225 +0.9984442479458342#4226 +0.9878895582129948#4227 +0.9674642025673584#4228 +0.9373722644108115#4229 +0.8979144124423419#4230 +0.8494848964757872#4231 +0.7925676082260158#4232 +0.7277312464228656#4233 +0.6556236345614223#4234 +0.576965248063798#4235 +0.49254201552687205#4236 +0.4031974659835432#4237 +0.3098243006394673#4238 +0.21335547329769788#4239 +0.11475486859267976#4240 +0.015007671173599317#4241 +-0.08488947793497129#4242 +-0.1839384394407459#4243 +-0.28114954886159205#4244 +-0.3755515049258966#4245 +-0.46620107449380255#4246 +-0.5521925170309506#4247 +-0.6326666344685011#4248 +-0.7068193560262241#4249 +-0.7739097722219453#4250 +-0.83326753779418#4251 +-0.8842995695703985#4252 +-0.9264959723580396#4253 +-0.9594351336487255#4254 +-0.9827879362310783#4255 +-0.9963210466211054#4256 +-0.9998992464532412#4257 +-0.9934867835375585#4258 +-0.9771477290838324#4259 +-0.9510453375231913#4260 +-0.9154404153238058#4261 +-0.8706887150988698#4262 +-0.8172373810440856#4263 +-0.7556204812206672#4264 +-0.686453671323811#4265 +-0.6104280432544994#4266 +-0.5283032199576698#4267 +-0.4408997655208472#4268 +-0.34909098636902386#4269 +-0.2537942054755377#4270 +-0.15596159677414934#4271 +-0.05657067135184257#4272 +0.043385489518834315#4273 +0.14290815691957492#4274 +0.24100293325553057#4275 +0.33668968794737386#4276 +0.42901235057205933#4277 +0.5170484636024555#4278 +0.5999183992980321#4279 +0.6767941486544775#4280 +0.7469075945959657#4281 +0.8095581867470729#4282 +0.8641199411005575#4283 +0.910047694642637#4284 +0.9468825524416159#4285 +0.9742564727743516#4286 +0.9918959444774944#4287 +0.9996247197806206#4288 +0.9973655753156946#4289 +0.9851410837074361#4290 +0.9630733880351154#4291 +0.9313829814192799#4292 +0.8903865039273795#4293 +0.8404935788108798#4294 +0.7822027196851367#4295 +0.7160963495461387#4296 +0.6428349813924542#4297 +0.5631506185976866#4298 +0.4778394409747333#4299 +0.38775384961027715#4300 +0.2937939499548949#4301 +0.19689855826693#4302 +0.09803582127077107#4303 +-0.0018064572451918896#4304 +-0.10163068623749626#4305 +-0.20043945500755345#4306 +-0.2972454989996491#4307 +-0.3910815642220373#4308 +-0.48101007172909493#4309 +-0.5661324856002233#4310 +-0.6455982908137508#4311 +-0.7186134913118861#4312 +-0.7844485433468682#4313 +-0.8424456448409379#4314 +-0.8920253079272591#4315 +-0.9326921490011307#4316 +-0.9640398384292128#4317 +-0.9857551604609085#4318 +-0.9976211427766078#4319 +-0.9995192244033847#4320 +-0.9914304403370466#4321 +-0.973435611034188#4322 +-0.9457145348809033#4323 +-0.9085441917067469#4324 +-0.8622959752938333#4325 +-0.8074319825329326#4326 +-0.7445003963040872#4327 +-0.6741300082144792#4328 +-0.5970239359205429#4329 +-0.5139525978087609#4330 +-0.42574601522981265#4331 +-0.33328551919960797#4332 +-0.23749494443110458#4333 +-0.1393313986832356#4334 +-0.0397756996565601#4335 +0.06017742501298571#4336 +0.15952927674381348#4337 +0.2572871646747842#4338 +0.35247432430415254#4339 +0.4441396769975931#4340 +0.5313673328515297#4341 +0.6132857419622988#4342 +0.6890764026646912#4343 +0.7579820397300296#4344 +0.8193141708099325#4345 +0.872459985524356#4346 +0.9168884684603441#4347 +0.9521557049025041#4348 +0.9779093162821043#4349 +0.9938919810272516#4350 +0.9999440056349789#4351 +0.9960049202759392#4352 +0.9821140829889516#4353 +0.9584102864284875#4354 +0.9251303710943455#4355 +0.8826068588996672#4356 +0.8312646307218977#4357 +0.7716166811335055#4358 +0.7042589927297871#4359 +0.6298645812677813#4360 +0.5491767711152941#4361 +0.4630017681995254#4362 +0.3722006046639412#4363 +0.27768053571971557#4364 +0.18038597465155876#4365 +0.08128905655235824#4366 +-0.018620074929324236#4367 +-0.11834316077729126#4368 +-0.21688380088181902#4369 +-0.3132574097401875#4370 +-0.4065010541095631#4371 +-0.49568307431765746#4372 +-0.5799123930982074#4373 +-0.6583474189404683#4374 +-0.7302044549933965#4375 +-0.7947655295055287#4376 +-0.8513855695613934#4377 +-0.8994988464368491#4378 +-0.9386246281734907#4379 +-0.9683719828934694#4380 +-0.9884436848615913#4381 +-0.9986391842666134#4382 +-0.9988566110486644#4383 +-0.9890937927512102#4384 +-0.9694482762275201#4385 +-0.9401163529847545#4386 +-0.9013910979041106#4387 +-0.8536594409334871#4388 +-0.7973983010113463#4389 +-0.7331698208503304#4390 +-0.6616157501930958#4391 +-0.5834510336610189#4392 +-0.4994566672638683#4393 +-0.4104718949458387#4394 +-0.31738582313747726#4395 +-0.2211285370981292#4396 +-0.12266180781147178#4397 +-0.022969482287764426#4398 +0.07695234671026101#4399 +0.17610529329702104#4400 +0.27349865400582685#4401 +0.3681593065704404#4402 +0.45914143304108707#4403 +0.5455359700847644#4404 +0.6264796920455684#4405 +0.7011638360101038#4406 +0.768842182699172#4407 +0.8288385124441429#4408 +0.880553361750354#4409 +0.9234700129381941#4410 +0.9571596570153528#4411 +0.9812856781945266#4412 +0.9956070172470954#4413 +0.9999805800872513#4414 +0.9943626675208029#4415 +0.9788094118730793#4416 +0.9534762161332899#4417 +0.9186162012192256#4418 +0.874577676876719#4419 +0.8218006614837998#4420 +0.7608124855325126#4421 +0.6922225227169522#4422 +0.6167161012727448#4423 +0.5350476564038567#4424 +0.44803319221541943#4425 +0.35654212847044664#4426 +0.2614886136349538#4427 +0.16382239100866292#4428 +0.06451930920389547#4429 +-0.03542842821118951#4430 +-0.13502217648266945#4431 +-0.2332668277991315#4432 +-0.3291807540799851#4433 +-0.4218056150787603#4434 +-0.5102159338020652#4435 +-0.5935283435697821#4436 +-0.6709104143229327#4437 +-0.7415889699896632#4438 +-0.8048578138049752#4439 +-0.8600847843953653#4440 +-0.9067180721263033#4441 +-0.944291732601697#4442 +-0.9724303422262768#4443 +-0.9908527493140615#4444 +-0.9993748832630681#4445 +-0.997911593727921#4446 +-0.9864775014139562#4447 +-0.9651868519919665#4448 +-0.9342523745932234#4449 +-0.8939831562903168#4450 +-0.8447815538012954#4451 +-0.7871391732743425#4452 +-0.721631958321646#4453 +-0.6489144353812071#4454 +-0.5697131739050296#4455 +-0.4848195267173279#4456 +-0.39508172307869294#4457 +-0.30139639345970826#4458 +-0.20469961070567458#4459 +-0.10595753710616392#4460 +-0.006156770820793085#4461 +0.09370551188346128#4462 +0.1926315200878997#4463 +0.28963281781913364#4464 +0.3837402001745981#4465 +0.47401337729756166#4466 +0.5595503694425562#4467 +0.6394965192588389#4468 +0.7130530312441288#4469 +0.7794849530452186#4470 +0.8381285188589453#4471 +0.8883977815606836#4472 +0.9297904672943264#4473 +0.9618929940266256#4474 +0.9843846039221565#4475 +0.9970405682495806#4476 +0.9997344327968439#4477 +0.9924392813598633#4478 +0.9752280046803405#4479 +0.948272572145566#4480 +0.911842313527146#4481 +0.8663012279269533#4482 +0.8121043468184239#4483 +0.7497931875224875#4484 +0.6799903425454984#4485 +0.6033932588407144#4486 +0.5207672691488844#4487 +0.4329379450464886#4488 +0.340782848107444#4489 +0.245222761597941#4490 +0.14721249031441808#4491 +0.04773132048965235#4492 +-0.052226764911569364#4493 +-0.15166301774166763#4494 +-0.2495839038316188#4495 +-0.345011030055953#4496 +-0.4369909201134505#4497 +-0.5246045413471654#4498 +-0.6069764874149429#4499 +-0.6832837250602186#4500 +-0.7527638175882598#4501 +-0.8147225428815908#4502 +-0.8685408298379123#4503 +-0.9136809439239166#4504 +-0.9496918600409943#4505 +-0.9762137690189293#4506 +-0.9929816727101918#4507 +-0.9998280317638305#4508 +-0.9966844396232869#4509 +-0.9835823060220958#4510 +-0.9606525431482109#4511 +-0.9281242576126963#4512 +-0.8863224612922014#4513 +-0.835664823917724#4514 +-0.7766574998567214#4515 +-0.7098900707859835#4516 +-0.6360296547864077#4517 +-0.5558142407196545#4518 +-0.47004531448738884#4519 +-0.37957985084908624#4520 +-0.2853217508135146#4521 +-0.18821281015864433#4522 +-0.08922330931955144#4523 +0.010657681332957976#4524 +0.11043218395654948#4525 +0.20910328470207334#4526 +0.30568509454720927#4527 +0.39921259997368597#4528 +0.4887513050633646#4529 +0.5734065686725494#4530 +0.6523325433905668#4531 +0.7247406269674924#4532 +0.7899073417671557#4533 +0.84718156351653#4534 +0.8959910271242357#4535 +0.9358480445641681#4536 +0.9663543776930457#4537 +0.9872052173142973#4538 +0.9981922287307987#4539 +0.9992056333562993#4540 +0.990235305586768#4541 +0.9713708739720819#4542 +0.942800825677183#4543 +0.9048106231806318#4544 +0.8577798520278825#4545 +0.8021784281379878#4546 +0.7385619025590685#4547 +0.6675659105858819#4548 +0.5898998207020697#4549 +0.5063396468047552#4550 +0.41772029453019976#4551 +0.32492721915266787#4552 +0.2288875784080196#4553 +0.13056096864009153#4554 +0.03092983683122936#4555 +-0.06901033568320586#4556 +-0.16826097973527826#4557 +-0.2658304156975201#4558 +-0.36074376201796365#4559 +-0.45205267591435566#4560 +-0.538844828901757#4561 +-0.6202530224771886#4562 +-0.6954638528804155#4563 +-0.7637258383554432#4564 +-0.8243569277078173#4565 +-0.8767513151347024#4566 +-0.9203854932362104#4567 +-0.9548234837282926#4568 +-0.9797211935936381#4569 +-0.9948298531453608#4570 +-0.9999985016514786#4571 +-0.9951754956846467#4572 +-0.9804090251262118#4573 +-0.9558466316688474#4574 +-0.9217337346287321#4575 +-0.8784111787968661#4576 +-0.8263118288305887#4577 +-0.7659562442130079#4578 +-0.6979474779947189#4579 +-0.622965051287066#4580 +-0.5417581637118176#4581 +-0.45513820764619767#4582 +-0.36397066105846365#4583 +-0.2691664399381365#4584 +-0.17167279672454178#4585 +-0.07246385567355651#4586 +0.02746912026995325#4587 +0.12712763384380946#4588 +0.2255159301231064#4589 +0.32165094577426767#4590 +0.41457213149891764#4591 +0.5033510495249554#4592 +0.5871006502498729#4593 +0.6649841353471638#4594 +0.736223318778593#4595 +0.8001064021718566#4596 +0.8559950868746282#4597 +0.9033309516237009#4598 +0.941641032105658#4599 +0.9705425466599525#4600 +0.9897467209067285#4601 +0.9990616730849682#4602 +0.9983943312716201#4603 +0.9877513633254895#4604 +0.9672391102641967#4605 +0.9370625237398807#4606 +0.8975231182300396#4607 +0.849015958404538#4608 +0.7920257117700172#4609 +0.7271218060323789#4610 +0.6549527395633749#4611 +0.5762396018192422#4612 +0.49176886845321643#4613 +0.4023845431107794#4614 +0.30897972442422345#4615 +0.21248768246633692#4616 +0.11387253382433511#4617 +0.014119608465615191#4618 +-0.0857743953535712#4619 +-0.18481136976762977#4620 +-0.282001770065486#4621 +-0.37637450189423827#4622 +-0.46698662411293085#4623 +-0.5529327703487394#4624 +-0.6333541951184943#4625 +-0.7074473541296843#4626 +-0.7744719330294112#4627 +-0.833758244380689#4628 +-0.8847139189579444#4629 +-0.9268298245045077#4630 +-0.9596851528138249#4631 +-0.9829516243059571#4632 +-0.9963967680886273#4633 +-0.9998862447295328#4634 +-0.9933851885315454#4635 +-0.9769585558992319#4636 +-0.9507704763159315#4637 +-0.9150826124162126#4638 +-0.8702515455393219#4639 +-0.8167252128863131#4640 +-0.7550384318796021#4641 +-0.6858075564440695#4642 +-0.6097243186023826#4643 +-0.5275489169172812#4644 +-0.44010242083882695#4645 +-0.3482585668498676#4646 +-0.25293502837991955#4647 +-0.1550842467156025#4648 +-0.05568391452213869#4649 +0.044272792938575674#4650 +0.14378714128688722#4651 +0.2418648160491692#4652 +0.33752585751936537#4653 +0.4298144521924413#4654 +0.5178084829369766#4655 +0.6006287424847309#4656 +0.6774477181790405#4657 +0.7474978602077449#4658 +0.8100792507071913#4659 +0.8645665971101664#4660 +0.9104154798625334#4661 +0.947167792083456#4662 +0.9744563168179221#4663 +0.9920083961471714#4664 +0.9996486554964923#4665 +0.9973007559200001#4666 +0.9849881568541509#4667 +0.9628338817188064#4668 +0.9310592887078893#4669 +0.8899818590514812#4670 +0.8400120248483158#4671 +0.7816490681639204#4672 +0.7154761323692573#4673 +0.6421543955649226#4674 +0.5624164643081216#4675 +0.4770590536501172#4676 +0.3869350266227958#4677 +0.29294487271317216#4678 +0.19602771047009768#4679 +0.09715190414215104#4680 +-0.002694611897834578#4681 +-0.10251420426645728#4682 +-0.2013095085927397#4683 +-0.2980933948532388#4684 +-0.3918988304489386#4685 +-0.4817885424753208#4686 +-0.5668643826434057#4687 +-0.6462763012805672#4688 +-0.7192308407458727#4689 +-0.784999063396549#4690 +-0.8429238348919543#4691 +-0.89242639006269#4692 +-0.933012115740859#4693 +-0.9642754927713421#4694 +-0.985904147825149#4695 +-0.9976819745304649#4696 +-0.9994912927360821#4697 +-0.991314024332571#4698 +-0.9732318738827741#4699 +-0.9454255122568215#4700 +-0.9081727714285188#4701 +-0.8618458684701038#4702 +-0.8069076864822988#4703 +-0.7439071496193778#4704 +-0.6734737384204668#4705 +-0.596311200248075#4706 +-0.5131905176770778#4707 +-0.42494220509167996#4708 +-0.3324480104602216#4709 +-0.2366321052009449#4710 +-0.13845185016667366#4711 +-0.03888823001163328#4712 +0.06106394848294375#4713 +0.16040599618933662#4714 +0.25814532020497766#4715 +0.35330534151262716#4716 +0.44493525263509953#4717 +0.5321195177892803#4718 +0.6139870206170349#4719 +0.6897197680919065#4720 +0.7585610636350439#4721 +0.8198230677772865#4722 +0.872893670823771#4723 +0.9172426088516656#4724 +0.9524267619320054#4725 +0.9780945816375459#4726 +0.9939896035984427#4727 +0.9999530100094578#4728 +0.9959252164849727#4729 +0.9819464674064724#4730 +0.9581564338139892#4731 +0.9247928178592397#4732 +0.882188977764299#4733 +0.8307705970164385#4734 +0.7710514310794344#4735 +0.7036281741187975#4736 +0.6291744970309135#4737 +0.5484343163461312#4738 +0.4622143612606979#4739 +0.37137611306529994#4740 +0.2768271975087733#4741 +0.17951231610164317#4742 +0.080403806970907#4743 +-0.019508070421117876#4744 +-0.1192250296220056#4745 +-0.21775073173746473#4746 +-0.31410074052022424#4747 +-0.40731235853160475#4748 +-0.49645424609610067#4749 +-0.5806357269395575#4750 +-0.6590156875320847#4751 +-0.7308109812164121#4752 +-0.7953042531504141#4753 +-0.8518511078795672#4754 +-0.8998865479233226#4755 +-0.938930619043168#4756 +-0.968593205786728#4757 +-0.9885779293924083#4758 +-0.9986851091080121#4759 +-0.9988137573348106#4760 +-0.9889625886622468#4761 +-0.9692300327113339#4762 +-0.9398132506584176#4763 +-0.9010061652658754#4764 +-0.8531965241030328#4765 +-0.7968620253006231#4766 +-0.7325655445489706#4767 +-0.6609495110301554#4768 +-0.5827294884779846#4769 +-0.49868702550169774#4770 +-0.4096618466106099#4771 +-0.3165434619643894#4772 +-0.22026227968157627#4773 +-0.12178030950921329#4774 +-0.022081550739451946#4775 +0.07783783958610788#4776 +0.17697949994829187#4777 +0.27435283964863644#4778 +0.36898493646420194#4779 +0.4599302577648192#4780 +0.5462801079625782#4781 +0.6271717078977682#4782 +0.7017968154430443#4783 +0.7694098011915946#4784 +0.8293350985397009#4785 +0.8809739537249303#4786 +0.9238104083758077#4787 +0.957416454797311#4788 +0.981456312482278#4789 +0.9956897831192412#4790 +0.9999746505745556#4791 +0.9942681018689966#4792 +0.978627154950896#4793 +0.9532080889916499#4794 +0.918264882895897#4795 +0.8741466776282583#4796 +0.8212942877122281#4797 +0.7602357967571705#4798 +0.691581281021455#4799 +0.6160167137321476#4800 +0.5342971110672784#4801 +0.44723898828376585#4802 +0.3557122013668739#4803 +0.2606312557167434#4804 +0.16294616871272874#4805 +0.0636329774537779#4806 +-0.036316013481625595#4807 +-0.13590214681479854#4808 +-0.23413039082027445#4809 +-0.33001928135389064#4810 +-0.4226107283180879#4811 +-0.5109795885814625#4812 +-0.5942429097031241#4813 +-0.6715687521016191#4814 +-0.7421845015202269#4815 +-0.8053845887332195#4816 +-0.8605375393603357#4817 +-0.9070922833500508#4818 +-0.9445836610893715#4819 +-0.9726370711249284#4820 +-0.9909722130568702#4821 +-0.9994058882078054#4822 +-0.9978538300834279#4823 +-0.9863315463354743#4824 +-0.9649541638143936#4825 +-0.9339352782599134#4826 +-0.893584820123014#4827 +-0.8443059578433111#4828 +-0.7865910695232777#4829 +-0.7210168232490024#4830 +-0.6482384152132938#4831 +-0.5689830232119021#4832 +-0.484042540923356#4833 +-0.3942656655690927#4834 +-0.30054941801136287#4835 +-0.203830180017291#4836 +-0.10507433824178496#4837 +-0.005268628411524885#4838 +0.09458972381224616#4839 +0.19350296678289045#4840 +0.29048279207301586#4841 +0.38456020932559115#4842 +0.4747952280852878#4843 +0.56028624987239#4844 +0.6401790766567751#4845 +0.7136754457222707#4846 +0.7800410056438436#4847 +0.8386126536842945#4848 +0.8888051612976158#4849 +0.9301170215391718#4850 +0.9621354599573143#4851 +0.9845405588992577#4852 +0.997108454022515#4853 +0.9997135710734083#4854 +0.9923298805835022#4855 +0.9750311579474484#4856 +0.947990246283629#4857 +0.9114773294428521#4858 +0.865857232420625#4859 +0.811585776146395#4860 +0.7492052230714963#4861 +0.6793388590619841#4862 +0.6026847657322923#4863 +0.5200088454444972#4864 +0.4321371686650891#4865 +0.33994772014193364#4866 +0.24436162637089454#4867 +0.1463339520043707#4868 +0.04684415716099188#4869 +-0.053113689016120146#4870 +-0.15254084076963417#4871 +-0.2504438548654753#4872 +-0.34584451674923133#4873 +-0.4377896145426254#4874 +-0.5253604632215139#4875 +-0.607682083812971#4876 +-0.6839319458959563#4877 +-0.7533481860533897#4878 +-0.815237220159576#4879 +-0.8689806734435207#4880 +-0.9140415590852341#4881 +-0.9499696436105324#4882 +-0.9764059454750843#4883 +-0.9930863218893389#4884 +-0.999844108045964#4885 +-0.9966117823795099#4886 +-0.9834216412195708#4887 +-0.960405476096536#4888 +-0.9277932569241824#4889 +-0.8859108342163137#4890 +-0.8351766832961389#4891 +-0.7760977230291721#4892 +-0.7092642508574933#4893 +-0.6353440447428335#4894 +-0.555075690949919#4895 +-0.4692612043366593#4896 +-0.37875801488679633#4897 +-0.28447040055293665#4898 +-0.18734045201016314#4899 +-0.08833865959742333#4900 +0.011545783501135819#4901 +0.11131486494748018#4902 +0.20997172505907102#4903 +0.3065306171012951#4904 +0.400026756542992#4905 +0.4895259608645748#4906 +0.5741339836009652#4907 +0.6530054493566748#4908 +0.7253523005173126#4909 +0.7904516712607705#4910 +0.8476531101935705#4911 +0.8963850794461777#4912 +0.9361606652904673#4913 +0.9665824432207433#4914 +0.9873464488880291#4915 +0.9982452152113649#4916 +0.9991698453203011#4917 +0.990111100616431#4918 +0.9711594930824132#4919 +0.942504380916159#4920 +0.9044320765263129#4921 +0.8573229857933078#4922 +0.8016478071795532#4923 +0.7379628286659907#4924 +0.6669043695064731#4925 +0.589182422336119#4926 +0.5055735591595948#4927 +0.4169131721003451#4928 +0.3240871264386389#4929 +0.2280229093385172#4930 +0.12968036270263658#4931 +0.030042092749259296#4932 +-0.06989634786427318#4933 +-0.16913640727460627#4934 +-0.2666865116125137#4935 +-0.36157197248122797#4936 +-0.4528447257207117#4937 +-0.5395928041513566#4938 +-0.6209494496485853#4939 +-0.696101773503521#4940 +-0.76429887853826#4941 +-0.8248593618222606#4942 +-0.8771781230251833#4943 +-0.9207324103793711#4944 +-0.9550870438427141#4945 +-0.9798987632737787#4946 +-0.9949196581736731#4947 +-0.9999996447258055#4948 +-0.9950879653837672#4949 +-0.9802336960239586#4950 +-0.9555852555956543#4951 +-0.9213889231679229#4952 +-0.8779863771905777#4953 +-0.8258112815560504#4954 +-0.7653849525731279#4955 +-0.6973111501467191#4956 +-0.6222700452084615#4957 +-0.5410114236736072#4958 +-0.45434719482800395#4959 +-0.3631432789988919#4960 +-0.26831095556522977#4961 +-0.17079775775536865#4962 +-0.07157800520824754#4963 +0.028356931106371913#4964 +0.12800853433893156#4965 +0.2263811186103717#4966 +0.32249177757630465#4967 +0.4153802053023024#4968 +0.5041182913233582#4969 +0.5878193940168606#4970 +0.6656471996326018#4971 +0.7368240784633209#4972 +0.8006388546636893#4973 +0.856453912084273#4974 +0.9037115651213302#4975 +0.9419396309270177#4976 +0.9707561473043234#4977 +0.9898731891470789#4978 +0.9990997452924452#4979 +0.9983436270413116#4980 +0.9876123892773043#4981 +0.9670132549808855#4982 +0.9367520438927767#4983 +0.8971311160311438#4984 +0.8485463506102431#4985 +0.7914831905461722#4986 +0.7265117920717187#4987 +0.6542813279237506#4988 +0.5755135010238178#4989 +0.49099533346112295#4990 +0.40157130282796105#4991 +0.3081349044787646#4992 +0.2116197240198723#4993 +0.1129901092307529#4994 +0.013231534619763643#4995 +-0.08665924511138251#4996 +-0.1856841543111132#4997 +-0.2828537688199873#4998 +-0.3771972019698358#4999 +-0.46777180536241775#5000 +-0.5536725875006172#5001 +-0.6340412561643325#5002 +-0.7080747941826249#5003 +-0.7750334829158495#5004 +-0.8342482932797833#5005 +-0.8851275704630837#5006 +-0.9271629455465875#5007 +-0.9599344149575082#5008 +-0.9831145370062989#5009 +-0.9964717035757779#5010 +-0.9998724542728749#5011 +-0.9932828099207633#5012 +-0.9767686120675627#5013 +-0.9504948651193542#5014 +-0.9147240876706985#5015 +-0.8698136895056156#5016 +-0.8162124004771674#5017 +-0.754455786947096#5018 +-0.6851609005837718#5019 +-0.6090201129858933#5020 +-0.5267941977343409#5021 +-0.4393047289940346#5022 +-0.34742587261645447#5023 +-0.25207565176341384#5024 +-0.1542067743230842#5025 +-0.05479711376769998#5026 +0.04516006143493376#5027 +0.14466601223164102#5028 +0.24272650805435486#5029 +0.3383617608433046#5030 +0.43061621476543416#5031 +0.5185680938124212#5032 +0.6013386118818538#5033 +0.6781007533174772#5034 +0.748087536176257#5035 +0.8105996756584224#5036 +0.8650125711300333#5037 +0.910782546926049#5038 +0.9474522845778579#5039 +0.9746553921882468#5040 +0.9921200652981245#5041 +0.9996718026668301#5042 +0.9972351498308482#5043 +0.9848344530198655#5044 +0.9625936158972921#5045 +0.9307348615558133#5046 +0.8895765121377056#5047 +0.8395298082652133#5048 +0.7810948000601897#5049 +0.7148553508085741#5050 +0.6414733031914381#5051 +0.5616818663716927#5052 +0.4762782900104988#5053 +0.38611589841218874#5054 +0.2920955643898892#5055 +0.19515670804216095#5056 +0.0962679103779054#5057 +-0.003582764424906281#5058 +-0.10339764142988875#5059 +-0.20217940338041937#5060 +-0.2989410555639972#5061 +-0.3927157875371532#5062 +-0.48256663317581633#5063 +-0.5675958325311052#5064 +-0.6469538019499782#5065 +-0.7198476228342582#5066 +-0.785548964221163#5067 +-0.8434013600255303#5068 +-0.8928267682319421#5069 +-0.9333313464994675#5070 +-0.9645103864710906#5071 +-0.9860523574858352#5072 +-0.9977420192901507#5073 +-0.9994625726473769#5074 +-0.9911968263571076#5075 +-0.9730273690239829#5076 +-0.9451357438596512#5077 +-0.9078006347630092#5078 +-0.8613950818028046#5079 +-0.8063827539245794#5080 +-0.7433133161238353#5081 +-0.6728169373750934#5082 +-0.5955979941918066#5083 +-0.5124280327290739#5084 +-0.4241380597494972#5085 +-0.33161023947830387#5086 +-0.23576907931001329#5087 +-0.13757219243615187#5088 +-0.03800072969078855#5089 +0.06195042378427414#5090 +0.16128258910297158#5091 +0.2590032721042872#5092 +0.3541360800258346#5093 +0.4457304772975865#5094 +0.5328712829790856#5095 +0.6146878149448826#5096 +0.6903625894525244#5097 +0.7591394891698853#5098 +0.8203313180496092#5099 +0.8733266675648592#5100 +0.9175960257012121#5101 +0.9526970676656734#5102 +0.9782790754497961#5103 +0.9940864420880884#5104 +0.9999612255983212#5105 +0.9958447270856055#5106 +0.9817780772423467#5107 +0.9579018253839627#5108 +0.9244545351265829#5109 +0.8817704007382551#5110 +0.8302759079802887#5111 +0.7704855728025053#5112 +0.7029968004699444#5113 +0.6284839164869312#5114 +0.5476914289595397#5115 +0.46142658971669825#5116 +0.37055132851675693#5117 +0.2759736409302586#5118 +0.17863851594834093#5119 +0.07951849396516575#5120 +-0.02039605052444625#5121 +-0.12010680441925582#5122 +-0.21861749082633866#5123 +-0.31494382353041833#5124 +-0.4081233416563674#5125 +-0.4972250262601245#5126 +-0.5813586027622296#5127 +-0.6596834362771361#5128 +-0.7314169309591104#5129 +-0.7958423494412308#5130 +-0.8523159742382354#5131 +-0.9002735395588507#5132 +-0.9392358692630565#5133 +-0.968813664631682#5134 +-0.9887113941105229#5135 +-0.9987302461639416#5136 +-0.9987701157340123#5137 +-0.9888306044571701#5138 +-0.9690110246445276#5139 +-0.9395094069860908#5140 +-0.9006205218935647#5141 +-0.8527329342518376#5142 +-0.796325121007094#5143 +-0.7319606903833317#5144 +-0.6602827504952915#5145 +-0.5820074836247582#5146 +-0.49791699036393944#5147 +-0.4088514751248763#5148 +-0.3157008510946928#5149 +-0.2193958485171965#5150 +-0.12089871514394081#5151 +-0.02119360177276821#5152 +0.07872327106164467#5153 +0.17785356699406288#5154 +0.27520680887564847#5155 +0.36981027529422345#5156 +0.4607187196850812#5157 +0.5470238149222044#5158 +0.6278632290226549#5159 +0.702429241282698#5160 +0.7699768127560778#5161 +0.8298310304368901#5162 +0.8813938507672423#5163 +0.9241500750907953#5164 +0.9576724973474368#5165 +0.9816261725750176#5166 +0.9957717635686961#5167 +0.9999679322591741#5168 +0.9941727519159652#5169 +0.978444126065427#5170 +0.9529392099378654#5171 +0.917912840224423#5172 +0.8737149888330982#5173 +0.8207872660851259#5174 +0.7596585082906251#5175 +0.6909394937909978#5176 +0.6153168402636389#5177 +0.533546144265068#5178 +0.44644443155990476#5179 +0.3548819936695015#5180 +0.2597736922067416#5181 +0.16206981788121674#5182 +0.06274659550858111#5183 +-0.03720357010510971#5184 +-0.13678200994417533#5185 +-0.23499376915399928#5186 +-0.33085754830104785#5187 +-0.4234155081924356#5188 +-0.5117428402885212#5189 +-0.5949570070841342#5190 +-0.6722265601315991#5191 +-0.7427794475987832#5192 +-0.8059107283557985#5193 +-0.8609896155137471#5194 +-0.9074657790388062#5195 +-0.9448748444680102#5196 +-0.9728430327853834#5197 +-0.9910908950983123#5198 +-0.9994361047985073#5199 +-0.9977952793092036#5200 +-0.9861848132163057#5201 +-0.9647207144591039#5202 +-0.9336174452172925#5203 +-0.893185779075762#5204 +-0.8438296958776669#5205 +-0.7860423452913707#5206 +-0.7204011194219737#5207 +-0.6475618837002585#5208 +-0.5682524236921068#5209 +-0.4832651733056984#5210 +-0.39344929705384485#5211 +-0.2997022054828736#5212 +-0.20296058854309376#5213 +-0.1041910564924412#5214 +-0.004380481846299932#5215 +0.0954738611264548#5216 +0.19437426083829612#5217 +0.2913325371874285#5218 +0.38537991512671593#5219 +0.47557670434371857#5220 +0.5610216883356741#5221 +0.6408611290668913#5222 +0.7142972972369935#5223 +0.7805964429283947#5224 +0.8390961269929299#5225 +0.8892118399248504#5226 +0.9304428420865926#5227 +0.9623771669337133#5228 +0.9846957372484245#5229 +0.9971755532536798#5230 +0.9996919207532333#5231 +0.9922196970348302#5232 +0.9748335420878756#5233 +0.9477071726255013#5234 +0.9111116263645896#5235 +0.8654125539065005#5236 +0.8110665652771305#5237 +0.7486166676304692#5238 +0.6786868397006105#5239 +0.6019757972125022#5240 +0.5192500115453864#5241 +0.4313360514041404#5242 +0.3391123240180043#5243 +0.2435002983859096#5244 +0.14545529826283898#5245 +0.04595695688065448#5246 +-0.054000571223331524#5247 +-0.15341854346986936#5248 +-0.25130360834348353#5249 +-0.346677730632457#5250 +-0.4385879636333711#5251 +-0.5261159706795642#5252 +-0.6083872008575425#5253 +-0.6845796272306204#5254 +-0.7539319602603454#5255 +-0.8157512543599176#5256 +-0.8694198315774354#5257 +-0.9144014532298141#5258 +-0.9502466778224503#5259 +-0.9765973517200701#5260 +-0.993190187699463#5261 +-0.9998593956283852#5262 +-0.996538338985758#5263 +-0.9832602006717591#5264 +-0.9601576514552531#5265 +-0.927461524371324#5266 +-0.8854985083138918#5267 +-0.8346878838682738#5268 +-0.7755373339981713#5269 +-0.7086378714453144#5270 +-0.6346579335255096#5271 +-0.5543367033239355#5272 +-0.46847672402209806#5273 +-0.3779358801516458#5274 +-0.28361882589570886#5275 +-0.18646794608333994#5276 +-0.08745394019181343#5277 +0.012433876561680912#5278 +0.11219745813066402#5279 +0.2108399997855538#5280 +0.3073758978570232#5281 +0.4008405975620669#5282 +0.4903002305165539#5283 +0.5748609456394255#5284 +0.6536778402172297#5285 +0.7259634018927463#5286 +0.7909953772281428#5287 +0.848123988222581#5288 +0.896778424679212#5289 +0.9364725475519793#5290 +0.9668097462862708#5291 +0.9874869016204777#5292 +0.9982974142534595#5293 +0.9991332691164677#5294 +0.989986114624008#5295 +0.9709473461201218#5296 +0.94220719268632#5297 +0.9040528164354815#5298 +0.856865443282945#5299 +0.8011165538631789#5300 +0.7373631726511333#5301 +0.6662423023578131#5302 +0.5884645592097554#5303 +0.5048070727065923#5304 +0.41610572079997543#5305 +0.32324677807738733#5306 +0.2271580603994272#5307 +0.12879965447042646#5308 +0.029154324969461867#5309 +-0.07078230490945918#5310 +-0.17001170139524382#5311 +-0.2675423971590831#5312 +-0.36239989772826614#5313 +-0.45363641831282586#5314 +-0.540340353757865#5315 +-0.6216453870009271#5316 +-0.6967391450257175#5317 +-0.7648713158247487#5318 +-0.8253611452688975#5319 +-0.877604238977637#5320 +-0.9210786012279#5321 +-0.9553498505627952#5322 +-0.9800755599875371#5323 +-0.9950086783867864#5324 +-0.9999999989777303#5325 +-0.9949996501349354#5326 +-0.9800575936911434#5327 +-0.9553231257351534#5328 +-0.9210433848946539#5329 +-0.8775608830087473#5330 +-0.825310082862874#5331 +-0.7648130571802731#5332 +-0.696674272243908#5333 +-0.6215745482691752#5334 +-0.5402642568733623#5335 +-0.45355582361048796#5336 +-0.36231561048371774#5337 +-0.2674552595426102#5338 +-0.16992258405710617#5339 +-0.07069209828064123#5340 +0.0292447195741433#5341 +0.1288893338579619#5342 +0.22724612852302042#5343 +0.3233323549894589#5344 +0.4161879514443078#5345 +0.5048851354617692#5346 +0.5885376740985312#5347 +0.6663097388403877#5348 +0.7374242569244644#5349 +0.8011706755933992#5350 +0.8569120617036162#5351 +0.9040914657507545#5352 +0.9422374867250122#5353 +0.9709689821942126#5354 +0.9899988765529969#5355 +0.9991370293873787#5356 +0.9982921352949088#5357 +0.9874726361780741#5358 +0.9667866368955992#5359 +0.9364408251144325#5360 +0.8967384061548997#5361 +0.84807607346337#5362 +0.7909400449824686#5363 +0.7259012050221171#5364 +0.6536094001722174#5365 +0.5747869462503366#5366 +0.4902214111608231#5367 +0.4007577457766425#5368 +0.307289841469558#5369 +0.21075159864302492#5370 +0.11210759550806611#5371 +0.012343450336634304#5372 +-0.087544026510359#5373 +-0.18655679238266815#5374 +-0.28370554445296553#5375 +-0.3780196045036721#5376 +-0.4685566176228442#5377 +-0.5544119679029521#5378 +-0.6347278170640023#5379 +-0.708701675690067#5380 +-0.775594421438261#5381 +-0.8347376841048699#5382 +-0.8855405237594921#5383 +-0.9274953352214845#5384 +-0.9601829198831353#5385 +-0.9832766742035843#5386 +-0.9965458530234417#5387 +-0.9998578750941465#5388 +-0.9931796477859774#5389 +-0.9765778977386692#5390 +-0.9502185041508856#5391 +-0.9143648413700989#5392 +-0.8693751473431697#5393 +-0.8156989442211995#5394 +-0.7538725468827897#5395 +-0.684513704253056#5396 +-0.6083154269605701#5397 +-0.5260390630042369#5398 +-0.43850669061575864#5399 +-0.34659290432568596#5400 +-0.2512160763039714#5401 +-0.15332918028882067#5402 +-0.05391026978811178#5403 +0.046047294307954255#5404 +0.14554476906050678#5405 +0.24358800859131027#5406 +0.33919739725975856#5407 +0.4314176376585382#5408 +0.5193272956295426#5409 +0.6020480069293945#5410 +0.6787532535546172#5411 +0.7486766220363146#5412 +0.8111194611902097#5413 +0.865457862808335#5414 +0.9111488955436093#5415 +0.9477360297003892#5416 +0.9748536987282782#5417 +0.9922309518422593#5418 +0.9996941612733737#5419 +0.9971687570999949#5420 +0.9846799723258353#5421 +0.9623525907601151#5422 +0.9304097002189882#5423 +0.8891704635058256#5424 +0.8390469294419863#5425 +0.7805399158111991#5426 +0.7142340053538154#5427 +0.6407917048093058#5428 +0.5609468253679145#5429 +0.47549715067181214#5430 +0.3852964656246555#5431 +0.291246025655054#5432 +0.19428555167024208#5433 +0.09538384067540505#5434 +-0.004470914125755297#5435 +-0.1042809970308588#5436 +-0.20304913868434413#5437 +-0.2997884804632161#5438 +-0.3935324348421947#5439 +-0.483344343216756#5440 +-0.568326834686291#5441 +-0.6476307922875124#5442 +-0.7204638370904717#5443 +-0.7860982453869009#5444 +-0.8438782198649527#5445 +-0.8932264421191625#5446 +-0.9336498410251193#5447 +-0.9647445193431539#5448 +-0.9861997893260463#5449 +-0.9978012770082968#5450 +-0.9994330641599263#5451 +-0.9910788465031126#5452 +-0.9728220966191456#5453 +-0.9448452299179868#5454 +-0.9074277820037917#5455 +-0.8609436156475553#5456 +-0.8058571852738867#5457 +-0.742718896285927#5458 +-0.6721596055965009#5459 +-0.5948843183143766#5460 +-0.5116651435662637#5461 +-0.42333357983764397#5462 +-0.3307722069147612#5463 +-0.23490586743913935#5464 +-0.13669242618562055#5465 +-0.0371131993941631#5466 +0.06283685021764836#5467 +0.16215905479318588#5468 +0.25986101969588604#5469 +0.3549665391884163#5470 +0.44652535035771196#5471 +0.533622627827888#5472 +0.6153881243929944#5473 +0.6910048662394316#5474 +0.7597173158782414#5475 +0.8208389212259487#5476 +0.8737589754060353#5477 +0.9179487187301777#5478 +0.952966621890268#5479 +0.9784627975733101#5480 +0.9941824964197943#5481 +0.9999686523950879#5482 +0.9957634521413347#5483 +0.9816089126294156#5484 +0.9576464613392653#5485 +0.9241155231632417#5486 +0.8813511281517454#5487 +0.8297805640037017#5488 +0.7699191067491161#5489 +0.7023648722813098#5490 +0.6277928401806244#5491 +0.5469481095415738#5492 +0.4606384541889888#5493 +0.3697262516689739#5494 +0.27511986665753085#5495 +0.1777645748809813#5496 +0.07863311823337614#5497 +-0.02128401453896417#5498 +-0.12098848447359085#5499 +-0.2194840774648326#5500 +-0.3157866581058347#5501 +-0.40893400284423276#5502 +-0.4979954142018187#5503 +-0.5820810199960956#5504 +-0.6603506646489725#5505 +-0.7320223037435822#5506 +-0.796379817953585#5507 +-0.8527801682707603#5508 +-0.9006598210382154#5509 +-0.9395403785924068#5510 +-0.9690333592544564#5511 +-0.988844078910672#5512 +-0.9987745953988022#5513 +-0.9987256862806896#5514 +-0.9886978402400751#5515 +-0.9687912521998316#5516 +-0.9392048222074141#5517 +-0.9002341680913335#5518 +-0.8522686717455321#5519 +-0.7957875885542126#5520 +-0.7313552588304589#5521 +-0.6596154691143745#5522 +-0.5812850196707813#5523 +-0.497146562457916#5524 +-0.4080407811277736#5525 +-0.3148579911929501#5526 +-0.2185292442883396#5527 +-0.12001702541096315#5528 +-0.02030563608803385#5529 +0.0796086404385363#5530 +0.17872749374496208#5531 +0.27606056101334203#5532 +0.3706353224095644#5533 +0.4615068181800175#5534 +0.5477670903770854#5535 +0.6285542548748294#5536 +0.703061113030274#5537 +0.7705432169454224#5538 +0.830326307744572#5539 +0.8818130525461197#5540 +0.9244890128152635#5541 +0.9579277844637908#5542 +0.9817952583387776#5543 +0.9958529585308029#5544 +0.9999604251464057#5545 +0.994076617736911#5546 +0.9782603253610263#5547 +0.9526695791840002#5548 +0.9175600734824577#5549 +0.8732826108317093#5550 +0.8202795970023783#5551 +0.7590806205881805#5552 +0.6902971615317548#5553 +0.6146164814192049#5554 +0.5327947565895087#5555 +0.44564952267049884#5556 +0.35405150603310986#5557 +0.2589159237813043#5558 +0.16119333920530024#5559 +0.06186016406738981#5560 +-0.03809109738163067#5561 +-0.13766176517685647#5562 +-0.23585696211936405#5563 +-0.33169555426032#5564 +-0.424219954067078#5565 +-0.5125056883212689#5566 +-0.595670635149608#5567 +-0.6728838378940628#5568 +-0.7433738077561016#5569 +-0.8064362322577487#5570 +-0.8614410124990496#5571 +-0.9078385588979957#5572 +-0.9451652825079584#5573 +-0.973048227045201#5574 +-0.9912087953447836#5575 +-0.9994655330113421#5576 +-0.9977359414514271#5577 +-0.9860373021721781#5578 +-0.9644865041102175#5579 +-0.9332988757160339#5580 +-0.8927860334632826#5581 +-0.8433527682799882#5582 +-0.7854930010113974#5583 +-0.7197848473261622#5584 +-0.6468848413756778#5585 +-0.5675213759218636#5586 +-0.48248742447746074#5587 +-0.3926326181768149#5588 +-0.2988547565424325#5589 +-0.20209083696892502#5590 +-0.10330769255477226#5591 +-0.0034923318255946968#5592 +0.09635792312877281#5593 +0.19524540156693176#5594 +0.2921820524921821#5595 +0.3861993169314748#5596 +0.4763578054565078#5597 +0.5617566842523725#5598 +0.6415426759512564#5599 +0.7149185852978462#5600 +0.7811512644608015#5601 +0.8395789384035385#5602 +0.8896178171216423#5603 +0.9307679286796158#5604 +0.9626181147651897#5605 +0.9848501388472685#5606 +0.9972418658901542#5607 +0.9996694818533945#5608 +0.9921087308007481#5609 +0.9746351572574807#5610 +0.9474233513944414#5611 +0.9107452045807868#5612 +0.8649671927352955#5613 +0.8105467146201293#5614 +0.7480275216635965#5615 +0.6780342849756218#5616 +0.6012663538405035#5617 +0.5184907680500401#5618 +0.4305345938954794#5619 +0.3382766603945284#5620 +0.24263877832231104#5621 +0.14457652978281252#5622 +0.045069720348370305#5623 +-0.05488741083372423#5624 +-0.15429612515013374#5625 +-0.2521631635875603#5626 +-0.34751067104847855#5627 +-0.4393859667560341#5628 +-0.5268710631254516#5629 +-0.6090918379925355#5630 +-0.6852267685533883#5631 +-0.7545151397487074#5632 +-0.8162646450771994#5633 +-0.8698583038932945#5634 +-0.9147606260738101#5635 +-0.9505229624582529#5636 +-0.9767879876029256#5637 +-0.993293270058646#5638 +-0.9998738944990372#5639 +-0.996464109499956#5640 +-0.9830979845059883#5641 +-0.9599090694198203#5642 +-0.927129060215757#5643 +-0.885085483910135#5644 +-0.8341984260196418#5645 +-0.7749763332056944#5646 +-0.7080109330434688#5647 +-0.6339713216755684#5648 +-0.5535972784245394#5649 +-0.4676918741624206#5650 +-0.37711344729204793#5651 +-0.28276702751346355#5652 +-0.1855952930663155#5653 +-0.08656915180049524#5654 +0.013321959814158985#5655 +0.1130799628100045#5656 +0.21170810819671795#5657 +0.30822093614772517#5658 +0.4016541223890385#5659 +0.4910741134086396#5660 +0.5755874542145792#5661 +0.6543497154419204#5662 +0.7265739306118212#5663 +0.791538459240455#5664 +0.8485941972321822#5665 +0.897171062513109#5666 +0.9367836911027245#5667 +0.9670362867103555#5668 +0.9876265754008688#5669 +0.9983488258159133#5670 +0.9990959047736466#5671 +0.9898603477080745#5672 +0.970734433252527#5673 +0.941909261222057#5674 +0.9036728432072584#5675 +0.8564072248576555#5676 +0.8005846686078619#5677 +0.7367629349874418#5678 +0.6655797096620707#5679 +0.5877462318891539#5680 +0.5040401880502716#5681 +0.41529794126592323#5682 +0.3224061747316915#5683 +0.22629303227285133#5684 +0.12791884463807107#5685 +0.028266534192014796#5686 +-0.07166820612001427#5687 +-0.17088686140685108#5688 +-0.26839807166219604#5689 +-0.3632275371060979#5690 +-0.45442775306629446#5691 +-0.5410874771316942#5692 +-0.6223408339853317#5693 +-0.6973759669443137#5694 +-0.7654431497634311#5695 +-0.825862277651974#5696 +-0.8780296626559881#5697 +-0.9214240655087582#5698 +-0.9556119036812614#5699 +-0.9802515835954748#5700 +-0.9950969137144907#5701 +-0.9999995644069737#5702 +-0.9949105500078052#5703 +-0.9798807182666571#5704 +-0.9550602422940854#5705 +-0.9206971200814494#5706 +-0.8771346965869603#5707 +-0.8248082331463521#5708 +-0.7642405584854947#5709 +-0.6960368447885882#5710 +-0.620878561017742#5711 +-0.5395166639003695#5712 +-0.4527640946178#5713 +-0.3614876561657189#5714 +-0.26659935254516054#5715 +-0.1690472763199991#5716 +-0.06980613558944763#5717 +0.030132484973073366#5718 +0.12977003170621854#5719 +0.22811095917882387#5720 +0.3241726773507713#5721 +0.4169953692878687#5722 +0.5056515813353825#5723 +0.5892554899283811#5724 +0.6669717524479807#5725 +0.738023853688666#5726 +0.8017018645415418#5727 +0.8573695353713178#5728 +0.904470653212348#5729 +0.942534599264724#5730 +0.9711810511617585#5731 +0.9901237830253536#5732 +0.9991735253403632#5733 +0.9982398560730228#5734 +0.9873321041380214#5735 +0.9665592561870703#5736 +0.936128867650305#5737 +0.8963449889110358#5738 +0.8476051273348236#5739 +0.7903962755072824#5740 +0.7252900453651407#5741 +0.6529369568387209#5742 +0.574059938071828#5743 +0.48944710216270515#5744 +0.3999438725984719#5745 +0.3064445360631003#5746 +0.20988330702048066#5747 +0.11122499335230866#5748 +0.011455356316654522#5749 +-0.08842873885267832#5750 +-0.18742928329404956#5751 +-0.28455709629262965#5752 +-0.37884170884712265#5753 +-0.4693410602752329#5754 +-0.5551509109725986#5755 +-0.6354138772760167#5756 +-0.7093279981575924#5757 +-0.7761547481542365#5758 +-0.8352264164699689#5759 +-0.8859527785214759#5760 +-0.9278269932670445#5761 +-0.9604306673947122#5762 +-0.9834380357699366#5763 +-0.9966192163731373#5764 +-0.9998425072048462#5765 +-0.9930757022085512#5766 +-0.9763864130629667#5767 +-0.9499413936284902#5768 +-0.9140048737977496#5769 +-0.8689359193978601#5770 +-0.8151848445233696#5771 +-0.7532887121466815#5772 +-0.6838659679623627#5773 +-0.6076102610821948#5774 +-0.5252835133225399#5775 +-0.43770830633340774#5776 +-0.3457596626345197#5777 +-0.2503563026795348#5778 +-0.15245146530496573#5779 +-0.053023383282823196#5780 +0.04693449085788134#5781 +0.14642341108041368#5782 +0.24444931698057448#5783 +0.3400327661096653#5784 +0.43221872023967534#5785 +0.5200860877895621#5786 +0.602756927067857#5787 +0.6794052183758368#5788 +0.7492651173233087#5789 +0.8116386068926013#5790 +0.8659024717938725#5791 +0.9115145254262775#5792 +0.9480190272272615#5793 +0.9750512362816127#5794 +0.9923410556921204#5795 +0.9997157312984891#5796 +0.9971015777798035#5797 +0.984524714893898#5798 +0.9621108064973708#5799 +0.9300838049538668#5800 +0.8887637134760895#5801 +0.8385633887594791#5802 +0.779984415854583#5803 +0.713612096495033#5804 +0.6401096009560984#5805 +0.5602113418765098#5806 +0.4747156362501377#5807 +0.3844767289064784#5808 +0.2903962571786933#5809 +0.19341424204141744#5810 +0.09449969573191108#5811 +-0.005359060299902684#5812 +-0.10516427037266961#5813 +-0.2039187138185583#5814 +-0.30063566888253596#5815 +-0.39434877171997756#5816 +-0.48412167198476425#5817 +-0.5690573885324254#5818 +-0.6483072717592313#5819 +-0.7210794830285081#5820 +-0.7866469064605475#5821 +-0.8443544140341247#5822 +-0.8936254114091304#5823 +-0.9339675990666196#5824 +-0.9649778912028727#5825 +-0.9863464432295038#5826 +-0.997859747638167#5827 +-0.9994027672970033#5828 +-0.990960084863636#5829 +-0.9726160568301596#5830 +-0.9445539706609553#5831 +-0.9070542134449333#5832 +-0.8604914703604248#5833 +-0.8053309809447339#5834 +-0.7421238905744688#5835 +-0.6715017436031232#5836 +-0.5941701731786572#5837 +-0.5109018507903337#5838 +-0.4225287659906093#5839 +-0.32993391343054546#5840 +-0.23404247026913375#5841 +-0.13581255210894666#5842 +-0.036225639821747355#5843 +0.06372322708394657#5844 +0.16303539256871574#5845 +0.26071856230327317#5846 +0.35579671834539367#5847 +0.4473198711885637#5848 +0.534373551743106#5849 +0.61608794840904#5850 +0.6916465979460678#5851 +0.7602945433043837#5852 +0.8213458769059611#5853 +0.8741905940063404#5854 +0.9183006876603954#5855 +0.953235424393193#5856 +0.9786457478631875#5857 +0.9942777665178029#5858 +0.9999752903939005#5859 +0.9956813917162614#5860 +0.9814389737010982#5861 +0.9573903418813012#5862 +0.9237757822365931#5863 +0.8809311603354478#5864 +0.8292845654773529#5865 +0.7693520333660359#5866 +0.7017323900512924#5867 +0.6271012686570413#5868 +0.5462043586784855#5869 +0.4598499552991679#5870 +0.3689008831726845#5871 +0.27426587536395725#5872 +0.17689049358883693#5873 +0.07774768047399928#5874 +-0.022171961764168652#5875 +-0.12187006908946504#5876 +-0.22035049096930778#5877 +-0.31662924358157246#5878 +-0.40974434145568117#5879 +-0.4987654093134345#5880 +-0.5828029780712501#5881 +-0.6610173721212264#5882 +-0.7326270990922569#5883 +-0.7969166582634752#5884 +-0.8532436896109454#5885 +-0.9010453920566842#5886 +-0.9398441467909955#5887 +-0.9692522894817371#5888 +-0.9889759836881826#5889 +-0.9988181567776074#5890 +-0.998680469009892#5891 +-0.9885642961156978#5892 +-0.9685707155506215#5893 +-0.9388994965626704#5894 +-0.8998471041639711#5895 +-0.851803736950367#5896 +-0.7952494283660311#5897 +-0.7307492503679691#5898 +-0.6589476674138139#5899 +-0.580562097185996#5900 +-0.4963757423914076#5901 +-0.4072297652588474#5902 +-0.31401488292408225#5903 +-0.21766246767865804#5904 +-0.11913524100583359#5905 +-0.01941765438575316#5906 +0.08049394701832663#5907 +0.17960127951156024#5908 +0.27691409538820333#5909 +0.3714600771593562#5910 +0.46229455262790753#5911 +0.5485099337408607#5912 +0.6292447849091506#5913 +0.7036924301872969#5914 +0.7711090133127998#5915 +0.8308209300720284#5916 +0.8822315587308598#5917 +0.9248272212818289#5918 +0.9581823159449805#5919 +0.9819635696401684#5920 +0.9959333679415077#5921 +0.9999521292421726#5922 +0.9939796994076727#5923 +0.9780757529826917#5924 +0.9523991969427621#5925 +0.917206582948294#5926 +0.8728495439651891#5927 +0.8197712808644788#5928 +0.7585021341057248#5929 +0.6896542847504532#5930 +0.6139156377513494#5931 +0.5320429486333605#5932 +0.4448542622426411#5933 +0.3532207391128595#5934 +0.2580579511171135#5935 +0.1603167333764215#5936 +0.060973683829497964#5937 +-0.038978594611030024#5938 +-0.13854141181881474#5939 +-0.23671996903540732#5940 +-0.3325332985706153#5941 +-0.42502406530739834#5942 +-0.5132681320779048#5943 +-0.5963837933365737#5944 +-0.6735405848704926#5945 +-0.7439675815232989#5946 +-0.806961100024507#5947 +-0.8618917299601419#5948 +-0.908210622633538#5949 +-0.9454549749800931#5950 +-0.9732526537425062#5951 +-0.9913259137032742#5952 +-0.9994941728230944#5953 +-0.997675816556909#5954 +-0.985889013319461#5955 +-0.9642515329525#5956 +-0.9329795700074526#5957 +-0.8923855836009295#5958 +-0.8428751754265166#5959 +-0.7849430371167282#5960 +-0.7191680074477368#5961 +-0.6462072887736614#5962 +-0.5667898804778864#5963 +-0.4817092950521987#5964 +-0.3918156295822699#5965 +-0.29800707185858066#5966 +-0.20122092598092017#5967 +-0.10242424712565217#5968 +-0.0026041790500589026#5969 +0.09724190912177542#5970 +0.19611638828156605#5971 +0.29303133731710534#5972 +0.3870184140934526#5973 +0.47713853080745516#5974 +0.5624912370426562#5975 +0.6422237167722069#5976 +0.7155393094147028#5977 +0.7817054698033725#5978 +0.8400610875352369#5979 +0.8900230925677216#5980 +0.9310922810617849#5981 +0.9628583032616626#5982 +0.9850037635739842#5983 +0.997307391879625#5984 +0.9996462543915937#5985 +0.9919969819687958#5986 +0.9744360036127667#5987 +0.9471387828143523#5988 +0.9103780643805088#5989 +0.8645211492583496#5990 +0.8100262245854944#5991 +0.7474377856356479#5992 +0.6773811954018097#5993 +0.6005564361759669#5994 +0.5177311155574154#5995 +0.42973279677136517#5996 +0.33744072993074997#5997 +0.2417770668597405#5998 +0.14369764725754003#5999 +0.04418244826406843#6000 +-0.055774207147682296#6001 +-0.15517358511811483#6002 +-0.25302251991961405#6003 +-0.34834333734020045#6004 +-0.4401836232810802#6005 +-0.5276257399634938#6006 +-0.6097959946620711#6007 +-0.6858733693537384#6008 +-0.7550977240584129#6009 +-0.8167773919064145#6010 +-0.8702960900451931#6011 +-0.9151190773338755#6012 +-0.9507984972999824#6013 +-0.9769778529732608#6014 +-0.9933955688855672#6015 +-0.9998876046464816#6016 +-0.9963890939806623#6017 +-0.9829349928502283#6018 +-0.9596597301863407#6019 +-0.926795864719758#6020 +-0.8846717613308728#6021 +-0.8337083101363698#6022 +-0.7744147210943076#6023 +-0.70738343614654#6024 +-0.6332842097346686#6025 +-0.5528574168350533#6026 +-0.46690665537678444#6027 +-0.37629071695680905#6028 +-0.28191500607817316#6029 +-0.18472249364751417#6030 +-0.0856842951214665#6031 +0.014210032557972981#6032 +0.11396237828930539#6033 +0.21257604960772433#6034 +0.3090657313067615#6035 +0.40246733038212795#6036 +0.491847608930326#6037 +0.5763135087532935#6038 +0.6550210745007133#6039 +0.7271838861928992#6040 +0.7920809168692764#6041 +0.8490637368514327#6042 +0.8975629926381219#6043 +0.9370940956972457#6044 +0.9672620643142826#6045 +0.9877654701190156#6046 +0.9983994498581685#6047 +0.9990577523213141#6048 +0.9897337999678465#6049 +0.9705207546475926#6050 +0.9416105867584041#6051 +0.903292157141399#6052 +0.8559483308789219#6053 +0.8000521518331991#6054 +0.7361621161484359#6055 +0.6649165919419564#6056 +0.5870274409409932#6057 +0.5032729057956179#6058 +0.4144898341354351#6059 +0.3215653170646921#6060 +0.22542782564119876#6061 +0.1270379339004295#6062 +0.027378721117284403#6063 +-0.07255405079706279#6064 +-0.17176188661902594#6065 +-0.26925353444682204#6066 +-0.3640548899618095#6067 +-0.4552187293568439#6068 +-0.5418341736834483#6069 +-0.6230357900531704#6070 +-0.6980122387569291#6071 +-0.7660143799031949#6072 +-0.8263627585761534#6073 +-0.8784543937246257#6074 +-0.9217688029494135#6075 +-0.9558732029913825#6076 +-0.980426833958729#6077 +-0.9951843640871785#6078 +-0.9999983410138783#6079 +-0.994820665072666#6080 +-0.9797030698900342#6081 +-0.9547966054798351#6082 +-0.9203501290014732#6083 +-0.876707818261429#6084 +-0.8243057328023874#6085 +-0.7636674569404289#6086 +-0.6953988682836173#6087 +-0.620182084003217#6088 +-0.5387686453443945#6089 +-0.45197200847452446#6090 +-0.36065941669805746#6091 +-0.26574323524809457#6092 +-0.1681718352345661#6093 +-0.06892011783359091#6094 +0.031020226602815813#6095 +0.1306506271889307#6096 +0.22897560989552862#6097 +0.3250127439973229#6098 +0.4178024581960238#6099 +0.5064176283395591#6100 +0.5899728409401348#6101 +0.6676332399331268#6102 +0.7386228682829117#6103 +0.8022324210890692#6104 +0.8578263327264827#6105 +0.9048491272069747#6106 +0.9428309683117653#6107 +0.9713923540396625#6108 +0.9902479084656121#6109 +0.9992092331226073#6110 +0.9981867894168958#6111 +0.98719079326801#6112 +0.9663311130346763#6113 +0.935816171746493#6114 +0.8959508646099132#6115 +0.8471335125961273#6116 +0.789851882549586#6117 +0.7246783135829253#6118 +0.6522639984537427#6119 +0.5733324770618192#6120 +0.4886724070776113#6121 +0.39912968393550297#6122 +0.3055989889262417#6123 +0.20901484983722315#6124 +0.1103423034597536#6125 +0.010567253260429845#6126 +-0.08931338144040267#6127 +-0.188301626356961#6128 +-0.2854084236672018#6129 +-0.37966351435164025#6130 +-0.47012513270074757#6131 +-0.5558894161266145#6132 +-0.6360994362591523#6133 +-0.7099537610911038#6134 +-0.7767144626217417#6135 +-0.8357144899895256#6136 +-0.8863643344238125#6137 +-0.9281579194216271#6138 +-0.9606776572967937#6139 +-0.9835986215780596#6140 +-0.9966917935669896#6141 +-0.9998263506170976#6142 +-0.9929709732704858#6143 +-0.9761941581915149#6144 +-0.9496635337707765#6145 +-0.9136441852376241#6146 +-0.8684960060161877#6147 +-0.8146701017892441#6148 +-0.7527042831993508#6149 +-0.683217692222682#6150 +-0.6069046159070638#6151 +-0.5245275492852929#6152 +-0.4369095767768165#6153 +-0.34492614820028883#6154 +-0.24949633156836795#6155 +-0.151573630063937#6156 +-0.052136454951487186#6157 +0.04782165038481744#6158 +0.14730193759821267#6159 +0.2453104325426728#6160 +0.34086786673401337#6161 +0.4330194618768823#6162 +0.520844469693879#6163 +0.6034653717379834#6164 +0.6800566472668097#6165 +0.7498530215729831#6166 +0.8121571123560498#6167 +0.8663463977358996#6168 +0.9118794362856127#6169 +0.9483012769352218#6170 +0.9752480046924157#6171 +0.9924503767608481#6172 +0.9997365127251596#6173 +0.997033611923271#6174 +0.9843686808465345#6175 +0.9618682632997994#6176 +0.9297571760175435#6177 +0.888356262369377#6178 +0.8380791865991503#6179 +0.7794283006285677#6180 +0.7129896247228424#6181 +0.6394269921699185#6182 +0.5594754164776916#6183 +0.47393374736200167#6184 +0.38365668890433663#6185 +0.28954625963117797#6186 +0.1925427798430516#6187 +0.09361547624491363#6188 +-0.00624720224670175#6189 +-0.10604746075851858#6190 +-0.2047881280970657#6191 +-0.30148262015362104#6192 +-0.3951647975265046#6193 +-0.4848986188666166#6194 +-0.5697874934931841#6195 +-0.6489832398314691#6196 +-0.7216945601626925#6197 +-0.7871949470092712#6198 +-0.844829942157383#6199 +-0.8940236757871044#6200 +-0.9342846203732933#6201 +-0.9652105018661431#6202 +-0.9864923190805144#6203 +-0.9979174311336345#6204 +-0.9993716820825086#6205 +-0.9908405415323671#6206 +-0.9724092498195667#6207 +-0.9442619663183269#6208 +-0.9066799293811373#6209 +-0.8600386462981047#6210 +-0.8048041413522367#6211 +-0.7415282994588526#6212 +-0.6708433519139391#6213 +-0.593455559348028#6214 +-0.5101381550034353#6215 +-0.4217236188433001#6216 +-0.32909535968697506#6217 +-0.23317888848111895#6218 +-0.13493257090025113#6219 +-0.03533805167372523#6220 +0.06460955368391785#6221 +0.16391160173822988#6222 +0.2615758992499447#6223 +0.35662661684184926#6224 +0.4481140391633548#6225 +0.5351240541323454#6226 +0.6167872864409377#6227 +0.6922877840661794#6228 +0.7608711709929451#6229 +0.8218521846897158#6230 +0.8746215230252763#6231 +0.9186519322142014#6232 +0.9535034749623935#6233 +0.978827926175101#6234 +0.9943722523069567#6235 +0.9999811395895223#6236 +0.9955985458751219#6237 +0.9812682605914571#6238 +0.9571334672121197#6239 +0.9234353126146541#6240 +0.8805104976206695#6241 +0.8287879127925286#6242 +0.768784353100621#6243 +0.7010993542788487#6244 +0.6264092024617534#6245 +0.5454601769570099#6246 +0.45906109366927184#6247 +0.36807522367901085#6248 +0.27341166772324016#6249 +0.17601627276145895#6250 +0.07686218138548857#6251 +-0.02305989149962678#6252 +-0.12275155757146444#6253 +-0.22121673065631767#6254 +-0.317471579292981#6255 +-0.4105543568514991#6256 +-0.4995350109875823#6257 +-0.5835244764181962#6258 +-0.6616835581679836#6259 +-0.7332313165280581#6260 +-0.7974528699474296#6261 +-0.8537065378931546#6262 +-0.9014302523101099#6263 +-0.9401471736192033#6264 +-0.969470455140827#6265 +-0.9891071083390048#6266 +-0.9988609302659951#6267 +-0.9986344639572882#6268 +-0.9884299721893809#6269 +-0.9683494148708616#6270 +-0.9385934302927073#6271 +-0.8994593304168023#6272 +-0.8513381302330933#6273 +-0.7947106408670623#6274 +-0.7301426654738955#6275 +-0.6582793459203868#6276 +-0.57983871674066#6277 +-0.49560453077245464#6278 +-0.40641842815784546#6279 +-0.31317152695315215#6280 +-0.21679551937188488#6281 +-0.11825336262412364#6282 +-0.018529657366386256#6283 +0.08137919010266577#6284 +0.18047492360459536#6285 +0.27776741132694516#6286 +0.37228453889301355#6287 +0.46308192240736856#6288 +0.5492523444275588#6289 +0.6299348185809126#6290 +0.7043231922557696#6291 +0.7716742014118969#6292 +0.8313148970290903#6293 +0.8826493689913352#6294 +0.9251647002237049#6295 +0.9584360915902255#6296 +0.9821311063464223#6297 +0.9960129917373818#6298 +0.9999430445530186#6299 +0.9938819970047018#6300 +0.9778904090760181#6301 +0.9521280634274347#6302 +0.9168523689007734#6303 +0.8724157885751502#6304 +0.8192623180723986#6305 +0.7579230492995809#6306 +0.6890108639542089#6307 +0.6132143098129139#6308 +0.5312907209896665#6309 +0.4440586509036509#6310 +0.3523896935640783#6311 +0.25719977489095747#6312 +0.15944000108606712#6313 +0.06008715549418129#6314 +-0.03986606109322982#6315 +-0.13942094917616493#6316 +-0.23758278922136963#6317 +-0.3333707805711021#6318 +-0.42582784127909545#6319 +-0.514030170956996#6320 +-0.5970964810824756#6321 +-0.6741968005428316#6322 +-0.7445607684319929#6323 +-0.807485331242046#6324 +-0.8623417675414878#6325 +-0.9085819699519408#6326 +-0.9457439216558984#6327 +-0.9734563127160425#6328 +-0.9914422500813985#6329 +-0.9995220242111722#6330 +-0.9976149046730771#6331 +-0.9857399467751279#6332 +-0.9640158011713017#6333 +-0.9326595283434245#6334 +-0.8919844298045866#6335 +-0.8423969176939883#6336 +-0.7843924540411868#6337 +-0.7185506002732748#6338 +-0.645529226428678#6339 +-0.5660579379371954#6340 +-0.4809307856437185#6341 +-0.390998331914669#6342 +-0.2971591520999911#6343 +-0.20035085626528476#6344 +-0.10154072090196273#6345 +-0.0017160242202876055#6346 +0.09812581840815446#6347 +0.19698722029514487#6348 +0.29388039099226304#6349 +0.3878372059665269#6350 +0.47791887978070685#6351 +0.5632253461270936#6352 +0.6429042509925226#6353 +0.7161594690979219#6354 +0.7822590585189381#6355 +0.840542574007695#6356 +0.8904276659433977#6357 +0.9314158989772433#6358 +0.963097732233666#6359 +0.9851566113073892#6360 +0.9973721311704039#6361 +0.9996222383861532#6362 +0.9918844506271235#6363 +0.9742360813108307#6364 +0.946853467109708#6365 +0.9100102060533641#6366 +0.8640744238275117#6367 +0.8095050955838005#6368 +0.7468474600118203#6369 +0.6767275714943461#6370 +0.5998460447788914#6371 +0.5169710546667434#6372 +0.4289306606642735#6373 +0.33660453328606976#6374 +0.2409151646779356#6375 +0.142818651380304#6376 +0.04329514132764921#6377 +-0.05666095946568067#6378 +-0.15605092268165224#6379 +-0.25388167666176487#6380 +-0.3491757288507966#6381 +-0.4409809325792998#6382 +-0.5283800005983845#6383 +-0.6104996703106945#6384 +-0.6865194291216177#6385 +-0.7556797127299064#6386 +-0.8172894944430965#6387 +-0.8707331896877957#6388 +-0.9154768067272556#6389 +-0.9510732821302911#6390 +-0.9771669476813053#6391 +-0.9934970840995313#6392 +-0.9999005260599038#6393 +-0.9963132924870508#6394 +-0.9827712258330508#6395 +-0.9594096339514985#6396 +-0.9264619381461588#6397 +-0.8842573409024587#6398 +-0.8332175366050724#6399 +-0.7738524981070234#6400 +-0.7067553812495116#6401 +-0.6325965982448198#6402 +-0.5521171191390967#6403 +-0.466121068284588#6404 +-0.3754676897949175#6405 +-0.2810627622619315#6406 +-0.1838495485154199#6407 +-0.08479937085272225#6408 +0.015098094092590981#6409 +0.11484470387249736#6410 +0.21344382333392106#6411 +0.30991028266773873#6412 +0.4032802208998583#6413 +0.49262071647146216#6414 +0.5770391086828398#6415 +0.6556919168640254#6416 +0.7277932681548336#6417 +0.7926227496867044#6418 +0.8495326067099487#6419 +0.8979542147450874#6420 +0.9374037610906888#6421 +0.9674870789199537#6422 +0.9879035856653547#6423 +0.9984492863402916#6424 +0.9990188117895656#6425 +0.9896064715031475#6426 +0.9703063104738733#6427 +0.9413111695309624#6428 +0.9029107585381975#6429 +0.8554887617087299#6430 +0.799519003959252#6431 +0.7355607166080547#6432 +0.6642529497205526#6433 +0.5863081869322719#6434 +0.5025052265478807#6435 +0.41368140004596415#6436 +0.32072420573967675#6437 +0.2245624411869641#6438 +0.12615692295238418#6439 +0.026490886445597783#6440 +-0.07343983824183033#6441 +-0.17263677634152869#6442 +-0.2701087848381528#6443 +-0.3648819556427663#6444 +-0.4560093465605342#6445 +-0.5425804428241162#6446 +-0.623730254656246#6447 +-0.698647959961658#6448 +-0.7665850057934409#6449 +-0.8268625876466449#6450 +-0.8788784318485121#6451 +-0.9221128132779292#6452 +-0.9561337482870396#6453 +-0.9806013109390582#6454 +-0.9952710294358666#6455 +-0.9999963287994093#6456 +-0.9947299954004215#6457 +-0.9795246487014079#6458 +-0.9545322155003655#6459 +-0.9200024119284395#6460 +-0.876280248368885#6461 +-0.8238025822273635#6462 +-0.7630937529971512#6463 +-0.694760343232246#6464 +-0.6194851177749968#6465 +-0.5380202017954916#6466 +-0.45117956580547686#6467 +-0.35983089273406754#6468 +-0.264886908326737#6469 +-0.16729626149137494#6470 +-0.06803404571198197#6471 +0.031907943763099904#6472 +0.13153111961146466#6473 +0.2298400799910786#6474 +0.32585255426645#6475 +0.4186092175321232#6476 +0.5071832758700237#6477 +0.5906897265679296#6478 +0.6682942007740298#6479 +0.7392213002346851#6480 +0.8027623448174664#6481 +0.8582824534087788#6482 +0.9052268874360858#6483 +0.943126593632353#6484 +0.9716028906612442#6485 +0.9903712527758591#6486 +0.999244152705944#6487 +0.9981329353683882#6488 +0.9870487036795089#6489 +0.9661022076183817#6490 +0.9355027376496583#6491 +0.8955560335624265#6492 +0.8466612296193012#6493 +0.7893068665388091#6494 +0.7240660101580189#6495 +0.6515905255481277#6496 +0.572604563794148#6497 +0.4878973265166385#6498 +0.39831518042998615#6499 +0.3047532007259689#6500 +0.20814622777831115#6501 +0.10945952652668677#6502 +0.009679141868516105#6503 +-0.0901979535757059#6504 +-0.18917382088327842#6505 +-0.28625952590513565#6506 +-0.3804850203689661#6507 +-0.47090883428089403#6508 +-0.5566274827824501#6509 +-0.6367844934726242#6510 +-0.7105789639969848#6511 +-0.7772735643992611#6512 +-0.8362019042785367#6513 +-0.8867751911418572#6514 +-0.9284881134241899#6515 +-0.9609238893945486#6516 +-0.9837584315012794#6517 +-0.9967635845477477#6518 +-0.9998094053436452#6519 +-0.9928654610543938#6520 +-0.9760011332759688#6521 +-0.9493849247969268#6522 +-0.9132827759742418#6523 +-0.8680554075451663#6524 +-0.8141547164248637#6525 +-0.7521192605018084#6526 +-0.6825688775453889#6527 +-0.6061984919918056#6528 +-0.5237711714888175#6529 +-0.43611050257604106#6530 +-0.3440923616804886#6531 +-0.24863616364883562#6532 +-0.15069567525819083#6533 +-0.051249485493732934#6534 +0.04870877218895102#6535 +0.14818034792090215#6536 +0.2461713545983377#6537 +0.3417026984740565#6538 +0.4338198619385158#6539 +0.5216024407442641#6540 +0.6041733403809366#6541 +0.6807075397136739#6542 +0.7504403343215857#6543 +0.8126749771715466#6544 +0.8667896402842373#6545 +0.912243627833765#6546 +0.9485827786016253#6547 +0.9754440038054716#6548 +0.9925589149622076#6549 +0.9997565055369927#6550 +0.9969648595840104#6551 +0.9842118703068278#6552 +0.9616249613587246#6553 +0.9294298136676707#6554 +0.8879481105070949#6555 +0.8375943233429495#6556 +0.7788715705718298#6557 +0.7123665905282638#6558 +0.6387438789892236#6559 +0.5587390497519747#6560 +0.47315148462417583#6561 +0.3828363462650965#6562 +0.28869603368300556#6563 +0.1916711657625737#6564 +0.09273118291190512#6565 +-0.0071353392655659825#6566 +-0.10693056749172508#6567 +-0.20565738083405258#6568 +-0.30232933360837705#6569 +-0.395980511618076#6570 +-0.48567518324943976#6571 +-0.5705171489926438#6572 +-0.6496586959710069#6573 +-0.7223090680078381#6574 +-0.7877423666007652#6575 +-0.8453048038596203#6576 +-0.8944212349389244#6577 +-0.9346009046950666#6578 +-0.9654423511494763#6579 +-0.9866374167640076#6580 +-0.9979743274491972#6581 +-0.9993398085409632#6582 +-0.9907202166036044#6583 +-0.9722016757505011#6584 +-0.9439692171204415#6585 +-0.9063049301076473#6586 +-0.8595851438177926#6587 +-0.8042766669119777#6588 +-0.7409321234088941#6589 +-0.6701844310483026#6590 +-0.5927404773861927#6591 +-0.5093740568079891#6592 +-0.4209181390308347#6593 +-0.3282565463455203#6594 +-0.2323151227563079#6595 +-0.13405248325368307#6596 +-0.0344504356502464#6597 +0.06549582931840771#6598 +0.1647876816105547#6599 +0.2624330298596137#6600 +0.35745623402314036#6601 +0.44890785365562746#6602 +0.5358741344035932#6603 +0.6174861379370337#6604 +0.6929284240939841#6605 +0.7614471984890684#6606 +0.8223578441778256#6607 +0.8750517621229162#6608 +0.9190024521145261#6609 +0.9537707733864255#6610 +0.9790093323653442#6611 +0.9944659537127232#6612 +0.9999861999773392#6613 +0.995514914683267#6614 +0.9810967734351546#6615 +0.9568758375343491#6616 +0.9230941145659948#6617 +0.8800891403392386#6618 +0.8282906063409999#6619 +0.7682160664006705#6620 +0.7004657654633318#6621 +0.625716642140678#6622 +0.5447155649641743#6623 +0.4582718699215725#6624 +0.36724927383925204#6625 +0.272557244409198#6626 +0.17514191308845256#6627 +0.07597662166634576#6628 +-0.023947803044919447#6629 +-0.12363294922425093#6630 +-0.22208279584255267#6631 +-0.3183136645756067#6632 +-0.411364048392728#6633 +-0.5003042186171828#6634 +-0.5842455144677996#6635 +-0.6623492222637417#6636 +-0.7338349555743653#6637 +-0.7979884525824719#6638 +-0.8541687127522828#6639 +-0.9018144014949061#6640 +-0.9404494588379959#6641 +-0.969687856059632#6642 +-0.9892374527597048#6643 +-0.9989029158302245#6644 +-0.9985876711591678#6645 +-0.9882948685670818#6646 +-0.9681273503351187#6647 +-0.9382866236389569#6648 +-0.8990708471557118#6649 +-0.8508718519609921#6650 +-0.7941712264823142#6651 +-0.7295355046267261#6652 +-0.6576105051612804#6653 +-0.5791148789053921#6654 +-0.4948329282094064#6655 +-0.4056067704647689#6656 +-0.3123279239454181#6657 +-0.2159284000518886#6658 +-0.117371390961479#6659 +-0.017641645730405324#6660 +0.08226436899325389#6661 +0.18134842533491713#6662 +0.2786205081564525#6663 +0.3731087069601824#6664 +0.46386892689730536#6665 +0.5499943218515493#6666 +0.6306243553458014#6667 +0.7049533987381323#6668 +0.7722387807968807#6669 +0.8318082082261052#6670 +0.8830664829979679#6671 +0.9255014493746805#6672 +0.958689111199342#6673 +0.9822978683253825#6674 +0.9960918298556162#6675 +0.9999331710861101#6676 +0.9937835106050681#6677 +0.977704293787209#6678 +0.9518561788518946#6679 +0.9164974316193079#6680 +0.871981345003749#6681 +0.8187527090276192#6682 +0.7573433666265443#6683 +0.6883668996505666#6684 +0.6125124981571216#6685 +0.5305380742518008#6686 +0.4432626892811246#6687 +0.3515583700423137#6688 +0.25634139577978515#6689 +0.15856314302582344#6690 +0.05920057976075344#6691 +-0.04075349612817637#6692 +-0.14030037655510802#6693 +-0.2384454219966389#6694 +-0.3342079996011555#6695 +-0.42663128134813255#6696 +-0.514791804357429#6697 +-0.5978086978251298#6698 +-0.674852484393442#6699 +-0.7451533680142645#6700 +-0.8080089254968401#6701 +-0.8627911248880876#6702 +-0.908952600560277#6703 +-0.9460321223074467#6704 +-0.973659203805159#6705 +-0.9915578043873877#6706 +-0.9995490871536059#6707 +-0.9975532058479801#6708 +-0.9855901026567658#6709 +-0.9637793089525735#6710 +-0.9323387509764054#6711 +-0.8915825723906932#6712 +-0.8419179954596638#6713 +-0.783841252219086#6714 +-0.7179326262898007#6715 +-0.6448506548755989#6716 +-0.5653255488771634#6717 +-0.4801518968661259#6718 +-0.39018072581871516#6719 +-0.2963109979355221#6720 +-0.1994806285083495#6721 +-0.10065711458064946#6722 +-8.278680368774796E-4#6723 +0.0990096502906622#6724 +0.1978578969207362#6725 +0.2947292128479025#6726 +0.388655691904816#6727 +0.4786988517607058#6728 +0.5639590109266028#6729 +0.6435842780753824#6730 +0.7167790638583078#6731 +0.7828120301708148#6732 +0.8410233974411052#6733 +0.8908315369295339#6734 +0.9317387821707139#6735 +0.963336401492333#6736 +0.9853086819269133#6737 +0.997436083711423#6738 +0.9995974338560171#6739 +0.9917711368644981#6740 +0.9740353905093757#6741 +0.9465674045055719#6742 +0.9096416298895278#6743 +0.863627016795169#6744 +0.8089833280261255#6745 +0.746256545257776#6746 +0.6760734137688245#6747 +0.59913518020965#6748 +0.5162105859775773#6749 +0.42812818620694754#6750 +0.33576807112009877#6751 +0.24005307245678428#6752 +0.14193954284447627#6753 +0.04240780023904047#6754 +-0.05754766708822902#6755 +-0.15692813714868228#6756 +-0.2547406331362906#6757 +-0.3500078449236578#6758 +-0.4417778940217574#6759 +-0.5291338444351459#6760 +-0.6112028643833304#6761 +-0.6871649473473994#6762 +-0.7562611053041018#6763 +-0.8178009522832872#6764 +-0.8711696024763078#6765 +-0.9158338139717653#6766 +-0.9513473167324222#6767 +-0.977355271577897#6768 +-0.9935978156204607#6769 +-0.9999126587291108#6770 +-0.9962367050789155#6771 +-0.9826066835836388#6772 +-0.9591587809125754#6773 +-0.9261272807583686#6774 +-0.8838422229517972#6775 +-0.8327261058128828#6776 +-0.7732896646873357#6777 +-0.7061267688478077#6778 +-0.6319084877484257#6779 +-0.5513763859206331#6780 +-0.4653351135055202#6781 +-0.37464436645559573#6782 +-0.28021029673700776#6783 +-0.18297645835863166#6784 +-0.08391437969231084#6785 +0.0159861437174899#6786 +0.11572693886358196#6787 +0.21431142869078854#6788 +0.31075458956445545#6789 +0.40409279330100306#6790 +0.4933934354222034#6791 +0.5777642534308487#6792 +0.6563622420026807#6793 +0.72840207601693#6794 +0.793163957265329#6795 +0.8500008064378751#6796 +0.8983447285254006#6797 +0.9377126870387825#6798 +0.967711330349872#6799 +0.9880409219309375#6800 +0.9984983352229706#6801 +0.9989790832091183#6802 +0.9894783624144172#6803 +0.9700911009005274#6804 +0.9410110097759191#6805 +0.9025286476985094#6806 +0.8550285177095982#6807 +0.7989852254065796#6808 +0.7349587368406961#6809 +0.6635887835213552#6810 +0.585588470430354#6811 +0.5017371509126227#6812 +0.41287263963522164#6813 +0.3198828414201331#6814 +0.22369687959278223#6815 +0.1252758124888965#6816 +0.02560303087729906#6817 +-0.07432556775558767#6818 +-0.17351152988422644#6819 +-0.27096382216154746#6820 +-0.3657087334965602#6821 +-0.4567996040537086#6822 +-0.5433262839650238#6823 +-0.6244242272467491#6824 +-0.699283130057029#6825 +-0.7671550269840464#6826 +-0.8273617644691722#6827 +-0.8793017766931565#6828 +-0.9224560962229421#6829 +-0.9563935393627088#6830 +-0.980775014398831#6831 +-0.9953569096921918#6832 +-0.9999935277651537#6833 +-0.9946385410625938#6834 +-0.9793454548415207#6835 +-0.9542670725642333#6836 +-0.9196539691366354#6837 +-0.8758519872466048#6838 +-0.823298781818177#6839 +-0.7625194471082125#6840 +-0.6941212701381572#6841 +-0.6187876628828645#6842 +-0.5372713338440499#6843 +-0.45038676723575394#6844 +-0.3590020849273077#6845 +-0.26403037245657784#6846 +-0.16642055578109807#6847 +-0.06714791992357462#6848 +0.03279563575367421#6849 +0.13241150827926804#6850 +0.23070436878356018#6851 +0.32669210749569116#6852 +0.4194156466597768#6853 +0.5079485233228161#6854 +0.59140614624627#6855 +0.6689546344493088#6856 +0.7398191490719298#6857 +0.8032916353087174#6858 +0.858737897058408#6859 +0.9056039336016954#6860 +0.9434214749932913#6861 +0.9718126608604276#6862 +0.9904938158587981#6863 +0.9992782840628278#6864 +0.9980782939699812#6865 +0.986905835484602#6866 +0.9658725401187522#6867 +0.9351885656070448#6868 +0.8951604960800272#6869 +0.846188278776893#6870 +0.7887612279048725#6871 +0.72345313557342#6872 +0.6509165386531266#6873 +0.571876198843009#6874 +0.4871218610911878#6875 +0.3975003627244203#6876 +0.3039071721294589#6877 +0.20727744152893346#6878 +0.1085766632494626#6879 +0.008791022841475713#6880 +-0.09108245456081744#6881 +-0.19004586618499503#6882 +-0.2871104023350624#6883 +-0.3813062262510775#6884 +-0.4716921643974707#6885 +-0.5573651103579016#6886 +-0.637469048376044#6887 +-0.7112036063820617#6888 +-0.7778320530457624#6889 +-0.8366886589525186#6890 +-0.8871853483515171#6891 +-0.9288175750142688#6892 +-0.9611693634937438#6893 +-0.9839174654135346#6894 +-0.9968345892587814#6895 +-0.9997916713978559#6896 +-0.9927591656435055#6897 +-0.9758073384685907#6898 +-0.9491055669267142#6899 +-0.9129206462926903#6900 +-0.86761412433235#6901 +-0.813638688836776#6902 +-0.7515336445155336#6903 +-0.6819195244422828#6904 +-0.605491889893427#6905 +-0.5230143805297617#6906 +-0.43531108436140914#6907 +-0.3432583037328287#6908 +-0.24777579959945775#6909 +-0.1498176015802779#6910 +-0.050362475609222065#6911 +0.04959585557050026#6912 +0.14905864135557212#6913 +0.24703208246845434#6914 +0.34253726067126045#6915 +0.43461991979320214#6916 +0.5223600003428128#6917 +0.6048808324382549#6918 +0.6813578952029908#6919 +0.7510270551058309#6920 +0.813192200930588#6921 +0.867232199089246#6922 +0.9126070997834519#6923 +0.9488635320044169#6924 +0.975639233466172#6925 +0.9926666702105814#6926 +0.9997757097182173#6927 +0.9968953208162551#6928 +0.9840542833984735#6929 +0.9613809008660682#6930 +0.9291017181624794#6931 +0.8875392582112024#6932 +0.8371087993733477#6933 +0.7783142261235303#6934 +0.7117429944027603#6935 +0.6380602619528687#6936 +0.558002242280222#6937 +0.47236884865372675#6938 +0.38201570163586274#6939 +0.28784558000485344#6940 +0.19079940048753272#6941 +0.09184681643043616#6942 +-0.008023470655912756#6943 +-0.10781358987567453#6944 +-0.20652647134383265#6945 +-0.30317580857889714#6946 +-0.39679591335123815#6947 +-0.4864513645206622#6948 +-0.5712463544552357#6949 +-0.6503336396450295#6950 +-0.7229230060792073#6951 +-0.7882891648032128#6952 +-0.8457789987662547#6953 +-0.8948180885509868#6954 +-0.9349164517824474#6955 +-0.9656734388699845#6956 +-0.9867817361655272#6957 +-0.998030436539974#6958 +-0.9993071466975093#6959 +-0.9905991101722632#6960 +-0.9719933347867018#6961 +-0.9436757232982262#6962 +-0.9059292159202714#6963 +-0.8591309632772218#6964 +-0.8037485580400412#6965 +-0.7403353628948707#6966 +-0.6695249815259856#6967 +-0.592024927857224#6968 +-0.508609556806733#6969 +-0.42011232718859376#6970 +-0.3274174740678562#6971 +-0.23145117377605856#6972 +-0.1331722898634756#6973 +-0.03356279245148251#6974 +0.0663820532883018#6975 +0.16566363149461852#6976 +0.2632899534561562#6977 +0.3582855692348461#6978 +0.449701314039203#6979 +0.5366237919651687#6980 +0.618184502346058#6981 +0.6935685175241308#6982 +0.7620226253383701#6983 +0.8228628549714151#6984 +0.8754813109598781#6985 +0.9193522470848716#6986 +0.9540373194544375#6987 +0.9791899662908198#6988 +0.9945588706611886#6989 +0.9999904715533596#6990 +0.9954304982066668#6991 +0.9809245123674635#6992 +0.9566174530512137#6993 +0.92275218835976#6994 +0.8796670888235313#6995 +0.8277926465150534#6996 +0.767647173714462#6997 +0.699831624104531#6998 +0.6250235882401227#6999 +0.5439705232873457#7000 +0.45748228467862745#7001 +0.3664230343049359#7002 +0.2717026060958192#7003 +0.17426741525953252#7004 +0.07509100201512046#7005 +-0.024835695699641874#7006 +-0.12451424335256278#7007 +-0.22294868584484095#7008 +-0.3191554987651938#7009 +-0.4121734154406648#7010 +-0.5010730315954676#7011 +-0.5849660916512891#7012 +-0.6630143638834097#7013 +-0.7344380157550146#7014 +-0.7985234057461226#7015 +-0.8546302138237558#7016 +-0.9021978393080471#7017 +-0.9407510022089238#7018 +-0.9699044920666614#7019 +-0.9893670168474638#7020 +-0.9989441134371765#7021 +-0.9985400906524421#7022 +-0.9881589853553737#7023 +-0.9679045221185625#7024 +-0.9379790768434352#7025 +-0.8986816546871441#7026 +-0.8504049025018744#7027 +-0.7936311856372888#7028 +-0.7289277683054031#7029 +-0.6569411456640912#7030 +-0.5783905842511721#7031 +-0.4940609353109204#7032 +-0.40479479281987163#7033 +-0.3114840745663333#7034 +-0.21506111040267262#7035 +-0.11648932671361892#7036 +-0.016753620178294085#7037 +0.0831494829918418#7038 +0.1822217840134876#7039 +0.27947338520378323#7040 +0.37393258071074015#7041 +0.46465556547691106#7042 +0.5507358654275436#7043 +0.6313133946598948#7044 +0.7055830491372643#7045 +0.7728027510223979#7046 +0.8323008632739383#7047 +0.8834829004217286#7048 +0.9258374684691203#7049 +0.9589413745727422#7050 +0.9824638554455033#7051 +0.9961698822340214#7052 +0.9999225088492355#7053 +0.9936842402864599#7054 +0.9775174072630763#7055 +0.9515835434306101#7056 +0.9161417713838799#7057 +0.8715462135936842#7058 +0.8182424541321317#7059 +0.756763086543882#7060 +0.6877223923475002#7061 +0.6118102033375776#7062 +0.5297850090134684#7063 +0.44246637800293476#7064 +0.35072676920333273#7065 +0.2554828144607054#7066 +0.15768615988737594#7067 +0.05831395732856547#7068 +-0.041640899015840796#7069 +-0.14117969326193175#7070 +-0.2393078666807508#7071 +-0.33504495500035825#7072 +-0.427434384880738#7073 +-0.5155530316784099#7074 +-0.5985204430027234#7075 +-0.6755076359051054#7076 +-0.7457453798026574#7077 +-0.8085318823758662#7078 +-0.863239801645478#7079 +-0.9093225141661847#7080 +-0.9463195767073986#7081 +-0.9738613268498107#7082 +-0.99167257653009#7083 +-0.9995753616290475#7084 +-0.9974907201302877#7085 +-0.9854394810825754#7086 +-0.9635420564828655#7087 +-0.932017238159432#7088 +-0.8911800116762435#7089 +-0.8414384091013278#7090 +-0.783289432085226#7091 +-0.7173140859847869#7092 +-0.6441715746496963#7093 +-0.5645927138755155#7094 +-0.47937262933382613#7095 +-0.38936281193935457#7096 +-0.2954626100342169#7097 +-0.1986102433965698#7098 +-0.09977342885872108#7099 +6.0288799573731514E-5#7100 +0.09989340407211203#7101 +0.19872841747153056#7102 +0.2955778022144536#7103 +0.3894738712626798#7104 +0.47947844613219254#7105 +0.5646922308624522#7106 +0.6442637974843658#7107 +0.7173980932071098#7108 +0.7833643843228061#7109 +0.8415035574561832#7110 +0.8912347052075476#7111 +0.9320609303874993#7112 +0.9635743108493957#7113 +0.9854599753126002#7114 +0.9974992494522351#7115 +0.9995718408207521#7116 +0.9916570407703045#7117 +0.9738339313667114#7118 +0.9462805952275968#7119 +0.909272336179741#7120 +0.8631789285142464#7121 +0.8084609223240518#7122 +0.745665041839642#7123 +0.675418722741259#7124 +0.5984238430289884#7125 +0.5154497100897922#7126 +0.4273253740323974#7127 +0.3349313440926573#7128 +0.23919079087632442#7129 +0.14106032234351765#7130 +0.041520425698197#7131 +-0.05843432931587226#7132 +-0.15780522782723821#7133 +-0.2555993886656267#7134 +-0.3508396849023918#7135 +-0.4425745069797916#7136 +-0.5298872708791288#7137 +-0.6119055763252834#7138 +-0.6878099235218842#7139 +-0.7568419013223837#7140 +-0.8183117650235371#7141 +-0.8716053280664775#7142 +-0.9161900987857895#7143 +-0.9516206008902112#7144 +-0.9775428245144819#7145 +-0.9936977633688959#7146 +-0.9999240026445323#7147 +-0.9961593318166703#7148 +-0.9824413662317869#7149 +-0.95890717126745#7150 +-0.9257918928203727#7151 +-0.8834264078063425#7152 +-0.8322340181474527#7153 +-0.7727262212792206#7154 +-0.7054975994372918#7155 +-0.6312198787882831#7156 +-0.55063521776397#7157 +-0.46454879165956#7158 +-0.3738207475882999#7159 +-0.27935761017584615#7160 +-0.1821032238658627#7161 +-0.08302932233833335#7162 +0.01687418073215605#7163 +0.11660908256663223#7164 +0.21517886499393998#7165 +0.3115986513309033#7166 +0.4049050469445867#7167 +0.4941657651730115#7168 +0.5784889424253095#7169 +0.6570320493879117#7170 +0.7290103092989471#7171 +0.7937045391782332#7172 +0.8504683356658855#7173 +0.8987345336710154#7174 +0.9380208732978393#7175 +0.967934818427143#7176 +0.98817747880743#7177 +0.9985465964675143#7178 +0.998938566611311#7179 +0.989349472802711#7180 +0.9698751260973173#7181 +0.9407101077300469#7182 +0.9021458249237525#7183 +0.8545675992445777#7184 +0.7984508165962385#7185 +0.7343561773212153#7186 +0.6629240938682737#7187 +0.5848682920029681#7188 +0.5009686794957195#7189 +0.4120635535411761#7190 +0.31904122476974855#7191 +0.22283114154142777#7192 +0.12439460320500637#7193 +0.02471515511274884#7194 +-0.0752112386396513#7195 +-0.17438614655709378#7196 +-0.271818645742533#7197 +-0.3665352228710099#7198 +-0.4575895012129941#7199 +-0.5440716965178346#7200 +-0.6251177072772582#7201 +-0.6999177485420057#7202 +-0.7677244430253657#7203 +-0.8278602886499732#7204 +-0.8797244279246147#7205 +-0.9227986515136628#7206 +-0.9566525760134608#7207 +-0.9809479442010262#7208 +-0.9954420047884096#7209 +-0.9999899379133214#7210 +-0.9945463021313241#7211 +-0.9791654884517249#7212 +-0.9540011768805893#7213 +-0.9193048009009206#7214 +-0.8754230352324109#7215 +-0.822794331972237#7216 +-0.7619445397266382#7217 +-0.6934816495054661#7218 +-0.618089719876988#7219 +-0.5365220420807936#7220 +-0.44959361339073317#7221 +-0.3581729939315602#7222 +-0.26317362831327207#7223 +-0.16554471879451196#7224 +-0.06626174116736495#7225 +0.03368330187430715#7226 +0.1332917924978703#7227 +0.23156847559120272#7228 +0.32753140302278777#7229 +0.42022174494285497#7230 +0.5087133700942921#7231 +0.5921220994100276#7232 +0.6696145404379987#7233 +0.7404164143230488#7234 +0.803820292145306#7235 +0.8591926633161057#7236 +0.9059802654063811#7237 +0.9437156121619712#7238 +0.9720216644717411#7239 +0.9906155976177484#7240 +0.9993116271663351#7241 +0.9980228652647771#7242 +0.9867621887959865#7243 +0.9656421107169549#7244 +0.9348736558664785#7245 +0.8947642524747242#7246 +0.8457146604419769#7247 +0.7882149670781883#7248 +0.7228396903125782#7249 +0.6502420383003954#7250 +0.5711473827829529#7251 +0.48634601141296413#7252 +0.39668523146155205#7253 +0.3030609038040782#7254 +0.20640849177440834#7255 +0.1076937143245037#7256 +0.007902896879877103#7257 +-0.09196688369802286#7258 +-0.19091776157422172#7259 +-0.2879610522857915#7260 +-0.38212713135018883#7261 +-0.472475122432569#7262 +-0.5581022982711118#7263 +-0.6381531004294191#7264 +-0.711827687753602#7265 +-0.7783899281206974#7266 +-0.8371747536275085#7267 +-0.8875948057292506#7268 +-0.9291463039319765#7269 +-0.9614140794007434#7270 +-0.9840757231893756#7271 +-0.9969048076440806#7272 +-0.9997731487937185#7273 +-0.9926520871216694#7274 +-0.9756127739222505#7275 +-0.9488254603805024#7276 +-0.9125577964786259#7277 +-0.8671721567258328#7278 +-0.8131220194320353#7279 +-0.7509474357024735#7280 +-0.6812696334255883#7281 +-0.6047848101693116#7282 +-0.5222571770050993#7283 +-0.43451132276352#7284 +-0.3424239750152328#7285 +-0.24691524009890903#7286 +-0.14893940972284261#7287 +-0.0494754259976481#7288 +0.050482899829713684#7289 +0.14993681720940477#7290 +0.24789261547406108#7291 +0.3433715526673036#7292 +0.4354196348098376#7293 +0.5231171478919449#7294 +0.6055878473518524#7295 +0.6820077132217451#7296 +0.7516131834628998#7297 +0.8137087832251761#7298 +0.8676740738018253#7299 +0.9129698518479584#7300 +0.949143536922132#7301 +0.9758336935205153#7302 +0.9927736424209699#7303 +0.9997941252536848#7304 +0.9968249956748588#7305 +0.9838959202457798#7306 +0.961136082014351#7307 +0.9287728897607787#7308 +0.8871297058042116#7309 +0.8366226150733376#7310 +0.7777562677233152#7311 +0.7111188368382388#7312 +0.6373761416001066#7313 +0.5572649946436438#7314 +0.4715858400680154#7315 +0.3811947556639786#7316 +0.2869948992675788#7317 +0.18992748470559684#7318 +0.0909623774981151#7319 +-0.008911595717163887#7320 +-0.10869652721381882#7321 +-0.20739539894084763#7322 +-0.3040220443974627#7323 +-0.3976110020827836#7324 +-0.48722716206801436#7325 +-0.5719751093057461#7326 +-0.6510080703211262#7327 +-0.7235363738925117#7328 +-0.7888353411852869#7329 +-0.8462525265032307#7330 +-0.8952142363102442#7331 +-0.935231261386525#7332 +-0.9659037648453803#7333 +-0.9869252771712309#7334 +-0.9980857583617049#7335 +-0.9992736965779115#7336 +-0.9904772223338747#7337 +-0.971784227092513#7338 +-0.9433814850831956#7339 +-0.9055527871153815#7340 +-0.85867610503466#7341 +-0.8032198151530112#7342 +-0.7397380183875204#7343 +-0.6688650038671767#7344 +-0.5913089113255638#7345 +-0.5078446556027223#7346 +-0.4193061839522201#7347 +-0.32657814351586195#7348 +-0.23058704222187348#7349 +-0.13229199142394524#7350 +-0.03267512277762666#7351 +0.06726822489452655#7352 +0.16653945069945214#7353 +0.2641466693636113#7354 +0.35911462182276815#7355 +0.45049441968818166#7356 +0.5373730262257255#7357 +0.6188823791171251#7358 +0.6942080638516992#7359 +0.7625974510869405#7360 +0.82336721667212#7361 +0.875910169197324#7362 +0.9197013168493114#7363 +0.9543031129561722#7364 +0.9793698278090396#7365 +0.994651003079058#7366 +0.999993954314214#7367 +0.995345296511911#7368 +0.9807514775242675#7369 +0.9563583139665331#7370 +0.9224095342656689#7371 +0.8792443434064714#7372 +0.827294033707491#7373 +0.7670776754907508#7374 +0.6991969307026712#7375 +0.624330041306784#7376 +0.5432250525142298#7377 +0.4566923385632795#7378 +0.36559650572781904#7379 +0.27084775345726186#7380 +0.1733927799645225#7381 +0.07420532313040953#7382 +-0.025723568763404207#7383 +-0.1253954392612152#7384 +-0.22381439998014888#7385 +-0.3199970811976842#7386 +-0.4129824573568625#7387 +-0.5018414493159796#7388 +-0.5856862074002571#7389 +-0.6636789825023087#7390 +-0.7350404965942983#7391 +-0.7990577290163985#7392 +-0.855091040743531#7393 +-0.9025805654470686#7394 +-0.9410518034941227#7395 +-0.9701203629910278#7396 +-0.9894958005000788#7397 +-0.9989845230543534#7398 +-0.9984917224746438#7399 +-0.9880223226614443#7400 +-0.9676809303969649#7401 +-0.9376707901487422#7402 +-0.8982917533181031#7403 +-0.8499372822240805#7404 +-0.793090518757983#7405 +-0.7283194569893225#7406 +-0.6562712679568256#7407 +-0.57766583334934#7408 +-0.4932885526859621#7409 +-0.40398249586366014#7410 +-0.31063997948154537#7411 +-0.21419365110837466#7412 +-0.11560717057633567#7413 +-0.015865581410547242#7414 +0.0840345314002315#7415 +0.18309499895138165#7416 +0.28032604179616866#7417 +0.3747561594947966#7418 +0.4654418375256672#7419 +0.5514769745705953#7420 +0.6320019359796627#7421 +0.7062121429564829#7422 +0.7733661116435763#7423 +0.8327928617839718#7424 +0.8838986209341382#7425 +0.9261727572419648#7426 +0.9591928815114351#7427 +0.9826290675758504#7428 +0.996247148811028#7429 +0.9999110578508053#7430 +0.9935841861271838#7431 +0.9773297496510405#7432 +0.9513101573786427#7433 +0.9157853884750424#7434 +0.8711103946881975#7435 +0.8177315537884366#7436 +0.7561822095093318#7437 +0.6870773425534116#7438 +0.6111074259082679#7439 +0.529031525868704#7440 +0.44166971769722985#7441 +0.34989489170312094#7442 +0.2546240316109867#7443 +0.15680905236250883#7444 +0.05742728889700527#7445 +-0.04252826905621956#7446 +-0.14205889860301116#7447 +-0.2401701225933894#7448 +-0.33588164610850085#7449 +-0.42823715124340533#7450 +-0.5163138523194657#7451 +-0.5992317160538159#7452 +-0.6761622545610236#7453 +-0.7463368033301797#7454 +-0.809054201466604#7455 +-0.8636877974597326#7456 +-0.9096917104778677#7457 +-0.9466062846290039#7458 +-0.9740626816905584#7459 +-0.9917865664189706#7460 +-0.9996008476167711#7461 +-0.9974274475692897#7462 +-0.9852880821713702#7463 +-0.963304043949328#7464 +-0.9316949901461209#7465 +-0.8907767479787866#7466 +-0.840958158997289#7467 +-0.782736994074895#7468 +-0.7166949798461515#7469 +-0.6434919862866445#7470 +-0.5638594335103286#7471 +-0.47859298366152303#7472 +-0.38854459092177623#7473 +-0.2946139890653031#7474 +-0.19773970161652513#7475 +-0.09888966443324891#7476 +9.484455884677701E-4#7477 +0.10077707905537892#7478 +0.19959878126084157#7479 +0.29642615842253006#7480 +0.3902917433947197#7481 +0.4802576622802053#7482 +0.5654250053562614#7483 +0.6449428086834523#7484 +0.7180165566560236#7485 +0.7839161205392026#7486 +0.8419830536741678#7487 +0.8916371704594106#7488 +0.9323823433734814#7489 +0.963811460117186#7490 +0.985610491345106#7491 +0.9975616283430137#7492 +0.9995454593005464#7493 +0.9915421624345439#7494 +0.973631704041753#7495 +0.9459930395020244#7496 +0.908902325215311#7497 +0.8627301593382061#7498 +0.8079378788896648#7499 +0.7450729502240094#7500 +0.6747634989280851#7501 +0.597712033798026#7502 +0.5146884276035842#7503 +0.4265222247738995#7504 +0.33409435286377454#7505 +0.23832832061674333#7506 +0.1401809905709772#7507 +0.040633018405099953#7508 +-0.0593209454491911#7509 +-0.15868219402545106#7510 +-0.25645794257236754#7511 +-0.35167124813082457#7512 +-0.4433707708250161#7513 +-0.5306402793360133#7514 +-0.6126078055822383#7515 +-0.6884543571363001#7516 +-0.7574221003266068#7517 +-0.8188219322609055#7518 +-0.8720403661145942#7519 +-0.9165456608882823#7520 +-0.9518931343880851#7521 +-0.9777296063431139#7522 +-0.993796927265996#7523 +-0.99993455779722#7524 +-0.9960811727613489#7525 +-0.9822752739079014#7526 +-0.9586548052145977#7527 +-0.9254557745967325#7528 +-0.8830098957940993#7529 +-0.8317412739969522#7530 +-0.772162168327135#7531 +-0.7048678735142673#7532 +-0.6305307719075828#7533 +-0.5498936152537572#7534 +-0.4637621033669758#7535 +-0.37299683384271926#7536 +-0.2785047032510652#7537 +-0.18122984572594025#7538 +-0.0821441994889431#7539 +0.017762204436085696#7540 +0.1174911342857932#7541 +0.21604613155912197#7542 +0.31244246730126723#7543 +0.4057169811898851#7544 +0.4949377051146552#7545 +0.5792131750945708#7546 +0.6577013384913591#7547 +0.7296179675210964#7548 +0.794244494998994#7549 +0.8509351940251821#7550 +0.8991236298744447#7551 +0.9383283196247547#7552 +0.9681575429754743#7553 +0.9883132561871131#7554 +0.9985940700358535#7555 +0.998897262028104#7556 +0.9892198027697#7557 +0.9696583862346088#7558 +0.9404084636307043#7559 +0.9017622905159063#7560 +0.8541060066772513#7561 +0.7979157779497825#7562 +0.7337530385249249#7563 +0.6622588812856302#7564 +0.5841476522182073#7565 +0.5001998129033588#7566 +0.4112541424020529#7567 +0.3181993564524092#7568 +0.22196522771581453#7569 +0.12351329579583167#7570 +0.023827259852323673#7571 +-0.07609685019538392#7572 +-0.17526062567021322#7573 +-0.2726732549068054#7574 +-0.367361423114162#7575 +-0.4583790374153017#7576 +-0.5448166798945504#7577 +-0.6258106942007409#7578 +-0.7005518149159866#7579 +-0.7682932534682305#7580 +-0.8283581597958007#7581 +-0.8801463852094901#7582 +-0.923140478879876#7583 +-0.9569108580349618#7584 +-0.9811201002092328#7585 +-0.995526314657395#7586 +-0.9999855592467439#7587 +-0.9944532786793728#7588 +-0.9789847496739821#7589 +-0.953734528659178#7590 +-0.9189549074967269#7591 +-0.8749933926646701#7592 +-0.822289233087465#7593 +-0.7613690313059284#7594 +-0.6928414818387202#7595 +-0.6173912893079209#7596 +-0.5357723270967809#7597 +-0.44880010489607236#7598 +-0.3573436204008309#7599 +-0.2623166765726389#7600 +-0.16466875122249675#7601 +-0.06537551014239087#7602 +0.03457094142478756#7603 +0.13417197157288324#7604 +0.23243239973237922#7605 +0.3283704401856845#7606 +0.42102751174548914#7607 +0.5094778155811228#7608 +0.5928375854944425#7609 +0.6702739182195506#7610 +0.7410130955169058#7611 +0.8043483149102156#7612 +0.859646751823142#7613 +0.9063558825532837#7614 +0.9440090049063705#7615 +0.9722299013303181#7616 +0.9907365979566459#7617 +0.9993441819901644#7618 +0.9979666492964995#7619 +0.9866177637269746#7620 +0.9654109195947578#7621 +0.9345580086763673#7622 +0.8943673030590836#7623 +0.8452403749881539#7624 +0.7876680844896596#7625 +0.722225674859393#7626 +0.6495670250219955#7627 +0.5704181161888862#7628 +0.48556977809397517#7629 +0.39586978728437555#7630 +0.30221439641738246#7631 +0.2055393792001831#7632 +0.10681068044830018#7633 +0.007014764684294179#7634 +-0.0928512402896644#7635 +-0.19178950636318762#7636 +-0.28881147508631094#7637 +-0.38294773501875135#7638 +-0.4732577077685739#7639 +-0.55883904594057#7640 +-0.6388366490931539#7641 +-0.7124512076193162#7642 +-0.7789471891840013#7643 +-0.8376601879200635#7644 +-0.8880035629520688#7645 +-0.9294742999180047#7646 +-0.9616580369225101#7647 +-0.984233204703965#7648 +-0.9969742396482555#7649 +-0.9997538375458441#7650 +-0.9925442255733512#7651 +-0.9754174397904251#7652 +-0.948544605379246#7653 +-0.9121942268182728#7654 +-0.866729505074249#7655 +-0.8126047086182022#7656 +-0.7503606345250428#7657 +-0.6806192050079543#7658 +-0.6040772533772201#7659 +-0.5214995615121297#7660 +-0.4337112184132438#7661 +-0.3415893761858385#7662 +-0.2460544858260183#7663 +-0.14806110037862266#7664 +-0.048588337358735884#7665 +0.05136990426687065#7666 +0.15081487478967512#7667 +0.24875295293634997#7668 +0.3442055738040776#7669 +0.43621900635758876#7670 +0.5238738827944053#7671 +0.6062943845640199#7672 +0.6826569932573459#7673 +0.7521987189304415#7674 +0.8142247236478194#7675 +0.8681152640734142#7676 +0.9133318837411375#7677 +0.9494227931338964#7678 +0.976027383815107#7679 +0.9928798315089906#7680 +0.9998117521288687#7681 +0.9967538842152956#7682 +0.9837367809736671#7683 +0.9608905049966914#7684 +0.9284433287219556#7685 +0.8867194536091866#7686 +0.836135770826432#7687 +0.7771976958113149#7688 +0.7104941183270491#7689 +0.6366915184705867#7690 +0.5565273074237976#7691 +0.4708024594846968#7692 +0.3803735089970247#7693 +0.286143992142218#7694 +0.18905541910455304#7695 +0.09007786681260743#7696 +-0.009799713748746178#7697 +-0.10957937880967696#7698 +-0.2082641629396677#7699 +-0.30486804039654375#7700 +-0.3984257771697518#7701 +-0.48800257527952967#7702 +-0.5727034129693166#7703 +-0.6516819874672904#7704 +-0.7241491709639128#7705 +-0.7893808953161512#7706 +-0.8467253866970188#7707 +-0.8956096779042066#7708 +-0.9355453332589703#7709 +-0.9661333288939775#7710 +-0.9870680396678903#7711 +-0.9981402928707507#7712 +-0.9992394582085561#7713 +-0.9903545531845869#7714 +-0.9715743528328836#7715 +-0.9430865027074515#7716 +-0.9051756439899129#7717 +-0.8582205694489098#7718 +-0.8026904386679721#7719 +-0.7391400903580423#7720 +-0.6682044985924814#7721 +-0.5905924283560221#7722 +-0.507079353799328#7723 +-0.4184997099576176#7724 +-0.32573855535162055#7725 +-0.22972272877539926#7726 +-0.13141158862949134#7727 +-0.03178742732889281#7728 +0.0681543434380497#7729 +0.16741513853418957#7730 +0.26500317690618225#7731 +0.3599433911329309#7732 +0.45128716997694385#7733 +0.5381218365942502#7734 +0.6195797676997338#7735 +0.6948470625722005#7736 +0.763171675281344#7737 +0.8238709288820886#7738 +0.8763383364969607#7739 +0.9200496611324916#7740 +0.9545681536819657#7741 +0.979548916778125#7742 +0.994742350893655#7743 +0.999996648257155#7744 +0.9952593096662085#7745 +0.9805776690420603#7746 +0.956098420484722#7747 +0.9220661525540147#7748 +0.8788209044215302#7749 +0.8267947683116299#7750 +0.7665075721787701#7751 +0.6985616857584132#7752 +0.6236360018877475#7753 +0.542479153232871#7754 +0.4559020321986561#7755 +0.3647696887598858#7756 +0.2699926871678532#7757 +0.1725180078933547#7758 +0.07331958571085657#7759 +-0.026611421535832028#7760 +-0.1262765362551009#7761 +-0.22467993756558144#7762 +-0.3208384112092187#7763 +-0.4137911735031304#7764 +-0.5026094711725734#7765 +-0.58640586114666#7766 +-0.6643430775961726#7767 +-0.7356423976169658#7768 +-0.7995914219718132#7769 +-0.855551193148098#7770 +-0.9029625796100673#7771 +-0.9413518624563137#7772 +-0.9703354686624472#7773 +-0.9896238036159622#7774 +-0.9990241446498792#7775 +-0.9984425666639266#7776 +-0.987884880593096#7777 +-0.9674565753467003#7778 +-0.9373617637980615#7779 +-0.8979011433561516#7780 +-0.8494689914964797#7781 +-0.7925492262708868#7782 +-0.7277105711583345#7783 +-0.6556008725678979#7784 +-0.5769406267715956#7785 +-0.4925157809438046#7786 +-0.40316988023689265#7787 +-0.3097956393568956#7788 +-0.2133260228532663#7789 +-0.11472492324549403#7790 +-0.014977530127669912#7791 +0.08491951352027674#7792 +0.1839680694597875#7793 +0.28117847726101386#7794 +0.3755794426626941#7795 +0.46622774242334464#7796 +0.5522176486961006#7797 +0.6326899787619682#7798 +0.7068406796995446#7799 +0.773928862216024#7800 +0.8332842033681063#7801 +0.8843136442072667#7802 +0.9265073154287307#7803 +0.9594436318170264#7804 +0.9827935045861007#7805 +0.9963236295256865#7806 +0.9998988180998523#7807 +0.993483348206165#7808 +0.97714132109913#7809 +0.951036020911645#7810 +0.9154282831739184#7811 +0.8706738886310726#7812 +0.817220008399544#7813 +0.7556007359811027#7814 +0.6864317507771306#7815 +0.6104041664235594#7816 +0.5282776254118724#7817 +0.44087270899243347#7818 +0.3490627381978821#7819 +0.2537650479080564#7820 +0.15593182114310442#7821 +0.056540575165497#7822 +-0.04341560554933505#7823 +-0.1429379918848091#7824 +-0.2410321890543877#7825 +-0.3367180722655825#7826 +-0.4290395798028944#7827 +-0.5170742656804435#7828 +-0.5999425164173386#7829 +-0.6768163398448185#7830 +-0.7469276381303027#7831 +-0.8095758823570365#7832 +-0.8641351119774621#7833 +-0.9100601892040956#7834 +-0.9468922458461004#7835 +-0.9742632681685688#7836 +-0.9918997739641114#7837 +-0.9996255450966729#7838 +-0.9973633882148972#7839 +-0.9851359060425772#7840 +-0.9630652715397107#7841 +-0.9313720071906685#7842 +-0.8903727816164261#7843 +-0.8404772455263794#7844 +-0.782183938623869#7845 +-0.7160753083622596#7846 +-0.642811890322518#7847 +-0.5631257083600311#7848 +-0.47781296046421884#7849 +-0.3877260634114115#7850 +-0.2937651356981923#7851 +-0.19686900385491865#7852 +-0.0980058220013664#7853 +0.0018366016292064157#7854 +0.10166067454339997#7855 +0.2004689876021066#7856 +0.29727428080292906#7857 +0.3911093076557798#7858 +0.4810364995900806#7859 +0.5661573338300011#7860 +0.6456213111370226#7861 +0.7186344537171913#7862 +0.7844672383847822#7863 +0.8424618857168215#7864 +0.8920389323676491#7865 +0.9327030208751224#7866 +0.9640478491086351#7867 +0.9857602299057003#7868 +0.9976232203345528#7869 +0.9995182893162105#7870 +0.9914265019478351#7871 +0.9734287086940224#7872 +0.9457047375556851#7873 +0.908531597288111#7874 +0.8622807096210473#7875 +0.807414198135553#7876 +0.7444802708779339#7877 +0.6741077428461579#7878 +0.5969997530782538#7879 +0.5139267391194702#7880 +0.42571873906499613#7881 +0.3332570980936882#7882 +0.2374656623583771#7883 +0.13930154822049173#7884 +0.03974557905975634#7885 +-0.06020751478880264#7886 +-0.15955903505155#7887 +-0.25731629417926616#7888 +-0.3525025339530001#7889 +-0.4441666849293199#7890 +-0.5313928692118094#7891 +-0.6133095516002608#7892 +-0.6890982476823034#7893 +-0.7580017018590971#7894 +-0.819331453592961#7895 +-0.8724747162774904#7896 +-0.9169004999987684#7897 +-0.9521649170110635#7898 +-0.9779156169164552#7899 +-0.9938953072335382#7900 +-0.9999443241788476#7901 +-0.996002227974605#7902 +-0.9821084067429994#7903 +-0.9584016829530904#7904 +-0.9251189263525859#7905 +-0.8825926872436216#7906 +-0.8312478737500688#7907 +-0.7715975062760166#7908 +-0.7042375915754759#7909 +-0.6298411676499076#7910 +-0.5491515789749879#7911 +-0.46297504924832533#7912 +-0.37217262586877564#7913 +-0.27765157663545714#7914 +-0.18035632462780476#7915 +-0.08125901184234507#7916 +0.018650214128785595#7917 +0.1183730933252825#7918 +0.21691322770221497#7919 +0.313286036809926#7920 +0.40652859539642616#7921 +0.4957092546382107#7922 +0.5799369508673419#7923 +0.6583701087850726#7924 +0.7302250502040435#7925 +0.7947838243016816#7926 +0.8514013811474965#7927 +0.8995120168287606#7928 +0.9386350257770081#7929 +0.9683795038191755#7930 +0.9884482539628825#7931 +0.9986407558905398#7932 +0.9988551694920795#7933 +0.9890893524176707#7934 +0.9694408814833709#7935 +0.940106077715835#7936 +0.9013780447775112#7937 +0.8536437403717337#7938 +0.7973801098892623#7939 +0.7331493209275945#7940 +0.6615931462981596#7941 +0.5834265516445285#7942 +0.49943055174204004#7943 +0.410444406856334#7944 +0.31735723713220004#7945 +0.221099138798995#7946 +0.1226318909565677#7947 +0.022939345796415475#7948 +-0.07698240172419506#7949 +-0.17613496653377583#7950 +-0.2735276489802294#7951 +-0.3681873335742909#7952 +-0.45916821203782765#7953 +-0.5455612335075115#7954 +-0.626503187470553#7955 +-0.7011853286788058#7956 +-0.7688614578639504#7957 +-0.8288553775139227#7958 +-0.8805676482149329#7959 +-0.9234815780519405#7960 +-0.957168385223473#7961 +-0.9812914822876503#7962 +-0.9956098392326427#7963 +-0.9999803917688753#7964 +-0.9943594707801187#7965 +-0.9788032386508632#7966 +-0.9534671281103374#7967 +-0.9186042892000581#7968 +-0.8745630598822943#7969 +-0.8217834855622946#7970 +-0.7607929223000569#7971 +-0.6922007676428981#7972 +-0.6166923717266009#7973 +-0.535022189483404#7974 +-0.44800624237770903#7975 +-0.35651396498934845#7976 +-0.2614595179106613#7977 +-0.1637926537560355#7978 +-0.06448922754773154#7979 +0.03545855370492522#7980 +0.13505204481000171#7981 +0.23329614052560674#7982 +0.32920921832252986#7983 +0.42183294643207214#7984 +0.5102418591802964#7985 +0.5935526039351231#7986 +0.6709327672738326#7987 +0.7416091921828252#7988 +0.80487570318693#7989 +0.8601001622213218#7990 +0.9067307847461078#7991 +0.9443016529950545#7992 +0.9724373712718963#7993 +0.9908568167800427#7994 +0.9993759485086353#7995 +0.9979096461094927#7996 +0.9864725603914919#7997 +0.9651789669345293#7998 +0.9342416242857009#7999
\ No newline at end of file diff --git a/MPChartExample/src/main/assets/sine.txt b/MPChartExample/src/main/assets/sine.txt new file mode 100644 index 00000000..3463df1e --- /dev/null +++ b/MPChartExample/src/main/assets/sine.txt @@ -0,0 +1,750 @@ +0.0#0 +0.019998666246387648#1 +0.039989333293279646#2 +0.059964005140753354#3 +0.07991469218675235#4 +0.0998334181294999#5 +0.11971221202299985#6 +0.1395431152344512#7 +0.15931820308364608#8 +0.17902956580240917#9 +0.19866931911175714#10 +0.21822960737550368#11 +0.23770260674240787#12 +0.25708054267594205#13 +0.2763556497097811#14 +0.29552021804983797#15 +0.31456658211607685#16 +0.33348712360864613#17 +0.35227427455509996#18 +0.3709205203374898#19 +0.38941840269811434#20 +0.40776052272272667#21 +0.42593954380000415#22 +0.4439481945560986#23 +0.46177927176309164#24 +0.4794256432201933#25 +0.49688022474350485#26 +0.5141360611809643#27 +0.5311862504412359#28 +0.5480239726889556#29 +0.5646424930725696#30 +0.5810351644181799#31 +0.5971954298883201#32 +0.6131168256045979#33 +0.6287929832331555#34 +0.6442176325319131#35 +0.659384603858578#36 +0.6742878306384138#37 +0.6889213517907848#38 +0.7032793141135052#39 +0.7173559746240362#40 +0.7311457028565987#41 +0.7446429831142805#42 +0.7578424166752367#43 +0.7707387239521026#44 +0.7833267466037546#45 +0.795601449598573#46 +0.8075579232283849#47 +0.8191913850722774#48 +0.8304971819094986#49 +0.8414707915806806#50 +0.8521078247966395#51 +0.8624040268940288#52 +0.8723552795371456#53 +0.8819576023652057#54 +0.8912071545844327#55 +0.9001002365043209#56 +0.9086332910174598#57 +0.9168029050223264#58 +0.9246058107884779#59 +0.9320388872635981#60 +0.9390991613218737#61 +0.9457838089532035#62 +0.952090156392762#63 +0.9580156811904679#64 +0.9635580132199286#65 +0.9687149356264573#66 +0.9734843857137836#67 +0.9778644557691029#68 +0.9818533938261347#69 +0.9854496043658845#70 +0.9886516489548286#71 +0.9914582468202678#72 +0.9938682753626178#73 +0.9958807706044335#74 +0.9974949275759862#75 +0.9987101006372409#76 +0.9995258037361018#77 +0.9999417106028279#78 +0.9999576548805349#79 +0.9995736301917366#80 +0.9987897901408953#81 +0.9976064482529823#82 +0.9960240778480722#83 +0.9940433118520219#84 +0.9916649425433088#85 +0.988889921236131#86 +0.9857193578998942#87 +0.9821545207152407#88 +0.9781968355667943#89 +0.9738478854728265#90 +0.9691094099520721#91 +0.9639833043279455#92 +0.9584716189704385#93 +0.9525765584760014#94 +0.9463004807857347#95 +0.9396458962422467#96 +0.9326154665855515#97 +0.9252120038884106#98 +0.9174384694315432#99 +0.909297972519156#100 +0.9007937174689649#101 +0.8919292072378467#102 +0.8827079378965067#103 +0.8731335978226978#104 +0.8632100166174893#105 +0.85294116357348#106 +0.8423311460871373#107 +0.8313842080158964#108 +0.8201047279806774#109 +0.8084972176144982#110 +0.7965663197578854#111 +0.7843168066018031#112 +0.7717535777788443#113 +0.7588816584034461#114 +0.7457061970619157#115 +0.7322324637530676#116 +0.7184658477802992#117 +0.7044118555959447#118 +0.6900761085987721#119 +0.6754643408855032#120 +0.660582396957255#121 +0.6454362293818222#122 +0.630031896412734#123 +0.6143755595660381#124 +0.5984734811557804#125 +0.5823320217891688#126 +0.5659576378224191#127 +0.5493568787783043#128 +0.5325363847264367#129 +0.5155028836273348#130 +0.498263188641333#131 +0.48082419540341453#132 +0.46319287926505354#133 +0.44537629250417365#134 +0.42738156150433587#135 +0.4092158839042855#136 +0.39088652571899846#137 +0.37240081843337736#138 +0.3537661560697612#139 +0.33498999223042036#140 +0.3160798371162209#141 +0.29704325452265024#142 +0.2778878588144052#143 +0.25862131187975385#144 +0.2392513200658879#145 +0.21978563109649268#146 +0.20023203097276676#147 +0.1805983408591312#148 +0.1608924139548741#149 +0.1411221323529816#150 +0.12129540388741163#151 +0.10142015897007202#152 +0.08150434741876739#153 +0.06155593527738411#154 +0.04158290162958502#155 +0.02159323540728851#156 +0.0015949321952082743#157 +-0.01840400896726781#158 +-0.038395588785580706#159 +-0.05837181090960527#160 +-0.07832468513207759#161 +-0.09824623058456528#162 +-0.11812847892970231#163 +-0.13796347754841165#164 +-0.15774329272084087#165 +-0.1774600127997381#166 +-0.19710575137499955#167 +-0.2166726504281223#168 +-0.23615288347530097#169 +-0.2555386586979109#170 +-0.2748222220591258#171 +-0.29399586040542314#172 +-0.3130519045517368#173 +-0.33198273234902315#174 +-0.350780771733013#175 +-0.36943850375293075#176 +-0.38794846557896867#177 +-0.40630325348731355#178 +-0.42449552582153194#179 +-0.44251800592912927#180 +-0.4603634850721081#181 +-0.47802482531036194#182 +-0.49549496235675056#183 +-0.5127669084027151#184 +-0.5298337549133033#185 +-0.5466886753904862#186 +-0.5633249281036602#187 +-0.5797358587862456#188 +-0.5959149032972986#189 +-0.6118555902470753#190 +-0.6275515435854963#191 +-0.6429964851524771#192 +-0.6581842371891036#193 +-0.6731087248086483#194 +-0.6877639784264394#195 +-0.7021441361476113#196 +-0.7162434461117786#197 +-0.7300562687937001#198 +-0.7435770792590093#199 +-0.7568004693741099#200 +-0.7697213021710452#201 +-0.7823341014558161#202 +-0.7946339781278204#203 +-0.806616012409769#204 +-0.8182754116568484#205 +-0.8296075122737109#206 +-0.8406077815798478#207 +-0.8512718196225969#208 +-0.8615953609370618#209 +-0.8715742762522378#210 +-0.8812045741426621#211 +-0.8904824026249275#212 +-0.8994040506984219#213 +-0.9079659498296758#214 +-0.9161646753797257#215 +-0.923996947973921#216 +-0.9314596348136281#217 +-0.9385497509293057#218 +-0.9452644603744499#219 +-0.9516010773599336#220 +-0.9575570673282837#221 +-0.9631300479674688#222 +-0.9683177901637904#223 +-0.9731182188934963#224 +-0.9775294140527618#225 +-0.9815496112257037#226 +-0.9851772023901216#227 +-0.9884107365606845#228 +-0.991248920369304#229 +-0.9936906185824641#230 +-0.9957348545552975#231 +-0.997380810622231#232 +-0.9986278284240393#233 +-0.9994754091711795#234 +-0.9999232138433003#235 +-0.9999710633248452#236 +-0.999618938476696#237 +-0.9988669801438286#238 +-0.9977154890989762#239 +-0.9961649259223255#240 +-0.9942159108172903#241 +-0.9918692233624392#242 +-0.989125802199675#243 +-0.9859867446587918#244 +-0.9824533063185572#245 +-0.9785269005045#246 +-0.9742090977235991#247 +-0.9695016250361028#248 +-0.9644063653647295#249 +-0.9589253567415246#250 +-0.953060791492677#251 +-0.9468150153616188#252 +-0.940190526570762#253 +-0.9331899748222436#254 +-0.9258161602380832#255 +-0.9180720322401726#256 +-0.9099606883705496#257 +-0.901485373052424#258 +-0.8926494762924547#259 +-0.8834565323247946#260 +-0.8739102181974464#261 +-0.864014352301496#262 +-0.8537728928438092#263 +-0.8431899362638049#264 +-0.8322697155949375#265 +-0.8210165987715422#266 +-0.8094350868817244#267 +-0.7975298123669863#268 +-0.7853055371693165#269 +-0.7727671508264802#270 +-0.7599196685162729#271 +-0.7467682290505201#272 +-0.7333180928196247#273 +-0.7195746396884855#274 +-0.7055433668446264#275 +-0.6912298865993995#276 +-0.6766399241431399#277 +-0.6617793152551689#278 +-0.646654003969566#279 +-0.6312700401976384#280 +-0.6156335773080419#281 +-0.5997508696655202#282 +-0.5836282701292467#283 +-0.5672722275117711#284 +-0.5506892839995849#285 +-0.5338860725363392#286 +-0.5168693141697605#287 +-0.4996458153633263#288 +-0.48222246527377605#289 +-0.4646062329955453#290 +-0.44680416477322615#291 +-0.42882338118316876#292 +-0.4106710742853512#293 +-0.392354504746657#294 +-0.37388099893671045#295 +-0.3552579459974321#296 +-0.33649279488748635#297 +-0.31759305140280275#298 +-0.2985662751743636#299 +-0.27942007664445806#300 +-0.2601621140226123#301 +-0.24080009022241405#302 +-0.22134174978045548#303 +-0.2017948757586277#304 +-0.18216728663100587#305 +-0.1624668331565697#306 +-0.1427013952390105#307 +-0.12287887877488078#308 +-0.10300721249134719#309 +-0.08309434477481123#310 +-0.06314824049166687#311 +-0.04317687780246621#312 +-0.02318824497076772#313 +-0.0031903371679434384#314 +0.016808846724776887#315 +0.03680130731574554#316 +0.056779047902540736#317 +0.07673407767053486#318 +0.09665841488910769#319 +0.11654409010422613#320 +0.13638314932611348#321 +0.1561676572107332#322 +0.17588970023381478#323 +0.19554138985615177#324 +0.21511486567890625#325 +0.23460229858765777#326 +0.2539958938839385#327 +0.2732878944030029#328 +0.2924705836165842#329 +0.311536288719397#330 +0.3304773836981512#331 +0.3492862923818499#332 +0.3679554914721506#333 +0.38647751355257925#334 +0.40484495007539084#335 +0.42305045432488436#336 +0.44108674435598566#337 +0.45894660590692266#338 +0.4766228952848283#339 +0.49410854222311723#340 +0.5113965527094926#341 +0.5284800117834523#342 +0.545352086302176#343 +0.5620060276736858#344 +0.5784351745561876#345 +0.5946329555225146#346 +0.6105928916886046#347 +0.6263085993049634#348 +0.6417737923100737#349 +0.6569822848447313#350 +0.6719279937263022#351 +0.6866049408819089#352 +0.7010072557395762#353 +0.7151291775763766#354 +0.7289650578226388#355 +0.7425093623212952#356 +0.7557566735414675#357 +0.7687016927454025#358 +0.781339242107892#359 +0.7936642667873305#360 +0.8056718369475803#361 +0.8173571497298365#362 +0.8287155311737031#363 +0.8397424380867105#364 +0.8504334598615295#365 +0.8607843202401511#366 +0.8707908790243301#367 +0.8804491337316057#368 +0.8897552211962383#369 +0.8987054191144209#370 +0.9072961475331487#371 +0.9155239702821494#372 +0.9233855963483032#373 +0.9308778811920015#374 +0.9379978280049185#375 +0.9447425889086918#376 +0.9511094660940346#377 +0.9570959128998204#378 +0.9626995348317123#379 +0.9679180905199263#380 +0.9727494926157481#381 +0.977191808626443#382 +0.9812432616882257#383 +0.9849022312769813#384 +0.988167253856451#385 +0.991037023463627#386 +0.9935103922311188#387 +0.9955863708462842#388 +0.9972641289469402#389 +0.9985429954534961#390 +0.9994224588373765#391 +0.9999021673256246#392 +0.9999819290416072#393 +0.9996617120817624#394 +0.9989416445283599#395 +0.9978220143982713#396 +0.9963032695277663#397 +0.9943860173933846#398 +0.9920710248689544#399 +0.9893592179188533#400 +0.986251602430098#401 +0.9827494813924079#402 +0.9788542556716259#403 +0.9745674833774243#404 +0.9698908792400535#405 +0.9648263139244408#406 +0.959375813281916#407 +0.9535415575398596#408 +0.947325880429602#409 +0.9407312682529189#410 +0.9337603588874981#411 +0.9264159407317759#412 +0.918700951589563#413 +0.9106184774949092#414 +0.9021717514776737#415 +0.8933641522702975#416 +0.8841992029562936#417 +0.8746805695609958#418 +0.8648120595851305#419 +0.8545976204817978#420 +0.8440413380774695#421 +0.8331474349376399#422 +0.8219202686777767#423 +0.8103643302202548#424 +0.7984842419979638#425 +0.7862847561053125#426 +0.7737707523973671#427 +0.7609472365378854#428 +0.7478193379970259#429 +0.7343923079995343#430 +0.7206715174242275#431 +0.7066624546556156#432 +0.6923707233885205#433 +0.67780204038657#434 +0.6629622331954643#435 +0.6478572378119283#436 +0.6324930963092836#437 +0.6168759544205892#438 +0.6010120590803173#439 +0.5849077559255487#440 +0.5685694867576866#441 +0.5520037869657035#442 +0.5352172829119535#443 +0.5182166892815939#444 +0.5010088063966786#445 +0.48360051749599425#446 +0.4659987859817315#447 +0.44821065263408894#448 +0.4302432327949262#449 +0.4121037135215916#450 +0.39379935071206357#451 +0.3753374662025555#452 +0.35672544483874447#453 +0.3379707315217965#454 +0.31908082823036904#455 +0.30006329101978185#456 +0.2809257269995578#457 +0.2616757912905407#458 +0.2423211839628092#459 +0.2228696469556102#460 +0.2033289609805449#461 +0.18370694240924518#462 +0.16401144014678615#463 +0.14425033249208516#464 +0.12443152398654284#465 +0.10456294225218733#466 +0.084652534820586#467 +0.06470826595379324#468 +0.04473811345860604#469 +0.024750065495401534#470 +0.004752117382833131#471 +-0.015247731600336746#472 +-0.03524148141498798#473 +-0.05522113446169821#474 +-0.0751786987798224#475 +-0.09510619124431689#476 +-0.11499564075902909#477 +-0.13483909144517564#478 +-0.15462860582373356#479 +-0.17435626799047124#480 +-0.19401418678234966#481 +-0.21359449893402682#482 +-0.23308937222320295#483 +-0.25249100860354845#484 +-0.27179164732396127#485 +-0.290983568032906#486 +-0.3100590938665927#487 +-0.32901059451976084#488 +-0.3478304892978393#489 +-0.36651125014926184#490 +-0.3850454046767254#491 +-0.40342553912618595#492 +-0.42164430135239717#493 +-0.4396944037598051#494 +-0.4575686262176226#495 +-0.4752598189479177#496 +-0.49276090538556006#497 +-0.5100648850088826#498 +-0.5271648361399248#499 +-0.5440539187131385#500 +-0.5607253770114478#501 +-0.5771725423685697#502 +-0.5933888358365144#503 +-0.6093677708171961#504 +-0.625102955657105#505 +-0.6405880962040014#506 +-0.6558169983246062#507 +-0.6707835703822864#508 +-0.6854818256737397#509 +-0.6999058848237054#510 +-0.7140499781367439#511 +-0.7279084479051434#512 +-0.7414757506720319#513 +-0.7547464594487863#514 +-0.7677152658858558#515 +-0.780376982396128#516 +-0.7927265442299892#517 +-0.8047590115012498#518 +-0.8164695711631232#519 +-0.8278535389334684#520 +-0.8389063611685262#521 +-0.8496236166843997#522 +-0.8600010185255492#523 +-0.8700344156795967#524 +-0.8797197947377503#525 +-0.8890532815001886#526 +-0.8980311425257598#527 +-0.9066497866253763#528 +-0.9149057662985087#529 +-0.9227957791122028#530 +-0.9303166690220693#531 +-0.9374654276347177#532 +-0.9442391954111279#533 +-0.9506352628104804#534 +-0.9566510713739863#535 +-0.9622842147482832#536 +-0.9675324396479887#537 +-0.9723936467570258#538 +-0.9768658915683597#539 +-0.9809473851618101#540 +-0.9846364949196288#541 +-0.9879317451795541#542 +-0.9908318178250837#543 +-0.9933355528127273#544 +-0.9954419486360307#545 +-0.9971501627261821#546 +-0.9984595117890447#547 +-0.9993694720784776#548 +-0.9998796796058368#549 +-0.9999899302855721#550 +-0.9997001800168633#551 +-0.9990105447012596#552 +-0.9979213001963191#553 +-0.9964328822052644#554 +-0.9945458861026987#555 +-0.9922610666964535#556 +-0.9895793379256616#557 +-0.9865017724951763#558 +-0.9830296014464852#559 +-0.9791642136652865#560 +-0.9749071553259283#561 +-0.9702601292729311#562 +-0.9652249943398415#563 +-0.9598037646056896#564 +-0.9539986085893469#565 +-0.9478118483821087#566 +-0.9412459587188456#567 +-0.9343035659880974#568 +-0.926987447181504#569 +-0.9193005287829963#570 +-0.9112458855981864#571 +-0.9028267395244314#572 +-0.8940464582620574#573 +-0.8849085539672636#574 +-0.8754166818472415#575 +-0.8655746386980744#576 +-0.8553863613859995#577 +-0.8448559252726426#578 +-0.8339875425848524#579 +-0.8227855607297891#580 +-0.8112544605559403#581 +-0.7993988545607584#582 +-0.7872234850456398#583 +-0.7747332222189794#584 +-0.7619330622480646#585 +-0.7488281252605818#586 +-0.7354236532965415#587 +-0.7217250082114348#588 +-0.7077376695314656#589 +-0.6934672322617121#590 +-0.6789194046480973#591 +-0.6641000058940624#592 +-0.6490149638328556#593 +-0.6336703125563705#594 +-0.6180721900014786#595 +-0.6022268354948238#596 +-0.5861405872570615#597 +-0.569819879867538#598 +-0.5532712416904271#599 +-0.5365012922633521#600 +-0.5195167396495373#601 +-0.5023243777545499#602 +-0.4849310836087036#603 +-0.4673438146162124#604 +-0.44956960577219424#605 +-0.43161556684863794#606 +-0.4134888795504591#607 +-0.3951967946427822#608 +-0.3767466290505987#609 +-0.3581457629319605#610 +-0.33940163672588003#611 +-0.32052174817611767#612 +-0.30151364933204683#613 +-0.28238494352779664#614 +-0.26314328234088047#615 +-0.24379636253152692#616 +-0.2243519229639374#617 +-0.20481774151070187#618 +-0.1852016319416111#619 +-0.16551144079810998#620 +-0.14575504425464175#621 +-0.12594034496813916#622 +-0.10607526891692229#623 +-0.08616776223026779#624 +-0.06622578800991763#625 +-0.04625732314479881#626 +-0.02627035512022804#627 +-0.006272878822877913#628 +0.013727106657217596#629 +0.03372160122633892#630 +0.053702606987158195#631 +0.07366213143793802#632 +0.0935921906695719#633 +0.11348481255918764#634 +0.13333203995903614#635 +0.1531259338793901#636 +0.17285857666417945#637 +0.19252207515809314#638 +0.21210856386388055#639 +0.2316102080885896#640 +0.2510192070774827#641 +0.2703277971343779#642 +0.2895282547271654#643 +0.3086128995772594#644 +0.3275740977317474#645 +0.34640426461700946#646 +0.36509586807258537#647 +0.38364143136407647#648 +0.4020335361738763#649 +0.4202648255685349#650 +0.43832800694156854#651 +0.45621585493053873#652 +0.4739212143072332#653 +0.49143700283979275#654 +0.508756214125639#655 +0.5258719203940706#656 +0.5427772752774059#657 +0.5594655165495643#658 +0.5759299688309899#659 +0.5921640462588365#660 +0.6081612551213462#661 +0.6239151964553658#662 +0.6394195686059639#663 +0.6546681697471249#664 +0.6696549003625094#665 +0.6843737656852915#666 +0.6988188780960954#667 +0.7129844594780727#668 +0.7268648435281768#669 +0.740454478023714#670 +0.7537479270432587#671 +0.7667398731410499#672 +0.7794251194739955#673 +0.7917985918804359#674 +0.8038553409098333#675 +0.8155905438025771#676 +0.8269995064191112#677 +0.8380776651176137#678 +0.8488205885794762#679 +0.8592239795818529#680 +0.8692836767165718#681 +0.878995656054718#682 +0.8883560327562258#683 +0.8973610626238337#684 +0.9060071436007824#685 +0.9142908172116547#686 +0.9222087699457837#687 +0.929757834582673#688 +0.9369349914589009#689 +0.9437373696760004#690 +0.9501622482488337#691 +0.9562070571939989#692 +0.9618693785578367#693 +0.9671469473836236#694 +0.9720376526175663#695 +0.976539537953233#696 +0.9806508026140864#697 +0.9843698020738031#698 +0.9876950487140919#699 +0.990625212419749#700 +0.9931591211107106#701 +0.9952957612108906#702 +0.9970342780536162#703 +0.9983739762234987#704 +0.9993143198346034#705 +0.9998549327448063#706 +0.9999955987062531#707 +0.999736261451859#708 +0.9990770247178167#709 +0.9980181522021#710 +0.9965600674589848#711 +0.9947033537296244#712 +0.99244875370875#713 +0.9897971692475899#714 +0.9867496609931237#715 +0.9833074479638189#716 +0.9794719070620168#717 +0.9752445725231655#718 +0.9706271353021171#719 +0.9656214423967383#720 +0.9602294961091015#721 +0.9544534532445539#722 +0.9482956242489854#723 +0.9417584722846377#724 +0.934844612244828#725 +0.9275568097079782#726 +0.9198979798313699#727 +0.911871186185067#728 +0.9034796395264725#729 +0.8947266965160092#730 +0.8856158583744393#731 +0.8761507694823586#732 +0.8663352159224256#733 +0.8561731239649102#734 +0.8456685584971658#735 +0.8348257213976545#736 +0.8236489498551739#737 +0.812142714633961#738 +0.8003116182853636#739 +0.7881603933067972#740 +0.7756939002487224#741 +0.7629171257704004#742 +0.7498351806452045#743 +0.7364532977162856#744 +0.7227768298034087#745 +0.7088112475617983#746 +0.6945621372938487#747 +0.6800351987145765#748 +0.6652362426717048#749
\ No newline at end of file diff --git a/MPChartExample/src/main/assets/square.txt b/MPChartExample/src/main/assets/square.txt new file mode 100644 index 00000000..2291816a --- /dev/null +++ b/MPChartExample/src/main/assets/square.txt @@ -0,0 +1,100 @@ +0.0#0 +0.0025000000745058065#1 +0.010000000298023226#2 +0.02250000178813938#3 +0.040000001192092904#4 +0.0625#5 +0.09000000715255752#6 +0.1225000166893011#7 +0.16000002861023077#8 +0.2025000429153465#9 +0.25000005960464833#10 +0.3025000786781362#11 +0.3600001001358102#12 +0.42250012397767023#13 +0.49000015020371634#14 +0.5625001788139485#15 +0.6400002098083668#16 +0.7225002431869711#17 +0.8100002789497616#18 +0.9025003170967381#19 +1.0000002384185933#20 +1.10250015020371#21 +1.210000052452088#22 +1.3224999451637274#23 +1.4399998283386282#24 +1.5624997019767903#25 +1.6899995660782139#26 +1.8224994206428988#27 +1.9599992656708451#28 +2.102499101162053#29 +2.249998927116522#30 +2.4024987435342524#31 +2.5599985504152443#32 +2.7224983477594975#33 +2.889998135567012#34 +3.062497913837788#35 +3.2399976825718255#36 +3.4224974417691243#37 +3.6099971914296844#38 +3.802496931553506#39 +3.999996662140589#40 +4.202496871948824#41 +4.4099965953833475#42 +4.622496309281132#43 +4.839996013642178#44 +5.062495708466486#45 +5.2899953937540545#46 +5.522495069504885#47 +5.759994735718976#48 +6.002494392396329#49 +6.2499940395369435#50 +6.502493677140819#51 +6.759993305207956#52 +7.022492923738355#53 +7.289992532732015#54 +7.562492132188936#55 +7.839991722109119#56 +8.122491302492563#57 +8.409990873339268#58 +8.702490434649235#59 +8.999989986422463#60 +9.302489528658953#61 +9.609989061358704#62 +9.922488584521716#63 +10.23998809814799#64 +10.562487602237525#65 +10.889987096790321#66 +11.222486581806379#67 +11.559986057285698#68 +11.902485523228279#69 +12.249984979634121#70 +12.602484426503224#71 +12.959983863835589#72 +13.322483291631215#73 +13.689982709890103#74 +14.062482118612252#75 +14.439981517797662#76 +14.822480907446334#77 +15.209980287558267#78 +15.602479658133461#79 +15.999979019171917#80 +16.402478370673634#81 +16.809979667669722#82 +17.222481002812856#83 +17.639982376103035#84 +18.06248378754026#85 +18.48998523712453#86 +18.922486724855844#87 +19.359988250734204#88 +19.80248981475961#89 +20.249991416932062#90 +20.70249305725156#91 +21.1599947357181#92 +21.62249645233169#93 +22.08999820709232#94 +22.5625#95 +23.040001831054724#96 +23.522503700256493#97 +24.010005607605308#98 +24.502507553101168#99
\ No newline at end of file diff --git a/MPChartExample/src/main/assets/stacked_bars.txt b/MPChartExample/src/main/assets/stacked_bars.txt new file mode 100644 index 00000000..c9211fca --- /dev/null +++ b/MPChartExample/src/main/assets/stacked_bars.txt @@ -0,0 +1,7 @@ +4#2#6#0 +0#2#8#1 +3#8#2#2 +0#7#0#3 +5#5#2#4 +9#0#0#5 +3#3#6#6
\ No newline at end of file diff --git a/MPChartExample/src/main/assets/three.txt b/MPChartExample/src/main/assets/three.txt new file mode 100644 index 00000000..4a1faf68 --- /dev/null +++ b/MPChartExample/src/main/assets/three.txt @@ -0,0 +1,100 @@ +0.0#0 +1.2500000558793553E-4#1 +0.0010000000447034842#2 +0.0033750004023313683#3 +0.008000000357627874#4 +0.015625#5 +0.027000003218650946#6 +0.04287500876188338#7 +0.06400001716613923#8 +0.09112502896786043#9 +0.1250000447034889#10 +0.1663750649094666#11 +0.21600009012223542#12 +0.2746251208782373#13 +0.34300015771391423#14 +0.4218752011657081#15 +0.5120002517700608#16 +0.6141253100634143#17 +0.7290003765822105#18 +0.8573754518628914#19 +1.0000003576279113#20 +1.1576252365708513#21 +1.3310000865459461#22 +1.5208749054074306#23 +1.7279996910095399#24 +1.9531244412065085#25 +2.1969991538525715#26 +2.4603738268019635#27 +2.743998457908919#28 +3.048623045027674#29 +3.374997586012462#30 +3.723872078717519#31 +4.095996520997079#32 +4.492120910705377#33 +4.9129952456966475#34 +5.359369523825126#35 +5.8319937429450475#36 +6.331617900910646#37 +6.858991995576157#38 +7.414866024795816#39 +7.999989986423856#40 +8.615115381244424#41 +9.260989275459615#42 +9.938363097434028#43 +10.647986845021897#44 +11.390610516077459#45 +12.166984108454947#46 +12.977857620008598#47 +13.823981048592644#48 +14.706104392061324#49 +15.624977648268867#50 +16.581350815069513#51 +17.575973890317496#52 +18.609596871867048#53 +19.682969757572405#54 +20.796842545287802#55 +21.951965232867476#56 +23.149087818165658#57 +24.388960299036587#58 +25.672332673334495#59 +26.999954938913618#60 +28.37257709362819#61 +29.790949135332447#62 +31.25582106188062#63 +32.76794287112695#64 +34.32806456092567#65 +35.93693612913101#66 +37.59530757359721#67 +39.303928892178504#68 +41.06355008272912#69 +42.87492114310331#70 +44.73879207115529#71 +46.65591286473931#72 +48.627033521709585#73 +50.65290403992037#74 +52.73427441722589#75 +54.87189465148038#76 +57.06651474053808#77 +59.31888468225323#78 +61.629754474480045#79 +63.99987411507277#80 +66.42999360188564#81 +68.9208749562066#82 +71.47325674254265#83 +74.08788896947685#84 +76.76552164559234#85 +79.50690477947222#86 +82.31278837969957#87 +85.18392245485751#88 +88.12105701352914#89 +91.12494206429756#90 +94.19632761574586#91 +97.33596367645715#92 +100.54460025501454#93 +103.82298736000112#94 +107.171875#95 +110.59201318359428#96 +114.08415191936705#97 +117.64904121590142#98 +121.2874310817805#99
\ No newline at end of file diff --git a/MPChartExample/src/main/ic_launcher-web.png b/MPChartExample/src/main/ic_launcher-web.png Binary files differnew file mode 100644 index 00000000..ef559220 --- /dev/null +++ b/MPChartExample/src/main/ic_launcher-web.png diff --git a/MPChartExample/src/main/java/com/xxmassdeveloper/mpchartexample/AnotherBarActivity.java b/MPChartExample/src/main/java/com/xxmassdeveloper/mpchartexample/AnotherBarActivity.java new file mode 100644 index 00000000..69b5a96c --- /dev/null +++ b/MPChartExample/src/main/java/com/xxmassdeveloper/mpchartexample/AnotherBarActivity.java @@ -0,0 +1,214 @@ + +package com.xxmassdeveloper.mpchartexample; + +import android.Manifest; +import android.content.Intent; +import android.content.pm.PackageManager; +import android.net.Uri; +import android.os.Bundle; +import androidx.core.content.ContextCompat; +import android.view.Menu; +import android.view.MenuItem; +import android.view.WindowManager; +import android.widget.SeekBar; +import android.widget.SeekBar.OnSeekBarChangeListener; +import android.widget.TextView; + +import com.github.mikephil.charting.charts.BarChart; +import com.github.mikephil.charting.components.XAxis; +import com.github.mikephil.charting.components.XAxis.XAxisPosition; +import com.github.mikephil.charting.data.BarData; +import com.github.mikephil.charting.data.BarDataSet; +import com.github.mikephil.charting.data.BarEntry; +import com.github.mikephil.charting.interfaces.datasets.IBarDataSet; +import com.github.mikephil.charting.interfaces.datasets.IDataSet; +import com.github.mikephil.charting.utils.ColorTemplate; +import com.xxmassdeveloper.mpchartexample.notimportant.DemoBase; + +import java.util.ArrayList; + +public class AnotherBarActivity extends DemoBase implements OnSeekBarChangeListener { + + private BarChart chart; + private SeekBar seekBarX, seekBarY; + private TextView tvX, tvY; + + @Override + protected void onCreate(Bundle savedInstanceState) { + super.onCreate(savedInstanceState); + getWindow().setFlags(WindowManager.LayoutParams.FLAG_FULLSCREEN, + WindowManager.LayoutParams.FLAG_FULLSCREEN); + setContentView(R.layout.activity_barchart); + + setTitle("AnotherBarActivity"); + + tvX = findViewById(R.id.tvXMax); + tvY = findViewById(R.id.tvYMax); + + seekBarX = findViewById(R.id.seekBar1); + seekBarX.setOnSeekBarChangeListener(this); + + seekBarY = findViewById(R.id.seekBar2); + seekBarY.setOnSeekBarChangeListener(this); + + chart = findViewById(R.id.chart1); + + chart.getDescription().setEnabled(false); + + // if more than 60 entries are displayed in the chart, no values will be + // drawn + chart.setMaxVisibleValueCount(60); + + // scaling can now only be done on x- and y-axis separately + chart.setPinchZoom(false); + + chart.setDrawBarShadow(false); + chart.setDrawGridBackground(false); + + XAxis xAxis = chart.getXAxis(); + xAxis.setPosition(XAxisPosition.BOTTOM); + xAxis.setDrawGridLines(false); + + chart.getAxisLeft().setDrawGridLines(false); + + // setting data + seekBarX.setProgress(10); + seekBarY.setProgress(100); + + // add a nice and smooth animation + chart.animateY(1500); + + chart.getLegend().setEnabled(false); + } + + @Override + public void onProgressChanged(SeekBar seekBar, int progress, boolean fromUser) { + + tvX.setText(String.valueOf(seekBarX.getProgress())); + tvY.setText(String.valueOf(seekBarY.getProgress())); + + ArrayList<BarEntry> values = new ArrayList<>(); + + for (int i = 0; i < seekBarX.getProgress(); i++) { + float multi = (seekBarY.getProgress() + 1); + float val = (float) (Math.random() * multi) + multi / 3; + values.add(new BarEntry(i, val)); + } + + BarDataSet set1; + + if (chart.getData() != null && + chart.getData().getDataSetCount() > 0) { + set1 = (BarDataSet) chart.getData().getDataSetByIndex(0); + set1.setValues(values); + chart.getData().notifyDataChanged(); + chart.notifyDataSetChanged(); + } else { + set1 = new BarDataSet(values, "Data Set"); + set1.setColors(ColorTemplate.VORDIPLOM_COLORS); + set1.setDrawValues(false); + + ArrayList<IBarDataSet> dataSets = new ArrayList<>(); + dataSets.add(set1); + + BarData data = new BarData(dataSets); + chart.setData(data); + chart.setFitBars(true); + } + + chart.invalidate(); + } + + @Override + public boolean onCreateOptionsMenu(Menu menu) { + getMenuInflater().inflate(R.menu.bar, menu); + menu.removeItem(R.id.actionToggleIcons); + return true; + } + + @Override + public boolean onOptionsItemSelected(MenuItem item) { + + switch (item.getItemId()) { + case R.id.viewGithub: { + Intent i = new Intent(Intent.ACTION_VIEW); + i.setData(Uri.parse("https://github.com/PhilJay/MPAndroidChart/blob/master/MPChartExample/src/com/xxmassdeveloper/mpchartexample/AnotherBarActivity.java")); + startActivity(i); + break; + } + case R.id.actionToggleValues: { + + for (IDataSet set : chart.getData().getDataSets()) + set.setDrawValues(!set.isDrawValuesEnabled()); + + chart.invalidate(); + break; + } + /* + case R.id.actionToggleIcons: { break; } + */ + case R.id.actionToggleHighlight: { + + if(chart.getData() != null) { + chart.getData().setHighlightEnabled(!chart.getData().isHighlightEnabled()); + chart.invalidate(); + } + break; + } + case R.id.actionTogglePinch: { + if (chart.isPinchZoomEnabled()) + chart.setPinchZoom(false); + else + chart.setPinchZoom(true); + + chart.invalidate(); + break; + } + case R.id.actionToggleAutoScaleMinMax: { + chart.setAutoScaleMinMaxEnabled(!chart.isAutoScaleMinMaxEnabled()); + chart.notifyDataSetChanged(); + break; + } + case R.id.actionToggleBarBorders: { + for (IBarDataSet set : chart.getData().getDataSets()) + ((BarDataSet)set).setBarBorderWidth(set.getBarBorderWidth() == 1.f ? 0.f : 1.f); + + chart.invalidate(); + break; + } + case R.id.animateX: { + chart.animateX(2000); + break; + } + case R.id.animateY: { + chart.animateY(2000); + break; + } + case R.id.animateXY: { + + chart.animateXY(2000, 2000); + break; + } + case R.id.actionSave: { + if (ContextCompat.checkSelfPermission(this, Manifest.permission.WRITE_EXTERNAL_STORAGE) == PackageManager.PERMISSION_GRANTED) { + saveToGallery(); + } else { + requestStoragePermission(chart); + } + break; + } + } + return true; + } + + @Override + protected void saveToGallery() { + saveToGallery(chart, "AnotherBarActivity"); + } + + @Override + public void onStartTrackingTouch(SeekBar seekBar) {} + + @Override + public void onStopTrackingTouch(SeekBar seekBar) {} +} diff --git a/MPChartExample/src/main/java/com/xxmassdeveloper/mpchartexample/BarChartActivity.java b/MPChartExample/src/main/java/com/xxmassdeveloper/mpchartexample/BarChartActivity.java new file mode 100644 index 00000000..0d83e344 --- /dev/null +++ b/MPChartExample/src/main/java/com/xxmassdeveloper/mpchartexample/BarChartActivity.java @@ -0,0 +1,327 @@ + +package com.xxmassdeveloper.mpchartexample; + +import android.Manifest; +import android.content.Intent; +import android.content.pm.PackageManager; +import android.graphics.RectF; +import android.net.Uri; +import android.os.Bundle; +import androidx.core.content.ContextCompat; +import android.util.Log; +import android.view.Menu; +import android.view.MenuItem; +import android.view.WindowManager; +import android.widget.SeekBar; +import android.widget.SeekBar.OnSeekBarChangeListener; +import android.widget.TextView; + +import com.github.mikephil.charting.charts.BarChart; +import com.github.mikephil.charting.components.Legend; +import com.github.mikephil.charting.components.Legend.LegendForm; +import com.github.mikephil.charting.components.XAxis; +import com.github.mikephil.charting.components.XAxis.XAxisPosition; +import com.github.mikephil.charting.components.YAxis; +import com.github.mikephil.charting.components.YAxis.AxisDependency; +import com.github.mikephil.charting.components.YAxis.YAxisLabelPosition; +import com.github.mikephil.charting.data.BarData; +import com.github.mikephil.charting.data.BarDataSet; +import com.github.mikephil.charting.data.BarEntry; +import com.github.mikephil.charting.data.Entry; +import com.github.mikephil.charting.formatter.IAxisValueFormatter; +import com.github.mikephil.charting.highlight.Highlight; +import com.github.mikephil.charting.interfaces.datasets.IBarDataSet; +import com.github.mikephil.charting.interfaces.datasets.IDataSet; +import com.github.mikephil.charting.listener.OnChartValueSelectedListener; +import com.github.mikephil.charting.utils.Fill; +import com.github.mikephil.charting.utils.MPPointF; +import com.xxmassdeveloper.mpchartexample.custom.DayAxisValueFormatter; +import com.xxmassdeveloper.mpchartexample.custom.MyAxisValueFormatter; +import com.xxmassdeveloper.mpchartexample.custom.XYMarkerView; +import com.xxmassdeveloper.mpchartexample.notimportant.DemoBase; + +import java.util.ArrayList; +import java.util.List; + +public class BarChartActivity extends DemoBase implements OnSeekBarChangeListener, + OnChartValueSelectedListener { + + private BarChart chart; + private SeekBar seekBarX, seekBarY; + private TextView tvX, tvY; + + @Override + protected void onCreate(Bundle savedInstanceState) { + super.onCreate(savedInstanceState); + getWindow().setFlags(WindowManager.LayoutParams.FLAG_FULLSCREEN, + WindowManager.LayoutParams.FLAG_FULLSCREEN); + setContentView(R.layout.activity_barchart); + + setTitle("BarChartActivity"); + + tvX = findViewById(R.id.tvXMax); + tvY = findViewById(R.id.tvYMax); + + seekBarX = findViewById(R.id.seekBar1); + seekBarY = findViewById(R.id.seekBar2); + + seekBarY.setOnSeekBarChangeListener(this); + seekBarX.setOnSeekBarChangeListener(this); + + chart = findViewById(R.id.chart1); + chart.setOnChartValueSelectedListener(this); + + chart.setDrawBarShadow(false); + chart.setDrawValueAboveBar(true); + + chart.getDescription().setEnabled(false); + + // if more than 60 entries are displayed in the chart, no values will be + // drawn + chart.setMaxVisibleValueCount(60); + + // scaling can now only be done on x- and y-axis separately + chart.setPinchZoom(false); + + chart.setDrawGridBackground(false); + // chart.setDrawYLabels(false); + + IAxisValueFormatter xAxisFormatter = new DayAxisValueFormatter(chart); + + XAxis xAxis = chart.getXAxis(); + xAxis.setPosition(XAxisPosition.BOTTOM); + xAxis.setTypeface(tfLight); + xAxis.setDrawGridLines(false); + xAxis.setGranularity(1f); // only intervals of 1 day + xAxis.setLabelCount(7); + xAxis.setValueFormatter(xAxisFormatter); + + IAxisValueFormatter custom = new MyAxisValueFormatter(); + + YAxis leftAxis = chart.getAxisLeft(); + leftAxis.setTypeface(tfLight); + leftAxis.setLabelCount(8, false); + leftAxis.setValueFormatter(custom); + leftAxis.setPosition(YAxisLabelPosition.OUTSIDE_CHART); + leftAxis.setSpaceTop(15f); + leftAxis.setAxisMinimum(0f); // this replaces setStartAtZero(true) + + YAxis rightAxis = chart.getAxisRight(); + rightAxis.setDrawGridLines(false); + rightAxis.setTypeface(tfLight); + rightAxis.setLabelCount(8, false); + rightAxis.setValueFormatter(custom); + rightAxis.setSpaceTop(15f); + rightAxis.setAxisMinimum(0f); // this replaces setStartAtZero(true) + + Legend l = chart.getLegend(); + l.setVerticalAlignment(Legend.LegendVerticalAlignment.BOTTOM); + l.setHorizontalAlignment(Legend.LegendHorizontalAlignment.LEFT); + l.setOrientation(Legend.LegendOrientation.HORIZONTAL); + l.setDrawInside(false); + l.setForm(LegendForm.SQUARE); + l.setFormSize(9f); + l.setTextSize(11f); + l.setXEntrySpace(4f); + + XYMarkerView mv = new XYMarkerView(this, xAxisFormatter); + mv.setChartView(chart); // For bounds control + chart.setMarker(mv); // Set the marker to the chart + + // setting data + seekBarY.setProgress(50); + seekBarX.setProgress(12); + + // chart.setDrawLegend(false); + } + + private void setData(int count, float range) { + + float start = 1f; + + ArrayList<BarEntry> values = new ArrayList<>(); + + for (int i = (int) start; i < start + count; i++) { + float val = (float) (Math.random() * (range + 1)); + + if (Math.random() * 100 < 25) { + values.add(new BarEntry(i, val, getResources().getDrawable(R.drawable.star))); + } else { + values.add(new BarEntry(i, val)); + } + } + + BarDataSet set1; + + if (chart.getData() != null && + chart.getData().getDataSetCount() > 0) { + set1 = (BarDataSet) chart.getData().getDataSetByIndex(0); + set1.setValues(values); + chart.getData().notifyDataChanged(); + chart.notifyDataSetChanged(); + + } else { + set1 = new BarDataSet(values, "The year 2017"); + + set1.setDrawIcons(false); + + int startColor1 = ContextCompat.getColor(this, android.R.color.holo_orange_light); + int startColor2 = ContextCompat.getColor(this, android.R.color.holo_blue_light); + int startColor3 = ContextCompat.getColor(this, android.R.color.holo_orange_light); + int startColor4 = ContextCompat.getColor(this, android.R.color.holo_green_light); + int startColor5 = ContextCompat.getColor(this, android.R.color.holo_red_light); + int endColor1 = ContextCompat.getColor(this, android.R.color.holo_blue_dark); + int endColor2 = ContextCompat.getColor(this, android.R.color.holo_purple); + int endColor3 = ContextCompat.getColor(this, android.R.color.holo_green_dark); + int endColor4 = ContextCompat.getColor(this, android.R.color.holo_red_dark); + int endColor5 = ContextCompat.getColor(this, android.R.color.holo_orange_dark); + + List<Fill> gradientFills = new ArrayList<>(); + gradientFills.add(new Fill(startColor1, endColor1)); + gradientFills.add(new Fill(startColor2, endColor2)); + gradientFills.add(new Fill(startColor3, endColor3)); + gradientFills.add(new Fill(startColor4, endColor4)); + gradientFills.add(new Fill(startColor5, endColor5)); + + set1.setFills(gradientFills); + + ArrayList<IBarDataSet> dataSets = new ArrayList<>(); + dataSets.add(set1); + + BarData data = new BarData(dataSets); + data.setValueTextSize(10f); + data.setValueTypeface(tfLight); + data.setBarWidth(0.9f); + + chart.setData(data); + } + } + + @Override + public boolean onCreateOptionsMenu(Menu menu) { + getMenuInflater().inflate(R.menu.bar, menu); + return true; + } + + @Override + public boolean onOptionsItemSelected(MenuItem item) { + + switch (item.getItemId()) { + case R.id.viewGithub: { + Intent i = new Intent(Intent.ACTION_VIEW); + i.setData(Uri.parse("https://github.com/PhilJay/MPAndroidChart/blob/master/MPChartExample/src/com/xxmassdeveloper/mpchartexample/BarChartActivity.java")); + startActivity(i); + break; + } + case R.id.actionToggleValues: { + for (IDataSet set : chart.getData().getDataSets()) + set.setDrawValues(!set.isDrawValuesEnabled()); + + chart.invalidate(); + break; + } + case R.id.actionToggleIcons: { + for (IDataSet set : chart.getData().getDataSets()) + set.setDrawIcons(!set.isDrawIconsEnabled()); + + chart.invalidate(); + break; + } + case R.id.actionToggleHighlight: { + if (chart.getData() != null) { + chart.getData().setHighlightEnabled(!chart.getData().isHighlightEnabled()); + chart.invalidate(); + } + break; + } + case R.id.actionTogglePinch: { + if (chart.isPinchZoomEnabled()) + chart.setPinchZoom(false); + else + chart.setPinchZoom(true); + + chart.invalidate(); + break; + } + case R.id.actionToggleAutoScaleMinMax: { + chart.setAutoScaleMinMaxEnabled(!chart.isAutoScaleMinMaxEnabled()); + chart.notifyDataSetChanged(); + break; + } + case R.id.actionToggleBarBorders: { + for (IBarDataSet set : chart.getData().getDataSets()) + ((BarDataSet) set).setBarBorderWidth(set.getBarBorderWidth() == 1.f ? 0.f : 1.f); + + chart.invalidate(); + break; + } + case R.id.animateX: { + chart.animateX(2000); + break; + } + case R.id.animateY: { + chart.animateY(2000); + break; + } + case R.id.animateXY: { + chart.animateXY(2000, 2000); + break; + } + case R.id.actionSave: { + if (ContextCompat.checkSelfPermission(this, Manifest.permission.WRITE_EXTERNAL_STORAGE) == PackageManager.PERMISSION_GRANTED) { + saveToGallery(); + } else { + requestStoragePermission(chart); + } + break; + } + } + return true; + } + + @Override + public void onProgressChanged(SeekBar seekBar, int progress, boolean fromUser) { + + tvX.setText(String.valueOf(seekBarX.getProgress())); + tvY.setText(String.valueOf(seekBarY.getProgress())); + + setData(seekBarX.getProgress(), seekBarY.getProgress()); + chart.invalidate(); + } + + @Override + protected void saveToGallery() { + saveToGallery(chart, "BarChartActivity"); + } + + @Override + public void onStartTrackingTouch(SeekBar seekBar) {} + + @Override + public void onStopTrackingTouch(SeekBar seekBar) {} + + private final RectF onValueSelectedRectF = new RectF(); + + @Override + public void onValueSelected(Entry e, Highlight h) { + + if (e == null) + return; + + RectF bounds = onValueSelectedRectF; + chart.getBarBounds((BarEntry) e, bounds); + MPPointF position = chart.getPosition(e, AxisDependency.LEFT); + + Log.i("bounds", bounds.toString()); + Log.i("position", position.toString()); + + Log.i("x-index", + "low: " + chart.getLowestVisibleX() + ", high: " + + chart.getHighestVisibleX()); + + MPPointF.recycleInstance(position); + } + + @Override + public void onNothingSelected() { } +} diff --git a/MPChartExample/src/main/java/com/xxmassdeveloper/mpchartexample/BarChartActivityMultiDataset.java b/MPChartExample/src/main/java/com/xxmassdeveloper/mpchartexample/BarChartActivityMultiDataset.java new file mode 100644 index 00000000..075af0ed --- /dev/null +++ b/MPChartExample/src/main/java/com/xxmassdeveloper/mpchartexample/BarChartActivityMultiDataset.java @@ -0,0 +1,289 @@ + +package com.xxmassdeveloper.mpchartexample; + +import android.Manifest; +import android.content.Intent; +import android.content.pm.PackageManager; +import android.graphics.Color; +import android.net.Uri; +import android.os.Bundle; +import androidx.core.content.ContextCompat; +import android.util.Log; +import android.view.Menu; +import android.view.MenuItem; +import android.view.WindowManager; +import android.widget.SeekBar; +import android.widget.SeekBar.OnSeekBarChangeListener; +import android.widget.TextView; + +import com.github.mikephil.charting.charts.BarChart; +import com.github.mikephil.charting.components.AxisBase; +import com.github.mikephil.charting.components.Legend; +import com.github.mikephil.charting.components.XAxis; +import com.github.mikephil.charting.components.YAxis; +import com.github.mikephil.charting.data.BarData; +import com.github.mikephil.charting.data.BarDataSet; +import com.github.mikephil.charting.data.BarEntry; +import com.github.mikephil.charting.data.Entry; +import com.github.mikephil.charting.formatter.IAxisValueFormatter; +import com.github.mikephil.charting.formatter.LargeValueFormatter; +import com.github.mikephil.charting.highlight.Highlight; +import com.github.mikephil.charting.interfaces.datasets.IBarDataSet; +import com.github.mikephil.charting.listener.OnChartValueSelectedListener; +import com.xxmassdeveloper.mpchartexample.custom.MyMarkerView; +import com.xxmassdeveloper.mpchartexample.notimportant.DemoBase; + +import java.util.ArrayList; +import java.util.Locale; + +public class BarChartActivityMultiDataset extends DemoBase implements OnSeekBarChangeListener, + OnChartValueSelectedListener { + + private BarChart chart; + private SeekBar seekBarX, seekBarY; + private TextView tvX, tvY; + + @Override + protected void onCreate(Bundle savedInstanceState) { + super.onCreate(savedInstanceState); + getWindow().setFlags(WindowManager.LayoutParams.FLAG_FULLSCREEN, + WindowManager.LayoutParams.FLAG_FULLSCREEN); + setContentView(R.layout.activity_barchart); + + setTitle("BarChartActivityMultiDataset"); + + tvX = findViewById(R.id.tvXMax); + tvX.setTextSize(10); + tvY = findViewById(R.id.tvYMax); + + seekBarX = findViewById(R.id.seekBar1); + seekBarX.setMax(50); + seekBarX.setOnSeekBarChangeListener(this); + + seekBarY = findViewById(R.id.seekBar2); + seekBarY.setOnSeekBarChangeListener(this); + + chart = findViewById(R.id.chart1); + chart.setOnChartValueSelectedListener(this); + chart.getDescription().setEnabled(false); + +// chart.setDrawBorders(true); + + // scaling can now only be done on x- and y-axis separately + chart.setPinchZoom(false); + + chart.setDrawBarShadow(false); + + chart.setDrawGridBackground(false); + + // create a custom MarkerView (extend MarkerView) and specify the layout + // to use for it + MyMarkerView mv = new MyMarkerView(this, R.layout.custom_marker_view); + mv.setChartView(chart); // For bounds control + chart.setMarker(mv); // Set the marker to the chart + + seekBarX.setProgress(10); + seekBarY.setProgress(100); + + Legend l = chart.getLegend(); + l.setVerticalAlignment(Legend.LegendVerticalAlignment.TOP); + l.setHorizontalAlignment(Legend.LegendHorizontalAlignment.RIGHT); + l.setOrientation(Legend.LegendOrientation.VERTICAL); + l.setDrawInside(true); + l.setTypeface(tfLight); + l.setYOffset(0f); + l.setXOffset(10f); + l.setYEntrySpace(0f); + l.setTextSize(8f); + + XAxis xAxis = chart.getXAxis(); + xAxis.setTypeface(tfLight); + xAxis.setGranularity(1f); + xAxis.setCenterAxisLabels(true); + xAxis.setValueFormatter(new IAxisValueFormatter() { + @Override + public String getFormattedValue(float value, AxisBase axis) { + return String.valueOf((int) value); + } + }); + + YAxis leftAxis = chart.getAxisLeft(); + leftAxis.setTypeface(tfLight); + leftAxis.setValueFormatter(new LargeValueFormatter()); + leftAxis.setDrawGridLines(false); + leftAxis.setSpaceTop(35f); + leftAxis.setAxisMinimum(0f); // this replaces setStartAtZero(true) + + chart.getAxisRight().setEnabled(false); + } + + @Override + public void onProgressChanged(SeekBar seekBar, int progress, boolean fromUser) { + + float groupSpace = 0.08f; + float barSpace = 0.03f; // x4 DataSet + float barWidth = 0.2f; // x4 DataSet + // (0.2 + 0.03) * 4 + 0.08 = 1.00 -> interval per "group" + + int groupCount = seekBarX.getProgress() + 1; + int startYear = 1980; + int endYear = startYear + groupCount; + + tvX.setText(String.format(Locale.ENGLISH, "%d-%d", startYear, endYear)); + tvY.setText(String.valueOf(seekBarY.getProgress())); + + ArrayList<BarEntry> values1 = new ArrayList<>(); + ArrayList<BarEntry> values2 = new ArrayList<>(); + ArrayList<BarEntry> values3 = new ArrayList<>(); + ArrayList<BarEntry> values4 = new ArrayList<>(); + + float randomMultiplier = seekBarY.getProgress() * 100000f; + + for (int i = startYear; i < endYear; i++) { + values1.add(new BarEntry(i, (float) (Math.random() * randomMultiplier))); + values2.add(new BarEntry(i, (float) (Math.random() * randomMultiplier))); + values3.add(new BarEntry(i, (float) (Math.random() * randomMultiplier))); + values4.add(new BarEntry(i, (float) (Math.random() * randomMultiplier))); + } + + BarDataSet set1, set2, set3, set4; + + if (chart.getData() != null && chart.getData().getDataSetCount() > 0) { + + set1 = (BarDataSet) chart.getData().getDataSetByIndex(0); + set2 = (BarDataSet) chart.getData().getDataSetByIndex(1); + set3 = (BarDataSet) chart.getData().getDataSetByIndex(2); + set4 = (BarDataSet) chart.getData().getDataSetByIndex(3); + set1.setValues(values1); + set2.setValues(values2); + set3.setValues(values3); + set4.setValues(values4); + chart.getData().notifyDataChanged(); + chart.notifyDataSetChanged(); + + } else { + // create 4 DataSets + set1 = new BarDataSet(values1, "Company A"); + set1.setColor(Color.rgb(104, 241, 175)); + set2 = new BarDataSet(values2, "Company B"); + set2.setColor(Color.rgb(164, 228, 251)); + set3 = new BarDataSet(values3, "Company C"); + set3.setColor(Color.rgb(242, 247, 158)); + set4 = new BarDataSet(values4, "Company D"); + set4.setColor(Color.rgb(255, 102, 0)); + + BarData data = new BarData(set1, set2, set3, set4); + data.setValueFormatter(new LargeValueFormatter()); + data.setValueTypeface(tfLight); + + chart.setData(data); + } + + // specify the width each bar should have + chart.getBarData().setBarWidth(barWidth); + + // restrict the x-axis range + chart.getXAxis().setAxisMinimum(startYear); + + // barData.getGroupWith(...) is a helper that calculates the width each group needs based on the provided parameters + chart.getXAxis().setAxisMaximum(startYear + chart.getBarData().getGroupWidth(groupSpace, barSpace) * groupCount); + chart.groupBars(startYear, groupSpace, barSpace); + chart.invalidate(); + } + + @Override + public boolean onCreateOptionsMenu(Menu menu) { + getMenuInflater().inflate(R.menu.bar, menu); + return true; + } + + @Override + public boolean onOptionsItemSelected(MenuItem item) { + + switch (item.getItemId()) { + case R.id.viewGithub: { + Intent i = new Intent(Intent.ACTION_VIEW); + i.setData(Uri.parse("https://github.com/PhilJay/MPAndroidChart/blob/master/MPChartExample/src/com/xxmassdeveloper/mpchartexample/BarChartActivityMultiDataset.java")); + startActivity(i); + break; + } + case R.id.actionToggleValues: { + for (IBarDataSet set : chart.getData().getDataSets()) + set.setDrawValues(!set.isDrawValuesEnabled()); + + chart.invalidate(); + break; + } + case R.id.actionTogglePinch: { + if (chart.isPinchZoomEnabled()) + chart.setPinchZoom(false); + else + chart.setPinchZoom(true); + + chart.invalidate(); + break; + } + case R.id.actionToggleAutoScaleMinMax: { + chart.setAutoScaleMinMaxEnabled(!chart.isAutoScaleMinMaxEnabled()); + chart.notifyDataSetChanged(); + break; + } + case R.id.actionToggleBarBorders: { + for (IBarDataSet set : chart.getData().getDataSets()) + ((BarDataSet) set).setBarBorderWidth(set.getBarBorderWidth() == 1.f ? 0.f : 1.f); + + chart.invalidate(); + break; + } + case R.id.actionToggleHighlight: { + if (chart.getData() != null) { + chart.getData().setHighlightEnabled(!chart.getData().isHighlightEnabled()); + chart.invalidate(); + } + break; + } + case R.id.actionSave: { + if (ContextCompat.checkSelfPermission(this, Manifest.permission.WRITE_EXTERNAL_STORAGE) == PackageManager.PERMISSION_GRANTED) { + saveToGallery(); + } else { + requestStoragePermission(chart); + } + break; + } + case R.id.animateX: { + chart.animateX(2000); + break; + } + case R.id.animateY: { + chart.animateY(2000); + break; + } + case R.id.animateXY: { + chart.animateXY(2000, 2000); + break; + } + } + return true; + } + + @Override + protected void saveToGallery() { + saveToGallery(chart, "BarChartActivityMultiDataset"); + } + + @Override + public void onStartTrackingTouch(SeekBar seekBar) {} + + @Override + public void onStopTrackingTouch(SeekBar seekBar) {} + + @Override + public void onValueSelected(Entry e, Highlight h) { + Log.i("Activity", "Selected: " + e.toString() + ", dataSet: " + h.getDataSetIndex()); + } + + @Override + public void onNothingSelected() { + Log.i("Activity", "Nothing selected."); + } +} diff --git a/MPChartExample/src/main/java/com/xxmassdeveloper/mpchartexample/BarChartActivitySinus.java b/MPChartExample/src/main/java/com/xxmassdeveloper/mpchartexample/BarChartActivitySinus.java new file mode 100644 index 00000000..95443e82 --- /dev/null +++ b/MPChartExample/src/main/java/com/xxmassdeveloper/mpchartexample/BarChartActivitySinus.java @@ -0,0 +1,239 @@ + +package com.xxmassdeveloper.mpchartexample; + +import android.Manifest; +import android.content.Intent; +import android.content.pm.PackageManager; +import android.graphics.Color; +import android.net.Uri; +import android.os.Bundle; +import androidx.core.content.ContextCompat; +import android.view.Menu; +import android.view.MenuItem; +import android.view.WindowManager; +import android.widget.SeekBar; +import android.widget.SeekBar.OnSeekBarChangeListener; +import android.widget.TextView; + +import com.github.mikephil.charting.charts.BarChart; +import com.github.mikephil.charting.components.Legend; +import com.github.mikephil.charting.components.Legend.LegendForm; +import com.github.mikephil.charting.components.XAxis; +import com.github.mikephil.charting.components.YAxis; +import com.github.mikephil.charting.data.BarData; +import com.github.mikephil.charting.data.BarDataSet; +import com.github.mikephil.charting.data.BarEntry; +import com.github.mikephil.charting.interfaces.datasets.IBarDataSet; +import com.github.mikephil.charting.utils.FileUtils; +import com.xxmassdeveloper.mpchartexample.notimportant.DemoBase; + +import java.util.ArrayList; +import java.util.List; + +public class BarChartActivitySinus extends DemoBase implements OnSeekBarChangeListener { + + private BarChart chart; + private SeekBar seekBarX; + private TextView tvX; + + private List<BarEntry> data; + + @Override + protected void onCreate(Bundle savedInstanceState) { + super.onCreate(savedInstanceState); + getWindow().setFlags(WindowManager.LayoutParams.FLAG_FULLSCREEN, + WindowManager.LayoutParams.FLAG_FULLSCREEN); + setContentView(R.layout.activity_barchart_sinus); + + setTitle("BarChartActivitySinus"); + + data = FileUtils.loadBarEntriesFromAssets(getAssets(), "othersine.txt"); + + tvX = findViewById(R.id.tvValueCount); + + seekBarX = findViewById(R.id.seekbarValues); + + chart = findViewById(R.id.chart1); + + chart.setDrawBarShadow(false); + chart.setDrawValueAboveBar(true); + + chart.getDescription().setEnabled(false); + + // if more than 60 entries are displayed in the chart, no values will be + // drawn + chart.setMaxVisibleValueCount(60); + + // scaling can now only be done on x- and y-axis separately + chart.setPinchZoom(false); + + // draw shadows for each bar that show the maximum value + // chart.setDrawBarShadow(true); + + // chart.setDrawXLabels(false); + + chart.setDrawGridBackground(false); + // chart.setDrawYLabels(false); + + XAxis xAxis = chart.getXAxis(); + xAxis.setEnabled(false); + + YAxis leftAxis = chart.getAxisLeft(); + leftAxis.setTypeface(tfLight); + leftAxis.setLabelCount(6, false); + leftAxis.setAxisMinimum(-2.5f); + leftAxis.setAxisMaximum(2.5f); + leftAxis.setGranularityEnabled(true); + leftAxis.setGranularity(0.1f); + + YAxis rightAxis = chart.getAxisRight(); + rightAxis.setDrawGridLines(false); + rightAxis.setTypeface(tfLight); + rightAxis.setLabelCount(6, false); + rightAxis.setAxisMinimum(-2.5f); + rightAxis.setAxisMaximum(2.5f); + rightAxis.setGranularity(0.1f); + + seekBarX.setOnSeekBarChangeListener(this); + seekBarX.setProgress(150); // set data + + Legend l = chart.getLegend(); + l.setVerticalAlignment(Legend.LegendVerticalAlignment.BOTTOM); + l.setHorizontalAlignment(Legend.LegendHorizontalAlignment.LEFT); + l.setOrientation(Legend.LegendOrientation.HORIZONTAL); + l.setDrawInside(false); + l.setForm(LegendForm.SQUARE); + l.setFormSize(9f); + l.setTextSize(11f); + l.setXEntrySpace(4f); + + chart.animateXY(1500, 1500); + } + + private void setData(int count) { + + ArrayList<BarEntry> entries = new ArrayList<>(); + + for (int i = 0; i < count; i++) { + entries.add(data.get(i)); + } + + BarDataSet set; + + if (chart.getData() != null && + chart.getData().getDataSetCount() > 0) { + set = (BarDataSet) chart.getData().getDataSetByIndex(0); + set.setValues(entries); + chart.getData().notifyDataChanged(); + chart.notifyDataSetChanged(); + } else { + set = new BarDataSet(entries, "Sinus Function"); + set.setColor(Color.rgb(240, 120, 124)); + } + + BarData data = new BarData(set); + data.setValueTextSize(10f); + data.setValueTypeface(tfLight); + data.setDrawValues(false); + data.setBarWidth(0.8f); + + chart.setData(data); + } + + @Override + public boolean onCreateOptionsMenu(Menu menu) { + getMenuInflater().inflate(R.menu.bar, menu); + return true; + } + + @Override + public boolean onOptionsItemSelected(MenuItem item) { + + switch (item.getItemId()) { + case R.id.viewGithub: { + Intent i = new Intent(Intent.ACTION_VIEW); + i.setData(Uri.parse("https://github.com/PhilJay/MPAndroidChart/blob/master/MPChartExample/src/com/xxmassdeveloper/mpchartexample/BarChartActivitySinus.java")); + startActivity(i); + break; + } + case R.id.actionToggleValues: { + for (IBarDataSet set : chart.getData().getDataSets()) + set.setDrawValues(!set.isDrawValuesEnabled()); + + chart.invalidate(); + break; + } + case R.id.actionToggleHighlight: { + if (chart.getData() != null) { + chart.getData().setHighlightEnabled(!chart.getData().isHighlightEnabled()); + chart.invalidate(); + } + break; + } + case R.id.actionTogglePinch: { + if (chart.isPinchZoomEnabled()) + chart.setPinchZoom(false); + else + chart.setPinchZoom(true); + + chart.invalidate(); + break; + } + case R.id.actionToggleAutoScaleMinMax: { + chart.setAutoScaleMinMaxEnabled(!chart.isAutoScaleMinMaxEnabled()); + chart.notifyDataSetChanged(); + break; + } + case R.id.actionToggleBarBorders: { + for (IBarDataSet set : chart.getData().getDataSets()) + ((BarDataSet) set).setBarBorderWidth(set.getBarBorderWidth() == 1.f ? 0.f : 1.f); + + chart.invalidate(); + break; + } + case R.id.animateX: { + chart.animateX(2000); + break; + } + case R.id.animateY: { + chart.animateY(2000); + break; + } + case R.id.animateXY: { + + chart.animateXY(2000, 2000); + break; + } + case R.id.actionSave: { + if (ContextCompat.checkSelfPermission(this, Manifest.permission.WRITE_EXTERNAL_STORAGE) == PackageManager.PERMISSION_GRANTED) { + saveToGallery(); + } else { + requestStoragePermission(chart); + } + break; + } + } + return true; + } + + @Override + public void onProgressChanged(SeekBar seekBar, int progress, boolean fromUser) { + + tvX.setText(String.valueOf(seekBarX.getProgress())); + + setData(seekBarX.getProgress()); + chart.invalidate(); + } + + @Override + protected void saveToGallery() { + saveToGallery(chart, "BarChartActivitySinus"); + } + + @Override + public void onStartTrackingTouch(SeekBar seekBar) {} + + @Override + public void onStopTrackingTouch(SeekBar seekBar) {} + +} diff --git a/MPChartExample/src/main/java/com/xxmassdeveloper/mpchartexample/BarChartPositiveNegative.java b/MPChartExample/src/main/java/com/xxmassdeveloper/mpchartexample/BarChartPositiveNegative.java new file mode 100644 index 00000000..4fec7dd6 --- /dev/null +++ b/MPChartExample/src/main/java/com/xxmassdeveloper/mpchartexample/BarChartPositiveNegative.java @@ -0,0 +1,200 @@ + +package com.xxmassdeveloper.mpchartexample; + +import android.content.Intent; +import android.graphics.Color; +import android.net.Uri; +import android.os.Bundle; +import android.view.Menu; +import android.view.MenuItem; +import android.view.WindowManager; + +import com.github.mikephil.charting.charts.BarChart; +import com.github.mikephil.charting.components.AxisBase; +import com.github.mikephil.charting.components.XAxis; +import com.github.mikephil.charting.components.XAxis.XAxisPosition; +import com.github.mikephil.charting.components.YAxis; +import com.github.mikephil.charting.data.BarData; +import com.github.mikephil.charting.data.BarDataSet; +import com.github.mikephil.charting.data.BarEntry; +import com.github.mikephil.charting.data.Entry; +import com.github.mikephil.charting.formatter.IAxisValueFormatter; +import com.github.mikephil.charting.formatter.IValueFormatter; +import com.github.mikephil.charting.utils.ViewPortHandler; +import com.xxmassdeveloper.mpchartexample.notimportant.DemoBase; + +import java.text.DecimalFormat; +import java.util.ArrayList; +import java.util.List; + +public class BarChartPositiveNegative extends DemoBase { + + private BarChart chart; + + @Override + protected void onCreate(Bundle savedInstanceState) { + super.onCreate(savedInstanceState); + getWindow().setFlags(WindowManager.LayoutParams.FLAG_FULLSCREEN, + WindowManager.LayoutParams.FLAG_FULLSCREEN); + setContentView(R.layout.activity_barchart_noseekbar); + + setTitle("BarChartPositiveNegative"); + + chart = findViewById(R.id.chart1); + chart.setBackgroundColor(Color.WHITE); + chart.setExtraTopOffset(-30f); + chart.setExtraBottomOffset(10f); + chart.setExtraLeftOffset(70f); + chart.setExtraRightOffset(70f); + + chart.setDrawBarShadow(false); + chart.setDrawValueAboveBar(true); + + chart.getDescription().setEnabled(false); + + // scaling can now only be done on x- and y-axis separately + chart.setPinchZoom(false); + + chart.setDrawGridBackground(false); + + XAxis xAxis = chart.getXAxis(); + xAxis.setPosition(XAxisPosition.BOTTOM); + xAxis.setTypeface(tfRegular); + xAxis.setDrawGridLines(false); + xAxis.setDrawAxisLine(false); + xAxis.setTextColor(Color.LTGRAY); + xAxis.setTextSize(13f); + xAxis.setLabelCount(5); + xAxis.setCenterAxisLabels(true); + xAxis.setGranularity(1f); + + YAxis left = chart.getAxisLeft(); + left.setDrawLabels(false); + left.setSpaceTop(25f); + left.setSpaceBottom(25f); + left.setDrawAxisLine(false); + left.setDrawGridLines(false); + left.setDrawZeroLine(true); // draw a zero line + left.setZeroLineColor(Color.GRAY); + left.setZeroLineWidth(0.7f); + chart.getAxisRight().setEnabled(false); + chart.getLegend().setEnabled(false); + + // THIS IS THE ORIGINAL DATA YOU WANT TO PLOT + final List<Data> data = new ArrayList<>(); + data.add(new Data(0f, -224.1f, "12-29")); + data.add(new Data(1f, 238.5f, "12-30")); + data.add(new Data(2f, 1280.1f, "12-31")); + data.add(new Data(3f, -442.3f, "01-01")); + data.add(new Data(4f, -2280.1f, "01-02")); + + xAxis.setValueFormatter(new IAxisValueFormatter() { + @Override + public String getFormattedValue(float value, AxisBase axis) { + return data.get(Math.min(Math.max((int) value, 0), data.size()-1)).xAxisValue; + } + }); + + setData(data); + } + + private void setData(List<Data> dataList) { + + ArrayList<BarEntry> values = new ArrayList<>(); + List<Integer> colors = new ArrayList<>(); + + int green = Color.rgb(110, 190, 102); + int red = Color.rgb(211, 74, 88); + + for (int i = 0; i < dataList.size(); i++) { + + Data d = dataList.get(i); + BarEntry entry = new BarEntry(d.xValue, d.yValue); + values.add(entry); + + // specific colors + if (d.yValue >= 0) + colors.add(red); + else + colors.add(green); + } + + BarDataSet set; + + if (chart.getData() != null && + chart.getData().getDataSetCount() > 0) { + set = (BarDataSet) chart.getData().getDataSetByIndex(0); + set.setValues(values); + chart.getData().notifyDataChanged(); + chart.notifyDataSetChanged(); + } else { + set = new BarDataSet(values, "Values"); + set.setColors(colors); + set.setValueTextColors(colors); + + BarData data = new BarData(set); + data.setValueTextSize(13f); + data.setValueTypeface(tfRegular); + data.setValueFormatter(new ValueFormatter()); + data.setBarWidth(0.8f); + + chart.setData(data); + chart.invalidate(); + } + } + + /** + * Demo class representing data. + */ + private class Data { + + final String xAxisValue; + final float yValue; + final float xValue; + + Data(float xValue, float yValue, String xAxisValue) { + this.xAxisValue = xAxisValue; + this.yValue = yValue; + this.xValue = xValue; + } + } + + private class ValueFormatter implements IValueFormatter + { + + private final DecimalFormat mFormat; + + ValueFormatter() { + mFormat = new DecimalFormat("######.0"); + } + + @Override + public String getFormattedValue(float value, Entry entry, int dataSetIndex, ViewPortHandler viewPortHandler) { + return mFormat.format(value); + } + } + + @Override + public boolean onCreateOptionsMenu(Menu menu) { + getMenuInflater().inflate(R.menu.only_github, menu); + return true; + } + + @Override + public boolean onOptionsItemSelected(MenuItem item) { + + switch (item.getItemId()) { + case R.id.viewGithub: { + Intent i = new Intent(Intent.ACTION_VIEW); + i.setData(Uri.parse("https://github.com/PhilJay/MPAndroidChart/blob/master/MPChartExample/src/com/xxmassdeveloper/mpchartexample/BarChartPositiveNegative.java")); + startActivity(i); + break; + } + } + + return true; + } + + @Override + public void saveToGallery() { /* Intentionally left empty */ } +} diff --git a/MPChartExample/src/main/java/com/xxmassdeveloper/mpchartexample/BubbleChartActivity.java b/MPChartExample/src/main/java/com/xxmassdeveloper/mpchartexample/BubbleChartActivity.java new file mode 100644 index 00000000..6288dda2 --- /dev/null +++ b/MPChartExample/src/main/java/com/xxmassdeveloper/mpchartexample/BubbleChartActivity.java @@ -0,0 +1,248 @@ + +package com.xxmassdeveloper.mpchartexample; + +import android.Manifest; +import android.content.Intent; +import android.content.pm.PackageManager; +import android.graphics.Color; +import android.net.Uri; +import android.os.Bundle; +import androidx.core.content.ContextCompat; +import android.util.Log; +import android.view.Menu; +import android.view.MenuItem; +import android.view.WindowManager; +import android.widget.SeekBar; +import android.widget.SeekBar.OnSeekBarChangeListener; +import android.widget.TextView; + +import com.github.mikephil.charting.charts.BubbleChart; +import com.github.mikephil.charting.components.Legend; +import com.github.mikephil.charting.components.XAxis; +import com.github.mikephil.charting.components.YAxis; +import com.github.mikephil.charting.data.BubbleData; +import com.github.mikephil.charting.data.BubbleDataSet; +import com.github.mikephil.charting.data.BubbleEntry; +import com.github.mikephil.charting.data.Entry; +import com.github.mikephil.charting.highlight.Highlight; +import com.github.mikephil.charting.interfaces.datasets.IBubbleDataSet; +import com.github.mikephil.charting.interfaces.datasets.IDataSet; +import com.github.mikephil.charting.listener.OnChartValueSelectedListener; +import com.github.mikephil.charting.utils.ColorTemplate; +import com.github.mikephil.charting.utils.MPPointF; +import com.xxmassdeveloper.mpchartexample.notimportant.DemoBase; + +import java.util.ArrayList; + +public class BubbleChartActivity extends DemoBase implements OnSeekBarChangeListener, + OnChartValueSelectedListener { + + private BubbleChart chart; + private SeekBar seekBarX, seekBarY; + private TextView tvX, tvY; + + @Override + protected void onCreate(Bundle savedInstanceState) { + super.onCreate(savedInstanceState); + getWindow().setFlags(WindowManager.LayoutParams.FLAG_FULLSCREEN, + WindowManager.LayoutParams.FLAG_FULLSCREEN); + setContentView(R.layout.activity_bubblechart); + + setTitle("BubbleChartActivity"); + + tvX = findViewById(R.id.tvXMax); + tvY = findViewById(R.id.tvYMax); + + seekBarX = findViewById(R.id.seekBar1); + seekBarX.setOnSeekBarChangeListener(this); + + seekBarY = findViewById(R.id.seekBar2); + seekBarY.setOnSeekBarChangeListener(this); + + chart = findViewById(R.id.chart1); + chart.getDescription().setEnabled(false); + + chart.setOnChartValueSelectedListener(this); + + chart.setDrawGridBackground(false); + + chart.setTouchEnabled(true); + + // enable scaling and dragging + chart.setDragEnabled(true); + chart.setScaleEnabled(true); + + chart.setMaxVisibleValueCount(200); + chart.setPinchZoom(true); + + seekBarX.setProgress(10); + seekBarY.setProgress(50); + + Legend l = chart.getLegend(); + l.setVerticalAlignment(Legend.LegendVerticalAlignment.TOP); + l.setHorizontalAlignment(Legend.LegendHorizontalAlignment.RIGHT); + l.setOrientation(Legend.LegendOrientation.VERTICAL); + l.setDrawInside(false); + l.setTypeface(tfLight); + + YAxis yl = chart.getAxisLeft(); + yl.setTypeface(tfLight); + yl.setSpaceTop(30f); + yl.setSpaceBottom(30f); + yl.setDrawZeroLine(false); + + chart.getAxisRight().setEnabled(false); + + XAxis xl = chart.getXAxis(); + xl.setPosition(XAxis.XAxisPosition.BOTTOM); + xl.setTypeface(tfLight); + } + + @Override + public void onProgressChanged(SeekBar seekBar, int progress, boolean fromUser) { + + int count = seekBarX.getProgress(); + int range = seekBarY.getProgress(); + + tvX.setText(String.valueOf(count)); + tvY.setText(String.valueOf(range)); + + ArrayList<BubbleEntry> values1 = new ArrayList<>(); + ArrayList<BubbleEntry> values2 = new ArrayList<>(); + ArrayList<BubbleEntry> values3 = new ArrayList<>(); + + for (int i = 0; i < count; i++) { + values1.add(new BubbleEntry(i, (float) (Math.random() * range), (float) (Math.random() * range), getResources().getDrawable(R.drawable.star))); + values2.add(new BubbleEntry(i, (float) (Math.random() * range), (float) (Math.random() * range), getResources().getDrawable(R.drawable.star))); + values3.add(new BubbleEntry(i, (float) (Math.random() * range), (float) (Math.random() * range))); + } + + // create a dataset and give it a type + BubbleDataSet set1 = new BubbleDataSet(values1, "DS 1"); + set1.setDrawIcons(false); + set1.setColor(ColorTemplate.COLORFUL_COLORS[0], 130); + set1.setDrawValues(true); + + BubbleDataSet set2 = new BubbleDataSet(values2, "DS 2"); + set2.setDrawIcons(false); + set2.setIconsOffset(new MPPointF(0, 15)); + set2.setColor(ColorTemplate.COLORFUL_COLORS[1], 130); + set2.setDrawValues(true); + + BubbleDataSet set3 = new BubbleDataSet(values3, "DS 3"); + set3.setColor(ColorTemplate.COLORFUL_COLORS[2], 130); + set3.setDrawValues(true); + + ArrayList<IBubbleDataSet> dataSets = new ArrayList<>(); + dataSets.add(set1); // add the data sets + dataSets.add(set2); + dataSets.add(set3); + + // create a data object with the data sets + BubbleData data = new BubbleData(dataSets); + data.setDrawValues(false); + data.setValueTypeface(tfLight); + data.setValueTextSize(8f); + data.setValueTextColor(Color.WHITE); + data.setHighlightCircleWidth(1.5f); + + chart.setData(data); + chart.invalidate(); + } + + @Override + public boolean onCreateOptionsMenu(Menu menu) { + getMenuInflater().inflate(R.menu.bubble, menu); + return true; + } + + @Override + public boolean onOptionsItemSelected(MenuItem item) { + + switch (item.getItemId()) { + case R.id.viewGithub: { + Intent i = new Intent(Intent.ACTION_VIEW); + i.setData(Uri.parse("https://github.com/PhilJay/MPAndroidChart/blob/master/MPChartExample/src/com/xxmassdeveloper/mpchartexample/BubbleChartActivity.java")); + startActivity(i); + break; + } + case R.id.actionToggleValues: { + for (IDataSet set : chart.getData().getDataSets()) + set.setDrawValues(!set.isDrawValuesEnabled()); + + chart.invalidate(); + break; + } + case R.id.actionToggleIcons: { + for (IDataSet set : chart.getData().getDataSets()) + set.setDrawIcons(!set.isDrawIconsEnabled()); + + chart.invalidate(); + break; + } + case R.id.actionToggleHighlight: { + if(chart.getData() != null) { + chart.getData().setHighlightEnabled(!chart.getData().isHighlightEnabled()); + chart.invalidate(); + } + break; + } + case R.id.actionTogglePinch: { + if (chart.isPinchZoomEnabled()) + chart.setPinchZoom(false); + else + chart.setPinchZoom(true); + + chart.invalidate(); + break; + } + case R.id.actionToggleAutoScaleMinMax: { + chart.setAutoScaleMinMaxEnabled(!chart.isAutoScaleMinMaxEnabled()); + chart.notifyDataSetChanged(); + break; + } + case R.id.actionSave: { + if (ContextCompat.checkSelfPermission(this, Manifest.permission.WRITE_EXTERNAL_STORAGE) == PackageManager.PERMISSION_GRANTED) { + saveToGallery(); + } else { + requestStoragePermission(chart); + } + break; + } + case R.id.animateX: { + chart.animateX(2000); + break; + } + case R.id.animateY: { + chart.animateY(2000); + break; + } + case R.id.animateXY: { + chart.animateXY(2000, 2000); + break; + } + } + return true; + } + + @Override + protected void saveToGallery() { + saveToGallery(chart, "BubbleChartActivity"); + } + + @Override + public void onValueSelected(Entry e, Highlight h) { + Log.i("VAL SELECTED", + "Value: " + e.getY() + ", xIndex: " + e.getX() + + ", DataSet index: " + h.getDataSetIndex()); + } + + @Override + public void onNothingSelected() {} + + @Override + public void onStartTrackingTouch(SeekBar seekBar) {} + + @Override + public void onStopTrackingTouch(SeekBar seekBar) {} +} diff --git a/MPChartExample/src/main/java/com/xxmassdeveloper/mpchartexample/CandleStickChartActivity.java b/MPChartExample/src/main/java/com/xxmassdeveloper/mpchartexample/CandleStickChartActivity.java new file mode 100644 index 00000000..ecf7167a --- /dev/null +++ b/MPChartExample/src/main/java/com/xxmassdeveloper/mpchartexample/CandleStickChartActivity.java @@ -0,0 +1,238 @@ + +package com.xxmassdeveloper.mpchartexample; + +import android.Manifest; +import android.content.Intent; +import android.content.pm.PackageManager; +import android.graphics.Color; +import android.graphics.Paint; +import android.net.Uri; +import android.os.Bundle; +import androidx.core.content.ContextCompat; +import android.view.Menu; +import android.view.MenuItem; +import android.view.WindowManager; +import android.widget.SeekBar; +import android.widget.SeekBar.OnSeekBarChangeListener; +import android.widget.TextView; + +import com.github.mikephil.charting.charts.CandleStickChart; +import com.github.mikephil.charting.components.XAxis; +import com.github.mikephil.charting.components.XAxis.XAxisPosition; +import com.github.mikephil.charting.components.YAxis; +import com.github.mikephil.charting.components.YAxis.AxisDependency; +import com.github.mikephil.charting.data.CandleData; +import com.github.mikephil.charting.data.CandleDataSet; +import com.github.mikephil.charting.data.CandleEntry; +import com.github.mikephil.charting.interfaces.datasets.ICandleDataSet; +import com.github.mikephil.charting.interfaces.datasets.IDataSet; +import com.xxmassdeveloper.mpchartexample.notimportant.DemoBase; + +import java.util.ArrayList; + +public class CandleStickChartActivity extends DemoBase implements OnSeekBarChangeListener { + + private CandleStickChart chart; + private SeekBar seekBarX, seekBarY; + private TextView tvX, tvY; + + @Override + protected void onCreate(Bundle savedInstanceState) { + super.onCreate(savedInstanceState); + getWindow().setFlags(WindowManager.LayoutParams.FLAG_FULLSCREEN, + WindowManager.LayoutParams.FLAG_FULLSCREEN); + setContentView(R.layout.activity_candlechart); + + setTitle("CandleStickChartActivity"); + + tvX = findViewById(R.id.tvXMax); + tvY = findViewById(R.id.tvYMax); + + seekBarX = findViewById(R.id.seekBar1); + seekBarX.setOnSeekBarChangeListener(this); + + seekBarY = findViewById(R.id.seekBar2); + seekBarY.setOnSeekBarChangeListener(this); + + chart = findViewById(R.id.chart1); + chart.setBackgroundColor(Color.WHITE); + + chart.getDescription().setEnabled(false); + + // if more than 60 entries are displayed in the chart, no values will be + // drawn + chart.setMaxVisibleValueCount(60); + + // scaling can now only be done on x- and y-axis separately + chart.setPinchZoom(false); + + chart.setDrawGridBackground(false); + + XAxis xAxis = chart.getXAxis(); + xAxis.setPosition(XAxisPosition.BOTTOM); + xAxis.setDrawGridLines(false); + + YAxis leftAxis = chart.getAxisLeft(); +// leftAxis.setEnabled(false); + leftAxis.setLabelCount(7, false); + leftAxis.setDrawGridLines(false); + leftAxis.setDrawAxisLine(false); + + YAxis rightAxis = chart.getAxisRight(); + rightAxis.setEnabled(false); +// rightAxis.setStartAtZero(false); + + // setting data + seekBarX.setProgress(40); + seekBarY.setProgress(100); + + chart.getLegend().setEnabled(false); + } + + @Override + public void onProgressChanged(SeekBar seekBar, int progress, boolean fromUser) { + + progress = (seekBarX.getProgress()); + + tvX.setText(String.valueOf(progress)); + tvY.setText(String.valueOf(seekBarY.getProgress())); + + chart.resetTracking(); + + ArrayList<CandleEntry> values = new ArrayList<>(); + + for (int i = 0; i < progress; i++) { + float multi = (seekBarY.getProgress() + 1); + float val = (float) (Math.random() * 40) + multi; + + float high = (float) (Math.random() * 9) + 8f; + float low = (float) (Math.random() * 9) + 8f; + + float open = (float) (Math.random() * 6) + 1f; + float close = (float) (Math.random() * 6) + 1f; + + boolean even = i % 2 == 0; + + values.add(new CandleEntry( + i, val + high, + val - low, + even ? val + open : val - open, + even ? val - close : val + close, + getResources().getDrawable(R.drawable.star) + )); + } + + CandleDataSet set1 = new CandleDataSet(values, "Data Set"); + + set1.setDrawIcons(false); + set1.setAxisDependency(AxisDependency.LEFT); +// set1.setColor(Color.rgb(80, 80, 80)); + set1.setShadowColor(Color.DKGRAY); + set1.setShadowWidth(0.7f); + set1.setDecreasingColor(Color.RED); + set1.setDecreasingPaintStyle(Paint.Style.FILL); + set1.setIncreasingColor(Color.rgb(122, 242, 84)); + set1.setIncreasingPaintStyle(Paint.Style.STROKE); + set1.setNeutralColor(Color.BLUE); + //set1.setHighlightLineWidth(1f); + + CandleData data = new CandleData(set1); + + chart.setData(data); + chart.invalidate(); + } + + @Override + public boolean onCreateOptionsMenu(Menu menu) { + getMenuInflater().inflate(R.menu.candle, menu); + return true; + } + + @Override + public boolean onOptionsItemSelected(MenuItem item) { + + switch (item.getItemId()) { + case R.id.viewGithub: { + Intent i = new Intent(Intent.ACTION_VIEW); + i.setData(Uri.parse("https://github.com/PhilJay/MPAndroidChart/blob/master/MPChartExample/src/com/xxmassdeveloper/mpchartexample/CandleStickChartActivity.java")); + startActivity(i); + break; + } + case R.id.actionToggleValues: { + for (IDataSet set : chart.getData().getDataSets()) + set.setDrawValues(!set.isDrawValuesEnabled()); + + chart.invalidate(); + break; + } + case R.id.actionToggleIcons: { + for (IDataSet set : chart.getData().getDataSets()) + set.setDrawIcons(!set.isDrawIconsEnabled()); + + chart.invalidate(); + break; + } + case R.id.actionToggleHighlight: { + if(chart.getData() != null) { + chart.getData().setHighlightEnabled(!chart.getData().isHighlightEnabled()); + chart.invalidate(); + } + break; + } + case R.id.actionTogglePinch: { + if (chart.isPinchZoomEnabled()) + chart.setPinchZoom(false); + else + chart.setPinchZoom(true); + + chart.invalidate(); + break; + } + case R.id.actionToggleAutoScaleMinMax: { + chart.setAutoScaleMinMaxEnabled(!chart.isAutoScaleMinMaxEnabled()); + chart.notifyDataSetChanged(); + break; + } + case R.id.actionToggleMakeShadowSameColorAsCandle: { + for (ICandleDataSet set : chart.getData().getDataSets()) { + ((CandleDataSet) set).setShadowColorSameAsCandle(!set.getShadowColorSameAsCandle()); + } + + chart.invalidate(); + break; + } + case R.id.animateX: { + chart.animateX(2000); + break; + } + case R.id.animateY: { + chart.animateY(2000); + break; + } + case R.id.animateXY: { + chart.animateXY(2000, 2000); + break; + } + case R.id.actionSave: { + if (ContextCompat.checkSelfPermission(this, Manifest.permission.WRITE_EXTERNAL_STORAGE) == PackageManager.PERMISSION_GRANTED) { + saveToGallery(); + } else { + requestStoragePermission(chart); + } + break; + } + } + return true; + } + + @Override + protected void saveToGallery() { + saveToGallery(chart, "CandleStickChartActivity"); + } + + @Override + public void onStartTrackingTouch(SeekBar seekBar) {} + + @Override + public void onStopTrackingTouch(SeekBar seekBar) {} +} diff --git a/MPChartExample/src/main/java/com/xxmassdeveloper/mpchartexample/CombinedChartActivity.java b/MPChartExample/src/main/java/com/xxmassdeveloper/mpchartexample/CombinedChartActivity.java new file mode 100644 index 00000000..0308b9a8 --- /dev/null +++ b/MPChartExample/src/main/java/com/xxmassdeveloper/mpchartexample/CombinedChartActivity.java @@ -0,0 +1,282 @@ + +package com.xxmassdeveloper.mpchartexample; + +import android.content.Intent; +import android.graphics.Color; +import android.net.Uri; +import android.os.Bundle; +import android.view.Menu; +import android.view.MenuItem; +import android.view.WindowManager; + +import com.github.mikephil.charting.charts.CombinedChart; +import com.github.mikephil.charting.charts.CombinedChart.DrawOrder; +import com.github.mikephil.charting.components.AxisBase; +import com.github.mikephil.charting.components.Legend; +import com.github.mikephil.charting.components.XAxis; +import com.github.mikephil.charting.components.XAxis.XAxisPosition; +import com.github.mikephil.charting.components.YAxis; +import com.github.mikephil.charting.data.BarData; +import com.github.mikephil.charting.data.BarDataSet; +import com.github.mikephil.charting.data.BarEntry; +import com.github.mikephil.charting.data.BubbleData; +import com.github.mikephil.charting.data.BubbleDataSet; +import com.github.mikephil.charting.data.BubbleEntry; +import com.github.mikephil.charting.data.CandleData; +import com.github.mikephil.charting.data.CandleDataSet; +import com.github.mikephil.charting.data.CandleEntry; +import com.github.mikephil.charting.data.CombinedData; +import com.github.mikephil.charting.data.Entry; +import com.github.mikephil.charting.data.LineData; +import com.github.mikephil.charting.data.LineDataSet; +import com.github.mikephil.charting.data.ScatterData; +import com.github.mikephil.charting.data.ScatterDataSet; +import com.github.mikephil.charting.formatter.IAxisValueFormatter; +import com.github.mikephil.charting.interfaces.datasets.IDataSet; +import com.github.mikephil.charting.utils.ColorTemplate; +import com.xxmassdeveloper.mpchartexample.notimportant.DemoBase; + +import java.util.ArrayList; + +public class CombinedChartActivity extends DemoBase { + + private CombinedChart chart; + private final int count = 12; + + @Override + protected void onCreate(Bundle savedInstanceState) { + super.onCreate(savedInstanceState); + getWindow().setFlags(WindowManager.LayoutParams.FLAG_FULLSCREEN, + WindowManager.LayoutParams.FLAG_FULLSCREEN); + setContentView(R.layout.activity_combined); + + setTitle("CombinedChartActivity"); + + chart = findViewById(R.id.chart1); + chart.getDescription().setEnabled(false); + chart.setBackgroundColor(Color.WHITE); + chart.setDrawGridBackground(false); + chart.setDrawBarShadow(false); + chart.setHighlightFullBarEnabled(false); + + // draw bars behind lines + chart.setDrawOrder(new DrawOrder[]{ + DrawOrder.BAR, DrawOrder.BUBBLE, DrawOrder.CANDLE, DrawOrder.LINE, DrawOrder.SCATTER + }); + + Legend l = chart.getLegend(); + l.setWordWrapEnabled(true); + l.setVerticalAlignment(Legend.LegendVerticalAlignment.BOTTOM); + l.setHorizontalAlignment(Legend.LegendHorizontalAlignment.CENTER); + l.setOrientation(Legend.LegendOrientation.HORIZONTAL); + l.setDrawInside(false); + + YAxis rightAxis = chart.getAxisRight(); + rightAxis.setDrawGridLines(false); + rightAxis.setAxisMinimum(0f); // this replaces setStartAtZero(true) + + YAxis leftAxis = chart.getAxisLeft(); + leftAxis.setDrawGridLines(false); + leftAxis.setAxisMinimum(0f); // this replaces setStartAtZero(true) + + XAxis xAxis = chart.getXAxis(); + xAxis.setPosition(XAxisPosition.BOTH_SIDED); + xAxis.setAxisMinimum(0f); + xAxis.setGranularity(1f); + xAxis.setValueFormatter(new IAxisValueFormatter() { + @Override + public String getFormattedValue(float value, AxisBase axis) { + return months[(int) value % months.length]; + } + }); + + CombinedData data = new CombinedData(); + + data.setData(generateLineData()); + data.setData(generateBarData()); + data.setData(generateBubbleData()); + data.setData(generateScatterData()); + data.setData(generateCandleData()); + data.setValueTypeface(tfLight); + + xAxis.setAxisMaximum(data.getXMax() + 0.25f); + + chart.setData(data); + chart.invalidate(); + } + + private LineData generateLineData() { + + LineData d = new LineData(); + + ArrayList<Entry> entries = new ArrayList<>(); + + for (int index = 0; index < count; index++) + entries.add(new Entry(index + 0.5f, getRandom(15, 5))); + + LineDataSet set = new LineDataSet(entries, "Line DataSet"); + set.setColor(Color.rgb(240, 238, 70)); + set.setLineWidth(2.5f); + set.setCircleColor(Color.rgb(240, 238, 70)); + set.setCircleRadius(5f); + set.setFillColor(Color.rgb(240, 238, 70)); + set.setMode(LineDataSet.Mode.CUBIC_BEZIER); + set.setDrawValues(true); + set.setValueTextSize(10f); + set.setValueTextColor(Color.rgb(240, 238, 70)); + + set.setAxisDependency(YAxis.AxisDependency.LEFT); + d.addDataSet(set); + + return d; + } + + private BarData generateBarData() { + + ArrayList<BarEntry> entries1 = new ArrayList<>(); + ArrayList<BarEntry> entries2 = new ArrayList<>(); + + for (int index = 0; index < count; index++) { + entries1.add(new BarEntry(0, getRandom(25, 25))); + + // stacked + entries2.add(new BarEntry(0, new float[]{getRandom(13, 12), getRandom(13, 12)})); + } + + BarDataSet set1 = new BarDataSet(entries1, "Bar 1"); + set1.setColor(Color.rgb(60, 220, 78)); + set1.setValueTextColor(Color.rgb(60, 220, 78)); + set1.setValueTextSize(10f); + set1.setAxisDependency(YAxis.AxisDependency.LEFT); + + BarDataSet set2 = new BarDataSet(entries2, ""); + set2.setStackLabels(new String[]{"Stack 1", "Stack 2"}); + set2.setColors(Color.rgb(61, 165, 255), Color.rgb(23, 197, 255)); + set2.setValueTextColor(Color.rgb(61, 165, 255)); + set2.setValueTextSize(10f); + set2.setAxisDependency(YAxis.AxisDependency.LEFT); + + float groupSpace = 0.06f; + float barSpace = 0.02f; // x2 dataset + float barWidth = 0.45f; // x2 dataset + // (0.45 + 0.02) * 2 + 0.06 = 1.00 -> interval per "group" + + BarData d = new BarData(set1, set2); + d.setBarWidth(barWidth); + + // make this BarData object grouped + d.groupBars(0, groupSpace, barSpace); // start at x = 0 + + return d; + } + + private ScatterData generateScatterData() { + + ScatterData d = new ScatterData(); + + ArrayList<Entry> entries = new ArrayList<>(); + + for (float index = 0; index < count; index += 0.5f) + entries.add(new Entry(index + 0.25f, getRandom(10, 55))); + + ScatterDataSet set = new ScatterDataSet(entries, "Scatter DataSet"); + set.setColors(ColorTemplate.MATERIAL_COLORS); + set.setScatterShapeSize(7.5f); + set.setDrawValues(false); + set.setValueTextSize(10f); + d.addDataSet(set); + + return d; + } + + private CandleData generateCandleData() { + + CandleData d = new CandleData(); + + ArrayList<CandleEntry> entries = new ArrayList<>(); + + for (int index = 0; index < count; index += 2) + entries.add(new CandleEntry(index + 1f, 90, 70, 85, 75f)); + + CandleDataSet set = new CandleDataSet(entries, "Candle DataSet"); + set.setDecreasingColor(Color.rgb(142, 150, 175)); + set.setShadowColor(Color.DKGRAY); + set.setBarSpace(0.3f); + set.setValueTextSize(10f); + set.setDrawValues(false); + d.addDataSet(set); + + return d; + } + + private BubbleData generateBubbleData() { + + BubbleData bd = new BubbleData(); + + ArrayList<BubbleEntry> entries = new ArrayList<>(); + + for (int index = 0; index < count; index++) { + float y = getRandom(10, 105); + float size = getRandom(100, 105); + entries.add(new BubbleEntry(index + 0.5f, y, size)); + } + + BubbleDataSet set = new BubbleDataSet(entries, "Bubble DataSet"); + set.setColors(ColorTemplate.VORDIPLOM_COLORS); + set.setValueTextSize(10f); + set.setValueTextColor(Color.WHITE); + set.setHighlightCircleWidth(1.5f); + set.setDrawValues(true); + bd.addDataSet(set); + + return bd; + } + + @Override + public boolean onCreateOptionsMenu(Menu menu) { + getMenuInflater().inflate(R.menu.combined, menu); + return true; + } + + @Override + public boolean onOptionsItemSelected(MenuItem item) { + switch (item.getItemId()) { + case R.id.viewGithub: { + Intent i = new Intent(Intent.ACTION_VIEW); + i.setData(Uri.parse("https://github.com/PhilJay/MPAndroidChart/blob/master/MPChartExample/src/com/xxmassdeveloper/mpchartexample/CombinedChartActivity.java")); + startActivity(i); + break; + } + case R.id.actionToggleLineValues: { + for (IDataSet set : chart.getData().getDataSets()) { + if (set instanceof LineDataSet) + set.setDrawValues(!set.isDrawValuesEnabled()); + } + + chart.invalidate(); + break; + } + case R.id.actionToggleBarValues: { + for (IDataSet set : chart.getData().getDataSets()) { + if (set instanceof BarDataSet) + set.setDrawValues(!set.isDrawValuesEnabled()); + } + + chart.invalidate(); + break; + } + case R.id.actionRemoveDataSet: { + int rnd = (int) getRandom(chart.getData().getDataSetCount(), 0); + chart.getData().removeDataSet(chart.getData().getDataSetByIndex(rnd)); + chart.getData().notifyDataChanged(); + chart.notifyDataSetChanged(); + chart.invalidate(); + break; + } + } + return true; + } + + @Override + public void saveToGallery() { /* Intentionally left empty */ } +} diff --git a/MPChartExample/src/main/java/com/xxmassdeveloper/mpchartexample/CubicLineChartActivity.java b/MPChartExample/src/main/java/com/xxmassdeveloper/mpchartexample/CubicLineChartActivity.java new file mode 100644 index 00000000..996e088f --- /dev/null +++ b/MPChartExample/src/main/java/com/xxmassdeveloper/mpchartexample/CubicLineChartActivity.java @@ -0,0 +1,320 @@ + +package com.xxmassdeveloper.mpchartexample; + +import android.Manifest; +import android.content.Intent; +import android.content.pm.PackageManager; +import android.graphics.Color; +import android.net.Uri; +import android.os.Bundle; +import androidx.core.content.ContextCompat; +import android.view.Menu; +import android.view.MenuItem; +import android.view.WindowManager; +import android.widget.SeekBar; +import android.widget.SeekBar.OnSeekBarChangeListener; +import android.widget.TextView; + +import com.github.mikephil.charting.charts.LineChart; +import com.github.mikephil.charting.components.XAxis; +import com.github.mikephil.charting.components.YAxis; +import com.github.mikephil.charting.data.Entry; +import com.github.mikephil.charting.data.LineData; +import com.github.mikephil.charting.data.LineDataSet; +import com.github.mikephil.charting.formatter.IFillFormatter; +import com.github.mikephil.charting.interfaces.dataprovider.LineDataProvider; +import com.github.mikephil.charting.interfaces.datasets.IDataSet; +import com.github.mikephil.charting.interfaces.datasets.ILineDataSet; +import com.xxmassdeveloper.mpchartexample.notimportant.DemoBase; + +import java.util.ArrayList; +import java.util.List; + +public class CubicLineChartActivity extends DemoBase implements OnSeekBarChangeListener { + + private LineChart chart; + private SeekBar seekBarX, seekBarY; + private TextView tvX, tvY; + + @Override + protected void onCreate(Bundle savedInstanceState) { + super.onCreate(savedInstanceState); + getWindow().setFlags(WindowManager.LayoutParams.FLAG_FULLSCREEN, + WindowManager.LayoutParams.FLAG_FULLSCREEN); + setContentView(R.layout.activity_linechart); + + setTitle("CubicLineChartActivity"); + + tvX = findViewById(R.id.tvXMax); + tvY = findViewById(R.id.tvYMax); + + seekBarX = findViewById(R.id.seekBar1); + seekBarY = findViewById(R.id.seekBar2); + + chart = findViewById(R.id.chart1); + chart.setViewPortOffsets(0, 0, 0, 0); + chart.setBackgroundColor(Color.rgb(104, 241, 175)); + + // no description text + chart.getDescription().setEnabled(false); + + // enable touch gestures + chart.setTouchEnabled(true); + + // enable scaling and dragging + chart.setDragEnabled(true); + chart.setScaleEnabled(true); + + // if disabled, scaling can be done on x- and y-axis separately + chart.setPinchZoom(false); + + chart.setDrawGridBackground(false); + chart.setMaxHighlightDistance(300); + + XAxis x = chart.getXAxis(); + x.setEnabled(false); + + YAxis y = chart.getAxisLeft(); + y.setTypeface(tfLight); + y.setLabelCount(6, false); + y.setTextColor(Color.WHITE); + y.setPosition(YAxis.YAxisLabelPosition.INSIDE_CHART); + y.setDrawGridLines(false); + y.setAxisLineColor(Color.WHITE); + + chart.getAxisRight().setEnabled(false); + + // add data + seekBarY.setOnSeekBarChangeListener(this); + seekBarX.setOnSeekBarChangeListener(this); + + // lower max, as cubic runs significantly slower than linear + seekBarX.setMax(700); + + seekBarX.setProgress(45); + seekBarY.setProgress(100); + + chart.getLegend().setEnabled(false); + + chart.animateXY(2000, 2000); + + // don't forget to refresh the drawing + chart.invalidate(); + } + + private void setData(int count, float range) { + + ArrayList<Entry> values = new ArrayList<>(); + + for (int i = 0; i < count; i++) { + float val = (float) (Math.random() * (range + 1)) + 20; + values.add(new Entry(i, val)); + } + + LineDataSet set1; + + if (chart.getData() != null && + chart.getData().getDataSetCount() > 0) { + set1 = (LineDataSet) chart.getData().getDataSetByIndex(0); + set1.setValues(values); + chart.getData().notifyDataChanged(); + chart.notifyDataSetChanged(); + } else { + // create a dataset and give it a type + set1 = new LineDataSet(values, "DataSet 1"); + + set1.setMode(LineDataSet.Mode.CUBIC_BEZIER); + set1.setCubicIntensity(0.2f); + set1.setDrawFilled(true); + set1.setDrawCircles(false); + set1.setLineWidth(1.8f); + set1.setCircleRadius(4f); + set1.setCircleColor(Color.WHITE); + set1.setHighLightColor(Color.rgb(244, 117, 117)); + set1.setColor(Color.WHITE); + set1.setFillColor(Color.WHITE); + set1.setFillAlpha(100); + set1.setDrawHorizontalHighlightIndicator(false); + set1.setFillFormatter(new IFillFormatter() { + @Override + public float getFillLinePosition(ILineDataSet dataSet, LineDataProvider dataProvider) { + return chart.getAxisLeft().getAxisMinimum(); + } + }); + + // create a data object with the data sets + LineData data = new LineData(set1); + data.setValueTypeface(tfLight); + data.setValueTextSize(9f); + data.setDrawValues(false); + + // set data + chart.setData(data); + } + } + + @Override + public boolean onCreateOptionsMenu(Menu menu) { + getMenuInflater().inflate(R.menu.line, menu); + return true; + } + + @Override + public boolean onOptionsItemSelected(MenuItem item) { + + switch (item.getItemId()) { + case R.id.viewGithub: { + Intent i = new Intent(Intent.ACTION_VIEW); + i.setData(Uri.parse("https://github.com/PhilJay/MPAndroidChart/blob/master/MPChartExample/src/com/xxmassdeveloper/mpchartexample/CubicLineChartActivity.java")); + startActivity(i); + break; + } + case R.id.actionToggleValues: { + for (IDataSet set : chart.getData().getDataSets()) + set.setDrawValues(!set.isDrawValuesEnabled()); + + chart.invalidate(); + break; + } + case R.id.actionToggleHighlight: { + if(chart.getData() != null) { + chart.getData().setHighlightEnabled(!chart.getData().isHighlightEnabled()); + chart.invalidate(); + } + break; + } + case R.id.actionToggleFilled: { + + List<ILineDataSet> sets = chart.getData() + .getDataSets(); + + for (ILineDataSet iSet : sets) { + + LineDataSet set = (LineDataSet) iSet; + + if (set.isDrawFilledEnabled()) + set.setDrawFilled(false); + else + set.setDrawFilled(true); + } + chart.invalidate(); + break; + } + case R.id.actionToggleCircles: { + List<ILineDataSet> sets = chart.getData() + .getDataSets(); + + for (ILineDataSet iSet : sets) { + + LineDataSet set = (LineDataSet) iSet; + if (set.isDrawCirclesEnabled()) + set.setDrawCircles(false); + else + set.setDrawCircles(true); + } + chart.invalidate(); + break; + } + case R.id.actionToggleCubic: { + List<ILineDataSet> sets = chart.getData() + .getDataSets(); + + for (ILineDataSet iSet : sets) { + + LineDataSet set = (LineDataSet) iSet; + set.setMode(set.getMode() == LineDataSet.Mode.CUBIC_BEZIER + ? LineDataSet.Mode.LINEAR + : LineDataSet.Mode.CUBIC_BEZIER); + } + chart.invalidate(); + break; + } + case R.id.actionToggleStepped: { + List<ILineDataSet> sets = chart.getData() + .getDataSets(); + + for (ILineDataSet iSet : sets) { + + LineDataSet set = (LineDataSet) iSet; + set.setMode(set.getMode() == LineDataSet.Mode.STEPPED + ? LineDataSet.Mode.LINEAR + : LineDataSet.Mode.STEPPED); + } + chart.invalidate(); + break; + } + case R.id.actionToggleHorizontalCubic: { + List<ILineDataSet> sets = chart.getData() + .getDataSets(); + + for (ILineDataSet iSet : sets) { + + LineDataSet set = (LineDataSet) iSet; + set.setMode(set.getMode() == LineDataSet.Mode.HORIZONTAL_BEZIER + ? LineDataSet.Mode.LINEAR + : LineDataSet.Mode.HORIZONTAL_BEZIER); + } + chart.invalidate(); + break; + } + case R.id.actionTogglePinch: { + if (chart.isPinchZoomEnabled()) + chart.setPinchZoom(false); + else + chart.setPinchZoom(true); + + chart.invalidate(); + break; + } + case R.id.actionToggleAutoScaleMinMax: { + chart.setAutoScaleMinMaxEnabled(!chart.isAutoScaleMinMaxEnabled()); + chart.notifyDataSetChanged(); + break; + } + case R.id.animateX: { + chart.animateX(2000); + break; + } + case R.id.animateY: { + chart.animateY(2000); + break; + } + case R.id.animateXY: { + chart.animateXY(2000, 2000); + break; + } + case R.id.actionSave: { + if (ContextCompat.checkSelfPermission(this, Manifest.permission.WRITE_EXTERNAL_STORAGE) == PackageManager.PERMISSION_GRANTED) { + saveToGallery(); + } else { + requestStoragePermission(chart); + } + break; + } + } + return true; + } + + @Override + public void onProgressChanged(SeekBar seekBar, int progress, boolean fromUser) { + + tvX.setText(String.valueOf(seekBarX.getProgress())); + tvY.setText(String.valueOf(seekBarY.getProgress())); + + setData(seekBarX.getProgress(), seekBarY.getProgress()); + + // redraw + chart.invalidate(); + } + + @Override + protected void saveToGallery() { + saveToGallery(chart, "CubicLineChartActivity"); + } + + @Override + public void onStartTrackingTouch(SeekBar seekBar) {} + + @Override + public void onStopTrackingTouch(SeekBar seekBar) {} +} diff --git a/MPChartExample/src/main/java/com/xxmassdeveloper/mpchartexample/DrawChartActivity.java b/MPChartExample/src/main/java/com/xxmassdeveloper/mpchartexample/DrawChartActivity.java new file mode 100644 index 00000000..7a32e532 --- /dev/null +++ b/MPChartExample/src/main/java/com/xxmassdeveloper/mpchartexample/DrawChartActivity.java @@ -0,0 +1,184 @@ +// TODO: Finish and add to main activity list +package com.xxmassdeveloper.mpchartexample; + +import android.Manifest; +import android.content.pm.PackageManager; +import android.os.Bundle; +import androidx.core.content.ContextCompat; +import android.util.Log; +import android.view.Menu; +import android.view.MenuItem; +import android.view.WindowManager; + +import com.github.mikephil.charting.charts.Chart; +import com.github.mikephil.charting.charts.LineChart; +import com.github.mikephil.charting.components.XAxis; +import com.github.mikephil.charting.components.YAxis; +import com.github.mikephil.charting.data.DataSet; +import com.github.mikephil.charting.data.Entry; +import com.github.mikephil.charting.data.LineData; +import com.github.mikephil.charting.data.LineDataSet; +import com.github.mikephil.charting.highlight.Highlight; +import com.github.mikephil.charting.interfaces.datasets.ILineDataSet; +import com.github.mikephil.charting.listener.OnChartValueSelectedListener; +import com.github.mikephil.charting.listener.OnDrawListener; +import com.xxmassdeveloper.mpchartexample.notimportant.DemoBase; + +import java.util.ArrayList; +import java.util.List; + +/** + * This Activity demonstrates drawing into the Chart with the finger. Both line, + * bar and scatter charts can be used for drawing. + * + * @author Philipp Jahoda + */ +public class DrawChartActivity extends DemoBase implements OnChartValueSelectedListener, + OnDrawListener { + + private LineChart chart; + + @Override + protected void onCreate(Bundle savedInstanceState) { + super.onCreate(savedInstanceState); + getWindow().setFlags(WindowManager.LayoutParams.FLAG_FULLSCREEN, + WindowManager.LayoutParams.FLAG_FULLSCREEN); + setContentView(R.layout.activity_draw_chart); + + setTitle("DrawChartActivity"); + + chart = findViewById(R.id.chart1); + + // listener for selecting and drawing + chart.setOnChartValueSelectedListener(this); + chart.setOnDrawListener(this); + + // if disabled, drawn data sets with the finger will not be automatically + // finished + // chart.setAutoFinish(true); + chart.setDrawGridBackground(false); + + // add dummy-data to the chart + initWithDummyData(); + + XAxis xl = chart.getXAxis(); + xl.setTypeface(tfRegular); + xl.setAvoidFirstLastClipping(true); + + YAxis yl = chart.getAxisLeft(); + yl.setTypeface(tfRegular); + + chart.getLegend().setEnabled(false); + + // chart.setYRange(-40f, 40f, true); + // call this to reset the changed y-range + // chart.resetYRange(true); + } + + private void initWithDummyData() { + + ArrayList<Entry> values = new ArrayList<>(); + + // create a dataset and give it a type (0) + LineDataSet set1 = new LineDataSet(values, "DataSet"); + set1.setLineWidth(3f); + set1.setCircleRadius(5f); + + // create a data object with the data sets + LineData data = new LineData(set1); + + chart.setData(data); + } + + @Override + public boolean onCreateOptionsMenu(Menu menu) { + getMenuInflater().inflate(R.menu.draw, menu); + return true; + } + + @Override + public boolean onOptionsItemSelected(MenuItem item) { + + switch (item.getItemId()) { + case R.id.actionToggleValues: { + List<ILineDataSet> sets = chart.getData() + .getDataSets(); + + for (ILineDataSet iSet : sets) { + + LineDataSet set = (LineDataSet) iSet; + set.setDrawValues(!set.isDrawValuesEnabled()); + } + + chart.invalidate(); + break; + } + case R.id.actionToggleHighlight: { + if(chart.getData() != null) { + chart.getData().setHighlightEnabled(!chart.getData().isHighlightEnabled()); + chart.invalidate(); + } + break; + } + case R.id.actionTogglePinch: { + if (chart.isPinchZoomEnabled()) + chart.setPinchZoom(false); + else + chart.setPinchZoom(true); + + chart.invalidate(); + break; + } + case R.id.actionToggleAutoScaleMinMax: { + chart.setAutoScaleMinMaxEnabled(!chart.isAutoScaleMinMaxEnabled()); + chart.notifyDataSetChanged(); + break; + } + case R.id.actionSave: { + if (ContextCompat.checkSelfPermission(this, Manifest.permission.WRITE_EXTERNAL_STORAGE) == PackageManager.PERMISSION_GRANTED) { + saveToGallery(); + } else { + requestStoragePermission(chart); + } + break; + } + } + return true; + } + + @Override + protected void saveToGallery() { + saveToGallery(chart, "DrawChartActivity"); + } + + @Override + public void onValueSelected(Entry e, Highlight h) { + Log.i("VAL SELECTED", + "Value: " + e.getY() + ", xIndex: " + e.getX() + + ", DataSet index: " + h.getDataSetIndex()); + } + + @Override + public void onNothingSelected() { + } + + /** callback for each new entry drawn with the finger */ + @Override + public void onEntryAdded(Entry entry) { + Log.i(Chart.LOG_TAG, entry.toString()); + } + + /** callback when a DataSet has been drawn (when lifting the finger) */ + @Override + public void onDrawFinished(DataSet<?> dataSet) { + Log.i(Chart.LOG_TAG, "DataSet drawn. " + dataSet.toSimpleString()); + + // prepare the legend again + chart.getLegendRenderer().computeLegend(chart.getData()); + } + + @Override + public void onEntryMoved(Entry entry) { + Log.i(Chart.LOG_TAG, "Point moved " + entry.toString()); + } +} diff --git a/MPChartExample/src/main/java/com/xxmassdeveloper/mpchartexample/DynamicalAddingActivity.java b/MPChartExample/src/main/java/com/xxmassdeveloper/mpchartexample/DynamicalAddingActivity.java new file mode 100644 index 00000000..84de4492 --- /dev/null +++ b/MPChartExample/src/main/java/com/xxmassdeveloper/mpchartexample/DynamicalAddingActivity.java @@ -0,0 +1,242 @@ + +package com.xxmassdeveloper.mpchartexample; + +import android.Manifest; +import android.content.Intent; +import android.content.pm.PackageManager; +import android.graphics.Color; +import android.net.Uri; +import android.os.Bundle; +import androidx.core.content.ContextCompat; +import android.view.Menu; +import android.view.MenuItem; +import android.view.WindowManager; +import android.widget.Toast; + +import com.github.mikephil.charting.charts.LineChart; +import com.github.mikephil.charting.components.YAxis.AxisDependency; +import com.github.mikephil.charting.data.Entry; +import com.github.mikephil.charting.data.LineData; +import com.github.mikephil.charting.data.LineDataSet; +import com.github.mikephil.charting.highlight.Highlight; +import com.github.mikephil.charting.interfaces.datasets.ILineDataSet; +import com.github.mikephil.charting.listener.OnChartValueSelectedListener; +import com.github.mikephil.charting.utils.ColorTemplate; +import com.xxmassdeveloper.mpchartexample.notimportant.DemoBase; + +import java.util.ArrayList; + +public class DynamicalAddingActivity extends DemoBase implements OnChartValueSelectedListener { + + private LineChart chart; + + @Override + protected void onCreate(Bundle savedInstanceState) { + super.onCreate(savedInstanceState); + getWindow().setFlags(WindowManager.LayoutParams.FLAG_FULLSCREEN, + WindowManager.LayoutParams.FLAG_FULLSCREEN); + setContentView(R.layout.activity_linechart_noseekbar); + + setTitle("DynamicalAddingActivity"); + + chart = findViewById(R.id.chart1); + chart.setOnChartValueSelectedListener(this); + chart.setDrawGridBackground(false); + chart.getDescription().setEnabled(false); + chart.setNoDataText("No chart data available. Use the menu to add entries and data sets!"); + +// chart.getXAxis().setDrawLabels(false); +// chart.getXAxis().setDrawGridLines(false); + + chart.invalidate(); + } + + private final int[] colors = ColorTemplate.VORDIPLOM_COLORS; + + private void addEntry() { + + LineData data = chart.getData(); + + if (data == null) { + data = new LineData(); + chart.setData(data); + } + + ILineDataSet set = data.getDataSetByIndex(0); + // set.addEntry(...); // can be called as well + + if (set == null) { + set = createSet(); + data.addDataSet(set); + } + + // choose a random dataSet + int randomDataSetIndex = (int) (Math.random() * data.getDataSetCount()); + ILineDataSet randomSet = data.getDataSetByIndex(randomDataSetIndex); + float value = (float) (Math.random() * 50) + 50f * (randomDataSetIndex + 1); + + data.addEntry(new Entry(randomSet.getEntryCount(), value), randomDataSetIndex); + data.notifyDataChanged(); + + // let the chart know it's data has changed + chart.notifyDataSetChanged(); + + chart.setVisibleXRangeMaximum(6); + //chart.setVisibleYRangeMaximum(15, AxisDependency.LEFT); +// +// // this automatically refreshes the chart (calls invalidate()) + chart.moveViewTo(data.getEntryCount() - 7, 50f, AxisDependency.LEFT); + + } + + private void removeLastEntry() { + + LineData data = chart.getData(); + + if (data != null) { + + ILineDataSet set = data.getDataSetByIndex(0); + + if (set != null) { + + Entry e = set.getEntryForXValue(set.getEntryCount() - 1, Float.NaN); + + data.removeEntry(e, 0); + // or remove by index + // mData.removeEntryByXValue(xIndex, dataSetIndex); + data.notifyDataChanged(); + chart.notifyDataSetChanged(); + chart.invalidate(); + } + } + } + + private void addDataSet() { + + LineData data = chart.getData(); + + if (data == null) { + chart.setData(new LineData()); + } else { + int count = (data.getDataSetCount() + 1); + int amount = data.getDataSetByIndex(0).getEntryCount(); + + ArrayList<Entry> values = new ArrayList<>(); + + for (int i = 0; i < amount; i++) { + values.add(new Entry(i, (float) (Math.random() * 50f) + 50f * count)); + } + + LineDataSet set = new LineDataSet(values, "DataSet " + count); + set.setLineWidth(2.5f); + set.setCircleRadius(4.5f); + + int color = colors[count % colors.length]; + + set.setColor(color); + set.setCircleColor(color); + set.setHighLightColor(color); + set.setValueTextSize(10f); + set.setValueTextColor(color); + + data.addDataSet(set); + data.notifyDataChanged(); + chart.notifyDataSetChanged(); + chart.invalidate(); + } + } + + private void removeDataSet() { + + LineData data = chart.getData(); + + if (data != null) { + + data.removeDataSet(data.getDataSetByIndex(data.getDataSetCount() - 1)); + + chart.notifyDataSetChanged(); + chart.invalidate(); + } + } + + private LineDataSet createSet() { + + LineDataSet set = new LineDataSet(null, "DataSet 1"); + set.setLineWidth(2.5f); + set.setCircleRadius(4.5f); + set.setColor(Color.rgb(240, 99, 99)); + set.setCircleColor(Color.rgb(240, 99, 99)); + set.setHighLightColor(Color.rgb(190, 190, 190)); + set.setAxisDependency(AxisDependency.LEFT); + set.setValueTextSize(10f); + + return set; + } + + @Override + public void onValueSelected(Entry e, Highlight h) { + Toast.makeText(this, e.toString(), Toast.LENGTH_SHORT).show(); + } + + @Override + public void onNothingSelected() {} + + @Override + public boolean onCreateOptionsMenu(Menu menu) { + getMenuInflater().inflate(R.menu.dynamical, menu); + return true; + } + + @Override + public boolean onOptionsItemSelected(MenuItem item) { + + switch (item.getItemId()) { + case R.id.viewGithub: { + Intent i = new Intent(Intent.ACTION_VIEW); + i.setData(Uri.parse("https://github.com/PhilJay/MPAndroidChart/blob/master/MPChartExample/src/com/xxmassdeveloper/mpchartexample/DynamicalAddingActivity.java")); + startActivity(i); + break; + } + case R.id.actionAddEntry: { + addEntry(); + Toast.makeText(this, "Entry added!", Toast.LENGTH_SHORT).show(); + break; + } + case R.id.actionRemoveEntry: { + removeLastEntry(); + Toast.makeText(this, "Entry removed!", Toast.LENGTH_SHORT).show(); + break; + } + case R.id.actionAddDataSet: { + addDataSet(); + Toast.makeText(this, "DataSet added!", Toast.LENGTH_SHORT).show(); + break; + } + case R.id.actionRemoveDataSet: { + removeDataSet(); + Toast.makeText(this, "DataSet removed!", Toast.LENGTH_SHORT).show(); + break; + } + case R.id.actionClear: { + chart.clear(); + Toast.makeText(this, "Chart cleared!", Toast.LENGTH_SHORT).show(); + break; + } + case R.id.actionSave: { + if (ContextCompat.checkSelfPermission(this, Manifest.permission.WRITE_EXTERNAL_STORAGE) == PackageManager.PERMISSION_GRANTED) { + saveToGallery(); + } else { + requestStoragePermission(chart); + } + break; + } + } + + return true; + } + + @Override + protected void saveToGallery() { + saveToGallery(chart, "DynamicalAddingActivity"); + } +} diff --git a/MPChartExample/src/main/java/com/xxmassdeveloper/mpchartexample/FilledLineActivity.java b/MPChartExample/src/main/java/com/xxmassdeveloper/mpchartexample/FilledLineActivity.java new file mode 100644 index 00000000..e821a049 --- /dev/null +++ b/MPChartExample/src/main/java/com/xxmassdeveloper/mpchartexample/FilledLineActivity.java @@ -0,0 +1,189 @@ + +package com.xxmassdeveloper.mpchartexample; + +import android.content.Intent; +import android.graphics.Color; +import android.net.Uri; +import android.os.Bundle; +import android.view.Menu; +import android.view.MenuItem; +import android.view.WindowManager; + +import com.github.mikephil.charting.charts.LineChart; +import com.github.mikephil.charting.components.Legend; +import com.github.mikephil.charting.components.XAxis; +import com.github.mikephil.charting.components.YAxis; +import com.github.mikephil.charting.data.Entry; +import com.github.mikephil.charting.data.LineData; +import com.github.mikephil.charting.data.LineDataSet; +import com.github.mikephil.charting.formatter.IFillFormatter; +import com.github.mikephil.charting.interfaces.dataprovider.LineDataProvider; +import com.github.mikephil.charting.interfaces.datasets.ILineDataSet; +import com.xxmassdeveloper.mpchartexample.notimportant.DemoBase; + +import java.util.ArrayList; + +/** + * This works by inverting the background and desired "fill" color. First, we draw the fill color + * that we want between the lines as the actual background of the chart. Then, we fill the area + * above the highest line and the area under the lowest line with the desired background color. + * + * This method makes it look like we filled the area between the lines, but really we are filling + * the area OUTSIDE the lines! + */ +@SuppressWarnings("SameParameterValue") +public class FilledLineActivity extends DemoBase { + + private LineChart chart; + private final int fillColor = Color.argb(150, 51, 181, 229); + + @Override + protected void onCreate(Bundle savedInstanceState) { + super.onCreate(savedInstanceState); + getWindow().setFlags(WindowManager.LayoutParams.FLAG_FULLSCREEN, + WindowManager.LayoutParams.FLAG_FULLSCREEN); + setContentView(R.layout.activity_linechart_noseekbar); + + setTitle("FilledLineActivity"); + + chart = findViewById(R.id.chart1); + chart.setBackgroundColor(Color.WHITE); + chart.setGridBackgroundColor(fillColor); + chart.setDrawGridBackground(true); + + chart.setDrawBorders(true); + + // no description text + chart.getDescription().setEnabled(false); + + // if disabled, scaling can be done on x- and y-axis separately + chart.setPinchZoom(false); + + Legend l = chart.getLegend(); + l.setEnabled(false); + + XAxis xAxis = chart.getXAxis(); + xAxis.setEnabled(false); + + YAxis leftAxis = chart.getAxisLeft(); + leftAxis.setAxisMaximum(900f); + leftAxis.setAxisMinimum(-250f); + leftAxis.setDrawAxisLine(false); + leftAxis.setDrawZeroLine(false); + leftAxis.setDrawGridLines(false); + + chart.getAxisRight().setEnabled(false); + + // add data + setData(100, 60); + + chart.invalidate(); + } + + private void setData(int count, float range) { + + ArrayList<Entry> values1 = new ArrayList<>(); + + for (int i = 0; i < count; i++) { + float val = (float) (Math.random() * range) + 50; + values1.add(new Entry(i, val)); + } + + ArrayList<Entry> values2 = new ArrayList<>(); + + for (int i = 0; i < count; i++) { + float val = (float) (Math.random() * range) + 450; + values2.add(new Entry(i, val)); + } + + LineDataSet set1, set2; + + if (chart.getData() != null && + chart.getData().getDataSetCount() > 0) { + set1 = (LineDataSet) chart.getData().getDataSetByIndex(0); + set2 = (LineDataSet) chart.getData().getDataSetByIndex(1); + set1.setValues(values1); + set2.setValues(values2); + chart.getData().notifyDataChanged(); + chart.notifyDataSetChanged(); + } else { + // create a dataset and give it a type + set1 = new LineDataSet(values1, "DataSet 1"); + + set1.setAxisDependency(YAxis.AxisDependency.LEFT); + set1.setColor(Color.rgb(255, 241, 46)); + set1.setDrawCircles(false); + set1.setLineWidth(2f); + set1.setCircleRadius(3f); + set1.setFillAlpha(255); + set1.setDrawFilled(true); + set1.setFillColor(Color.WHITE); + set1.setHighLightColor(Color.rgb(244, 117, 117)); + set1.setDrawCircleHole(false); + set1.setFillFormatter(new IFillFormatter() { + @Override + public float getFillLinePosition(ILineDataSet dataSet, LineDataProvider dataProvider) { + // change the return value here to better understand the effect + // return 0; + return chart.getAxisLeft().getAxisMinimum(); + } + }); + + // create a dataset and give it a type + set2 = new LineDataSet(values2, "DataSet 2"); + set2.setAxisDependency(YAxis.AxisDependency.LEFT); + set2.setColor(Color.rgb(255, 241, 46)); + set2.setDrawCircles(false); + set2.setLineWidth(2f); + set2.setCircleRadius(3f); + set2.setFillAlpha(255); + set2.setDrawFilled(true); + set2.setFillColor(Color.WHITE); + set2.setDrawCircleHole(false); + set2.setHighLightColor(Color.rgb(244, 117, 117)); + set2.setFillFormatter(new IFillFormatter() { + @Override + public float getFillLinePosition(ILineDataSet dataSet, LineDataProvider dataProvider) { + // change the return value here to better understand the effect + // return 600; + return chart.getAxisLeft().getAxisMaximum(); + } + }); + + ArrayList<ILineDataSet> dataSets = new ArrayList<>(); + dataSets.add(set1); // add the data sets + dataSets.add(set2); + + // create a data object with the data sets + LineData data = new LineData(dataSets); + data.setDrawValues(false); + + // set data + chart.setData(data); + } + } + + @Override + public boolean onCreateOptionsMenu(Menu menu) { + getMenuInflater().inflate(R.menu.only_github, menu); + return true; + } + + @Override + public boolean onOptionsItemSelected(MenuItem item) { + + switch (item.getItemId()) { + case R.id.viewGithub: { + Intent i = new Intent(Intent.ACTION_VIEW); + i.setData(Uri.parse("https://github.com/PhilJay/MPAndroidChart/blob/master/MPChartExample/src/com/xxmassdeveloper/mpchartexample/FilledLineActivity.java")); + startActivity(i); + break; + } + } + + return true; + } + + @Override + public void saveToGallery() { /* Intentionally left empty */ } +} diff --git a/MPChartExample/src/main/java/com/xxmassdeveloper/mpchartexample/HalfPieChartActivity.java b/MPChartExample/src/main/java/com/xxmassdeveloper/mpchartexample/HalfPieChartActivity.java new file mode 100644 index 00000000..ed2adcc9 --- /dev/null +++ b/MPChartExample/src/main/java/com/xxmassdeveloper/mpchartexample/HalfPieChartActivity.java @@ -0,0 +1,168 @@ + +package com.xxmassdeveloper.mpchartexample; + +import android.content.Intent; +import android.graphics.Color; +import android.graphics.Typeface; +import android.net.Uri; +import android.os.Bundle; +import android.text.SpannableString; +import android.text.style.ForegroundColorSpan; +import android.text.style.RelativeSizeSpan; +import android.text.style.StyleSpan; +import android.util.DisplayMetrics; +import android.view.Menu; +import android.view.MenuItem; +import android.view.WindowManager; +import android.widget.RelativeLayout; + +import com.github.mikephil.charting.animation.Easing; +import com.github.mikephil.charting.charts.PieChart; +import com.github.mikephil.charting.components.Legend; +import com.github.mikephil.charting.data.PieData; +import com.github.mikephil.charting.data.PieDataSet; +import com.github.mikephil.charting.data.PieEntry; +import com.github.mikephil.charting.formatter.PercentFormatter; +import com.github.mikephil.charting.utils.ColorTemplate; +import com.xxmassdeveloper.mpchartexample.notimportant.DemoBase; + +import java.util.ArrayList; + +@SuppressWarnings("SameParameterValue") +public class HalfPieChartActivity extends DemoBase { + + private PieChart chart; + + @Override + protected void onCreate(Bundle savedInstanceState) { + super.onCreate(savedInstanceState); + getWindow().setFlags(WindowManager.LayoutParams.FLAG_FULLSCREEN, + WindowManager.LayoutParams.FLAG_FULLSCREEN); + setContentView(R.layout.activity_piechart_half); + + setTitle("HalfPieChartActivity"); + + chart = findViewById(R.id.chart1); + chart.setBackgroundColor(Color.WHITE); + + moveOffScreen(); + + chart.setUsePercentValues(true); + chart.getDescription().setEnabled(false); + + chart.setCenterTextTypeface(tfLight); + chart.setCenterText(generateCenterSpannableText()); + + chart.setDrawHoleEnabled(true); + chart.setHoleColor(Color.WHITE); + + chart.setTransparentCircleColor(Color.WHITE); + chart.setTransparentCircleAlpha(110); + + chart.setHoleRadius(58f); + chart.setTransparentCircleRadius(61f); + + chart.setDrawCenterText(true); + + chart.setRotationEnabled(false); + chart.setHighlightPerTapEnabled(true); + + chart.setMaxAngle(180f); // HALF CHART + chart.setRotationAngle(180f); + chart.setCenterTextOffset(0, -20); + + setData(4, 100); + + chart.animateY(1400, Easing.EaseInOutQuad); + + Legend l = chart.getLegend(); + l.setVerticalAlignment(Legend.LegendVerticalAlignment.TOP); + l.setHorizontalAlignment(Legend.LegendHorizontalAlignment.CENTER); + l.setOrientation(Legend.LegendOrientation.HORIZONTAL); + l.setDrawInside(false); + l.setXEntrySpace(7f); + l.setYEntrySpace(0f); + l.setYOffset(0f); + + // entry label styling + chart.setEntryLabelColor(Color.WHITE); + chart.setEntryLabelTypeface(tfRegular); + chart.setEntryLabelTextSize(12f); + } + + private void setData(int count, float range) { + + ArrayList<PieEntry> values = new ArrayList<>(); + + for (int i = 0; i < count; i++) { + values.add(new PieEntry((float) ((Math.random() * range) + range / 5), parties[i % parties.length])); + } + + PieDataSet dataSet = new PieDataSet(values, "Election Results"); + dataSet.setSliceSpace(3f); + dataSet.setSelectionShift(5f); + + dataSet.setColors(ColorTemplate.MATERIAL_COLORS); + //dataSet.setSelectionShift(0f); + + PieData data = new PieData(dataSet); + data.setValueFormatter(new PercentFormatter()); + data.setValueTextSize(11f); + data.setValueTextColor(Color.WHITE); + data.setValueTypeface(tfLight); + chart.setData(data); + + chart.invalidate(); + } + + private SpannableString generateCenterSpannableText() { + + SpannableString s = new SpannableString("MPAndroidChart\ndeveloped by Philipp Jahoda"); + s.setSpan(new RelativeSizeSpan(1.7f), 0, 14, 0); + s.setSpan(new StyleSpan(Typeface.NORMAL), 14, s.length() - 15, 0); + s.setSpan(new ForegroundColorSpan(Color.GRAY), 14, s.length() - 15, 0); + s.setSpan(new RelativeSizeSpan(.8f), 14, s.length() - 15, 0); + s.setSpan(new StyleSpan(Typeface.ITALIC), s.length() - 14, s.length(), 0); + s.setSpan(new ForegroundColorSpan(ColorTemplate.getHoloBlue()), s.length() - 14, s.length(), 0); + return s; + } + + private void moveOffScreen() { + + DisplayMetrics displayMetrics = new DisplayMetrics(); + getWindowManager().getDefaultDisplay().getMetrics(displayMetrics); + + int height = displayMetrics.heightPixels; + + int offset = (int)(height * 0.65); /* percent to move */ + + RelativeLayout.LayoutParams rlParams = + (RelativeLayout.LayoutParams) chart.getLayoutParams(); + rlParams.setMargins(0, 0, 0, -offset); + chart.setLayoutParams(rlParams); + } + + @Override + public boolean onCreateOptionsMenu(Menu menu) { + getMenuInflater().inflate(R.menu.only_github, menu); + return true; + } + + @Override + public boolean onOptionsItemSelected(MenuItem item) { + + switch (item.getItemId()) { + case R.id.viewGithub: { + Intent i = new Intent(Intent.ACTION_VIEW); + i.setData(Uri.parse("https://github.com/PhilJay/MPAndroidChart/blob/master/MPChartExample/src/com/xxmassdeveloper/mpchartexample/HalfPieChartActivity.java")); + startActivity(i); + break; + } + } + + return true; + } + + @Override + public void saveToGallery() { /* Intentionally left empty */ } +} diff --git a/MPChartExample/src/main/java/com/xxmassdeveloper/mpchartexample/HorizontalBarChartActivity.java b/MPChartExample/src/main/java/com/xxmassdeveloper/mpchartexample/HorizontalBarChartActivity.java new file mode 100644 index 00000000..27f7f296 --- /dev/null +++ b/MPChartExample/src/main/java/com/xxmassdeveloper/mpchartexample/HorizontalBarChartActivity.java @@ -0,0 +1,291 @@ + +package com.xxmassdeveloper.mpchartexample; + +import android.Manifest; +import android.content.Intent; +import android.content.pm.PackageManager; +import android.graphics.RectF; +import android.net.Uri; +import android.os.Bundle; +import androidx.core.content.ContextCompat; +import android.util.Log; +import android.view.Menu; +import android.view.MenuItem; +import android.view.WindowManager; +import android.widget.SeekBar; +import android.widget.SeekBar.OnSeekBarChangeListener; +import android.widget.TextView; + +import com.github.mikephil.charting.charts.HorizontalBarChart; +import com.github.mikephil.charting.components.Legend; +import com.github.mikephil.charting.components.XAxis; +import com.github.mikephil.charting.components.XAxis.XAxisPosition; +import com.github.mikephil.charting.components.YAxis; +import com.github.mikephil.charting.data.BarData; +import com.github.mikephil.charting.data.BarDataSet; +import com.github.mikephil.charting.data.BarEntry; +import com.github.mikephil.charting.data.Entry; +import com.github.mikephil.charting.highlight.Highlight; +import com.github.mikephil.charting.interfaces.datasets.IBarDataSet; +import com.github.mikephil.charting.listener.OnChartValueSelectedListener; +import com.github.mikephil.charting.utils.MPPointF; +import com.xxmassdeveloper.mpchartexample.notimportant.DemoBase; + +import java.util.ArrayList; +import java.util.List; + +public class HorizontalBarChartActivity extends DemoBase implements OnSeekBarChangeListener, + OnChartValueSelectedListener { + + private HorizontalBarChart chart; + private SeekBar seekBarX, seekBarY; + private TextView tvX, tvY; + + @Override + protected void onCreate(Bundle savedInstanceState) { + super.onCreate(savedInstanceState); + getWindow().setFlags(WindowManager.LayoutParams.FLAG_FULLSCREEN, + WindowManager.LayoutParams.FLAG_FULLSCREEN); + setContentView(R.layout.activity_horizontalbarchart); + + setTitle("HorizontalBarChartActivity"); + + tvX = findViewById(R.id.tvXMax); + tvY = findViewById(R.id.tvYMax); + + seekBarX = findViewById(R.id.seekBar1); + seekBarY = findViewById(R.id.seekBar2); + + seekBarY.setOnSeekBarChangeListener(this); + seekBarX.setOnSeekBarChangeListener(this); + + chart = findViewById(R.id.chart1); + chart.setOnChartValueSelectedListener(this); + // chart.setHighlightEnabled(false); + + chart.setDrawBarShadow(false); + + chart.setDrawValueAboveBar(true); + + chart.getDescription().setEnabled(false); + + // if more than 60 entries are displayed in the chart, no values will be + // drawn + chart.setMaxVisibleValueCount(60); + + // scaling can now only be done on x- and y-axis separately + chart.setPinchZoom(false); + + // draw shadows for each bar that show the maximum value + // chart.setDrawBarShadow(true); + + chart.setDrawGridBackground(false); + + XAxis xl = chart.getXAxis(); + xl.setPosition(XAxisPosition.BOTTOM); + xl.setTypeface(tfLight); + xl.setDrawAxisLine(true); + xl.setDrawGridLines(false); + xl.setGranularity(10f); + + YAxis yl = chart.getAxisLeft(); + yl.setTypeface(tfLight); + yl.setDrawAxisLine(true); + yl.setDrawGridLines(true); + yl.setAxisMinimum(0f); // this replaces setStartAtZero(true) +// yl.setInverted(true); + + YAxis yr = chart.getAxisRight(); + yr.setTypeface(tfLight); + yr.setDrawAxisLine(true); + yr.setDrawGridLines(false); + yr.setAxisMinimum(0f); // this replaces setStartAtZero(true) +// yr.setInverted(true); + + chart.setFitBars(true); + chart.animateY(2500); + + // setting data + seekBarY.setProgress(50); + seekBarX.setProgress(12); + + Legend l = chart.getLegend(); + l.setVerticalAlignment(Legend.LegendVerticalAlignment.BOTTOM); + l.setHorizontalAlignment(Legend.LegendHorizontalAlignment.LEFT); + l.setOrientation(Legend.LegendOrientation.HORIZONTAL); + l.setDrawInside(false); + l.setFormSize(8f); + l.setXEntrySpace(4f); + } + + private void setData(int count, float range) { + + float barWidth = 9f; + float spaceForBar = 10f; + ArrayList<BarEntry> values = new ArrayList<>(); + + for (int i = 0; i < count; i++) { + float val = (float) (Math.random() * range); + values.add(new BarEntry(i * spaceForBar, val, + getResources().getDrawable(R.drawable.star))); + } + + BarDataSet set1; + + if (chart.getData() != null && + chart.getData().getDataSetCount() > 0) { + set1 = (BarDataSet) chart.getData().getDataSetByIndex(0); + set1.setValues(values); + chart.getData().notifyDataChanged(); + chart.notifyDataSetChanged(); + } else { + set1 = new BarDataSet(values, "DataSet 1"); + + set1.setDrawIcons(false); + + ArrayList<IBarDataSet> dataSets = new ArrayList<>(); + dataSets.add(set1); + + BarData data = new BarData(dataSets); + data.setValueTextSize(10f); + data.setValueTypeface(tfLight); + data.setBarWidth(barWidth); + chart.setData(data); + } + } + + @Override + public boolean onCreateOptionsMenu(Menu menu) { + getMenuInflater().inflate(R.menu.bar, menu); + return true; + } + + @Override + public boolean onOptionsItemSelected(MenuItem item) { + + switch (item.getItemId()) { + case R.id.viewGithub: { + Intent i = new Intent(Intent.ACTION_VIEW); + i.setData(Uri.parse("https://github.com/PhilJay/MPAndroidChart/blob/master/MPChartExample/src/com/xxmassdeveloper/mpchartexample/HorizontalBarChartActivity.java")); + startActivity(i); + break; + } + case R.id.actionToggleValues: { + List<IBarDataSet> sets = chart.getData() + .getDataSets(); + + for (IBarDataSet iSet : sets) { + iSet.setDrawValues(!iSet.isDrawValuesEnabled()); + } + + chart.invalidate(); + break; + } + case R.id.actionToggleIcons: { + List<IBarDataSet> sets = chart.getData() + .getDataSets(); + + for (IBarDataSet iSet : sets) { + iSet.setDrawIcons(!iSet.isDrawIconsEnabled()); + } + + chart.invalidate(); + break; + } + case R.id.actionToggleHighlight: { + if(chart.getData() != null) { + chart.getData().setHighlightEnabled(!chart.getData().isHighlightEnabled()); + chart.invalidate(); + } + break; + } + case R.id.actionTogglePinch: { + if (chart.isPinchZoomEnabled()) + chart.setPinchZoom(false); + else + chart.setPinchZoom(true); + + chart.invalidate(); + break; + } + case R.id.actionToggleAutoScaleMinMax: { + chart.setAutoScaleMinMaxEnabled(!chart.isAutoScaleMinMaxEnabled()); + chart.notifyDataSetChanged(); + break; + } + case R.id.actionToggleBarBorders: { + for (IBarDataSet set : chart.getData().getDataSets()) + ((BarDataSet)set).setBarBorderWidth(set.getBarBorderWidth() == 1.f ? 0.f : 1.f); + + chart.invalidate(); + break; + } + case R.id.animateX: { + chart.animateX(2000); + break; + } + case R.id.animateY: { + chart.animateY(2000); + break; + } + case R.id.animateXY: { + chart.animateXY(2000, 2000); + break; + } + case R.id.actionSave: { + if (ContextCompat.checkSelfPermission(this, Manifest.permission.WRITE_EXTERNAL_STORAGE) == PackageManager.PERMISSION_GRANTED) { + saveToGallery(); + } else { + requestStoragePermission(chart); + } + break; + } + } + return true; + } + + @Override + public void onProgressChanged(SeekBar seekBar, int progress, boolean fromUser) { + + tvX.setText(String.valueOf(seekBarX.getProgress())); + tvY.setText(String.valueOf(seekBarY.getProgress())); + + setData(seekBarX.getProgress(), seekBarY.getProgress()); + chart.setFitBars(true); + chart.invalidate(); + } + + @Override + protected void saveToGallery() { + saveToGallery(chart, "HorizontalBarChartActivity"); + } + + @Override + public void onStartTrackingTouch(SeekBar seekBar) {} + + @Override + public void onStopTrackingTouch(SeekBar seekBar) {} + + private final RectF mOnValueSelectedRectF = new RectF(); + + @Override + public void onValueSelected(Entry e, Highlight h) { + + if (e == null) + return; + + RectF bounds = mOnValueSelectedRectF; + chart.getBarBounds((BarEntry) e, bounds); + + MPPointF position = chart.getPosition(e, chart.getData().getDataSetByIndex(h.getDataSetIndex()) + .getAxisDependency()); + + Log.i("bounds", bounds.toString()); + Log.i("position", position.toString()); + + MPPointF.recycleInstance(position); + } + + @Override + public void onNothingSelected() {} +} diff --git a/MPChartExample/src/main/java/com/xxmassdeveloper/mpchartexample/HorizontalBarNegativeChartActivity.java b/MPChartExample/src/main/java/com/xxmassdeveloper/mpchartexample/HorizontalBarNegativeChartActivity.java new file mode 100644 index 00000000..86d578cc --- /dev/null +++ b/MPChartExample/src/main/java/com/xxmassdeveloper/mpchartexample/HorizontalBarNegativeChartActivity.java @@ -0,0 +1,292 @@ + +package com.xxmassdeveloper.mpchartexample; + +import android.Manifest; +import android.annotation.SuppressLint; +import android.content.Intent; +import android.content.pm.PackageManager; +import android.graphics.RectF; +import android.net.Uri; +import android.os.Bundle; +import android.util.Log; +import android.view.Menu; +import android.view.MenuItem; +import android.view.WindowManager; +import android.widget.SeekBar; +import android.widget.SeekBar.OnSeekBarChangeListener; +import android.widget.TextView; +import android.widget.Toast; + +import androidx.core.content.ContextCompat; + +import com.github.mikephil.charting.charts.HorizontalBarChart; +import com.github.mikephil.charting.components.Legend; +import com.github.mikephil.charting.components.XAxis; +import com.github.mikephil.charting.components.XAxis.XAxisPosition; +import com.github.mikephil.charting.components.YAxis; +import com.github.mikephil.charting.data.BarData; +import com.github.mikephil.charting.data.BarDataSet; +import com.github.mikephil.charting.data.BarEntry; +import com.github.mikephil.charting.data.Entry; +import com.github.mikephil.charting.highlight.Highlight; +import com.github.mikephil.charting.interfaces.datasets.IBarDataSet; +import com.github.mikephil.charting.listener.OnChartValueSelectedListener; +import com.github.mikephil.charting.utils.MPPointF; +import com.xxmassdeveloper.mpchartexample.notimportant.DemoBase; + +import java.util.ArrayList; +import java.util.List; + +public class HorizontalBarNegativeChartActivity extends DemoBase implements OnSeekBarChangeListener, + OnChartValueSelectedListener { + + private HorizontalBarChart chart; + private SeekBar seekBarX, seekBarY; + private TextView tvX, tvY; + + @Override + protected void onCreate(Bundle savedInstanceState) { + super.onCreate(savedInstanceState); + getWindow().setFlags(WindowManager.LayoutParams.FLAG_FULLSCREEN, + WindowManager.LayoutParams.FLAG_FULLSCREEN); + setContentView(R.layout.activity_horizontalbarchart); + + setTitle("HorizontalBarChartActivity"); + + tvX = findViewById(R.id.tvXMax); + tvY = findViewById(R.id.tvYMax); + + seekBarX = findViewById(R.id.seekBar1); + seekBarY = findViewById(R.id.seekBar2); + + seekBarY.setOnSeekBarChangeListener(this); + seekBarX.setOnSeekBarChangeListener(this); + + chart = findViewById(R.id.chart1); + chart.setOnChartValueSelectedListener(this); + // chart.setHighlightEnabled(false); + + chart.setDrawBarShadow(false); + + chart.setDrawValueAboveBar(true); + + chart.getDescription().setEnabled(false); + + // if more than 60 entries are displayed in the chart, no values will be + // drawn + chart.setMaxVisibleValueCount(60); + + // scaling can now only be done on x- and y-axis separately + chart.setPinchZoom(false); + + // draw shadows for each bar that show the maximum value + // chart.setDrawBarShadow(true); + + chart.setDrawGridBackground(false); + + XAxis xl = chart.getXAxis(); + xl.setPosition(XAxisPosition.BOTTOM); + xl.setTypeface(tfLight); + xl.setDrawAxisLine(true); + xl.setDrawGridLines(false); + xl.setGranularity(10f); + + YAxis yl = chart.getAxisLeft(); + yl.setTypeface(tfLight); + yl.setDrawAxisLine(true); + yl.setDrawGridLines(true); +// yl.setInverted(true); + + YAxis yr = chart.getAxisRight(); + yr.setTypeface(tfLight); + yr.setDrawAxisLine(true); + yr.setDrawGridLines(false); +// yr.setInverted(true); + + chart.setFitBars(true); + chart.animateY(2500); + + // setting data + seekBarY.setProgress(50); + seekBarX.setProgress(12); + + Legend l = chart.getLegend(); + l.setVerticalAlignment(Legend.LegendVerticalAlignment.BOTTOM); + l.setHorizontalAlignment(Legend.LegendHorizontalAlignment.LEFT); + l.setOrientation(Legend.LegendOrientation.HORIZONTAL); + l.setDrawInside(false); + l.setFormSize(8f); + l.setXEntrySpace(4f); + } + + private void setData(int count, float range) { + + float barWidth = 9f; + float spaceForBar = 10f; + ArrayList<BarEntry> values = new ArrayList<>(); + + for (int i = 0; i < count; i++) { + float val = (float) (Math.random() * range - range / 2); + values.add(new BarEntry(i * spaceForBar, val, + getResources().getDrawable(R.drawable.star))); + } + + BarDataSet set1; + + if (chart.getData() != null && + chart.getData().getDataSetCount() > 0) { + set1 = (BarDataSet) chart.getData().getDataSetByIndex(0); + set1.setValues(values); + chart.getData().notifyDataChanged(); + chart.notifyDataSetChanged(); + } else { + set1 = new BarDataSet(values, "DataSet 1"); + + set1.setDrawIcons(false); + + ArrayList<IBarDataSet> dataSets = new ArrayList<>(); + dataSets.add(set1); + + BarData data = new BarData(dataSets); + data.setValueTextSize(10f); + data.setValueTypeface(tfLight); + data.setBarWidth(barWidth); + chart.setData(data); + } + } + + @Override + public boolean onCreateOptionsMenu(Menu menu) { + getMenuInflater().inflate(R.menu.bar, menu); + return true; + } + + @Override + public boolean onOptionsItemSelected(MenuItem item) { + + switch (item.getItemId()) { + case R.id.viewGithub: { + Intent i = new Intent(Intent.ACTION_VIEW); + i.setData(Uri.parse("https://github.com/PhilJay/MPAndroidChart/blob/master/MPChartExample/src/com/xxmassdeveloper/mpchartexample/HorizontalBarChartActivity.java")); + startActivity(i); + break; + } + case R.id.actionToggleValues: { + List<IBarDataSet> sets = chart.getData() + .getDataSets(); + + for (IBarDataSet iSet : sets) { + iSet.setDrawValues(!iSet.isDrawValuesEnabled()); + } + + chart.invalidate(); + break; + } + case R.id.actionToggleIcons: { + List<IBarDataSet> sets = chart.getData() + .getDataSets(); + + for (IBarDataSet iSet : sets) { + iSet.setDrawIcons(!iSet.isDrawIconsEnabled()); + } + + chart.invalidate(); + break; + } + case R.id.actionToggleHighlight: { + if(chart.getData() != null) { + chart.getData().setHighlightEnabled(!chart.getData().isHighlightEnabled()); + chart.invalidate(); + } + break; + } + case R.id.actionTogglePinch: { + if (chart.isPinchZoomEnabled()) + chart.setPinchZoom(false); + else + chart.setPinchZoom(true); + + chart.invalidate(); + break; + } + case R.id.actionToggleAutoScaleMinMax: { + chart.setAutoScaleMinMaxEnabled(!chart.isAutoScaleMinMaxEnabled()); + chart.notifyDataSetChanged(); + break; + } + case R.id.actionToggleBarBorders: { + for (IBarDataSet set : chart.getData().getDataSets()) + ((BarDataSet)set).setBarBorderWidth(set.getBarBorderWidth() == 1.f ? 0.f : 1.f); + + chart.invalidate(); + break; + } + case R.id.animateX: { + chart.animateX(2000); + break; + } + case R.id.animateY: { + chart.animateY(2000); + break; + } + case R.id.animateXY: { + chart.animateXY(2000, 2000); + break; + } + case R.id.actionSave: { + if (ContextCompat.checkSelfPermission(this, Manifest.permission.WRITE_EXTERNAL_STORAGE) == PackageManager.PERMISSION_GRANTED) { + saveToGallery(); + } else { + requestStoragePermission(chart); + } + break; + } + } + return true; + } + + @Override + public void onProgressChanged(SeekBar seekBar, int progress, boolean fromUser) { + + tvX.setText(String.valueOf(seekBarX.getProgress())); + tvY.setText(String.valueOf(seekBarY.getProgress())); + + setData(seekBarX.getProgress(), seekBarY.getProgress()); + chart.setFitBars(true); + chart.invalidate(); + } + + @Override + protected void saveToGallery() { + saveToGallery(chart, "HorizontalBarChartActivity"); + } + + @Override + public void onStartTrackingTouch(SeekBar seekBar) {} + + @Override + public void onStopTrackingTouch(SeekBar seekBar) {} + + private final RectF mOnValueSelectedRectF = new RectF(); + + @Override + public void onValueSelected(Entry e, Highlight h) { + + if (e == null) + return; + + RectF bounds = mOnValueSelectedRectF; + chart.getBarBounds((BarEntry) e, bounds); + + MPPointF position = chart.getPosition(e, chart.getData().getDataSetByIndex(h.getDataSetIndex()) + .getAxisDependency()); + + Log.i("bounds", bounds.toString()); + Log.i("position", position.toString()); + + MPPointF.recycleInstance(position); + } + + @Override + public void onNothingSelected() {} +} diff --git a/MPChartExample/src/main/java/com/xxmassdeveloper/mpchartexample/InvertedLineChartActivity.java b/MPChartExample/src/main/java/com/xxmassdeveloper/mpchartexample/InvertedLineChartActivity.java new file mode 100644 index 00000000..08983710 --- /dev/null +++ b/MPChartExample/src/main/java/com/xxmassdeveloper/mpchartexample/InvertedLineChartActivity.java @@ -0,0 +1,283 @@ + +package com.xxmassdeveloper.mpchartexample; + +import android.Manifest; +import android.content.Intent; +import android.content.pm.PackageManager; +import android.net.Uri; +import android.os.Bundle; +import androidx.core.content.ContextCompat; +import android.util.Log; +import android.view.Menu; +import android.view.MenuItem; +import android.view.WindowManager; +import android.widget.SeekBar; +import android.widget.SeekBar.OnSeekBarChangeListener; +import android.widget.TextView; + +import com.github.mikephil.charting.charts.LineChart; +import com.github.mikephil.charting.components.Legend; +import com.github.mikephil.charting.components.Legend.LegendForm; +import com.github.mikephil.charting.components.XAxis; +import com.github.mikephil.charting.components.YAxis; +import com.github.mikephil.charting.data.Entry; +import com.github.mikephil.charting.data.LineData; +import com.github.mikephil.charting.data.LineDataSet; +import com.github.mikephil.charting.highlight.Highlight; +import com.github.mikephil.charting.interfaces.datasets.ILineDataSet; +import com.github.mikephil.charting.listener.OnChartValueSelectedListener; +import com.github.mikephil.charting.utils.EntryXComparator; +import com.xxmassdeveloper.mpchartexample.custom.MyMarkerView; +import com.xxmassdeveloper.mpchartexample.notimportant.DemoBase; + +import java.util.ArrayList; +import java.util.Collections; +import java.util.List; + +public class InvertedLineChartActivity extends DemoBase implements OnSeekBarChangeListener, + OnChartValueSelectedListener { + + private LineChart chart; + private SeekBar seekBarX, seekBarY; + private TextView tvX, tvY; + + @Override + protected void onCreate(Bundle savedInstanceState) { + super.onCreate(savedInstanceState); + getWindow().setFlags(WindowManager.LayoutParams.FLAG_FULLSCREEN, + WindowManager.LayoutParams.FLAG_FULLSCREEN); + setContentView(R.layout.activity_linechart); + + setTitle("InvertedLineChartActivity"); + + tvX = findViewById(R.id.tvXMax); + tvY = findViewById(R.id.tvYMax); + + seekBarX = findViewById(R.id.seekBar1); + seekBarY = findViewById(R.id.seekBar2); + + seekBarY.setOnSeekBarChangeListener(this); + seekBarX.setOnSeekBarChangeListener(this); + + chart = findViewById(R.id.chart1); + chart.setOnChartValueSelectedListener(this); + chart.setDrawGridBackground(false); + + // no description text + chart.getDescription().setEnabled(false); + + // enable touch gestures + chart.setTouchEnabled(true); + + // enable scaling and dragging + chart.setDragEnabled(true); + chart.setScaleEnabled(true); + + // if disabled, scaling can be done on x- and y-axis separately + chart.setPinchZoom(true); + + // set an alternative background color + // chart.setBackgroundColor(Color.GRAY); + + // create a custom MarkerView (extend MarkerView) and specify the layout + // to use for it + MyMarkerView mv = new MyMarkerView(this, R.layout.custom_marker_view); + mv.setChartView(chart); // For bounds control + chart.setMarker(mv); // Set the marker to the chart + + XAxis xl = chart.getXAxis(); + xl.setAvoidFirstLastClipping(true); + xl.setAxisMinimum(0f); + + YAxis leftAxis = chart.getAxisLeft(); + leftAxis.setInverted(true); + leftAxis.setAxisMinimum(0f); // this replaces setStartAtZero(true) + + YAxis rightAxis = chart.getAxisRight(); + rightAxis.setEnabled(false); + + // add data + seekBarX.setProgress(25); + seekBarY.setProgress(50); + + // // restrain the maximum scale-out factor + // chart.setScaleMinima(3f, 3f); + // + // // center the view to a specific position inside the chart + // chart.centerViewPort(10, 50); + + // get the legend (only possible after setting data) + Legend l = chart.getLegend(); + + // modify the legend ... + l.setForm(LegendForm.LINE); + + // don't forget to refresh the drawing + chart.invalidate(); + } + + private void setData(int count, float range) { + + ArrayList<Entry> entries = new ArrayList<>(); + + for (int i = 0; i < count; i++) { + float xVal = (float) (Math.random() * range); + float yVal = (float) (Math.random() * range); + entries.add(new Entry(xVal, yVal)); + } + + // sort by x-value + Collections.sort(entries, new EntryXComparator()); + + // create a dataset and give it a type + LineDataSet set1 = new LineDataSet(entries, "DataSet 1"); + + set1.setLineWidth(1.5f); + set1.setCircleRadius(4f); + + // create a data object with the data sets + LineData data = new LineData(set1); + + // set data + chart.setData(data); + } + + @Override + public boolean onCreateOptionsMenu(Menu menu) { + getMenuInflater().inflate(R.menu.line, menu); + return true; + } + + @Override + public boolean onOptionsItemSelected(MenuItem item) { + + switch (item.getItemId()) { + case R.id.viewGithub: { + Intent i = new Intent(Intent.ACTION_VIEW); + i.setData(Uri.parse("https://github.com/PhilJay/MPAndroidChart/blob/master/MPChartExample/src/com/xxmassdeveloper/mpchartexample/InvertedLineChartActivity.java")); + startActivity(i); + break; + } + case R.id.actionToggleValues: { + List<ILineDataSet> sets = chart.getData() + .getDataSets(); + + for (ILineDataSet iSet : sets) { + + LineDataSet set = (LineDataSet) iSet; + set.setDrawValues(!set.isDrawValuesEnabled()); + } + + chart.invalidate(); + break; + } + case R.id.actionToggleHighlight: { + if(chart.getData() != null) { + chart.getData().setHighlightEnabled(!chart.getData().isHighlightEnabled()); + chart.invalidate(); + } + break; + } + case R.id.actionToggleFilled: { + + List<ILineDataSet> sets = chart.getData() + .getDataSets(); + + for (ILineDataSet iSet : sets) { + + LineDataSet set = (LineDataSet) iSet; + if (set.isDrawFilledEnabled()) + set.setDrawFilled(false); + else + set.setDrawFilled(true); + } + chart.invalidate(); + break; + } + case R.id.actionToggleCircles: { + List<ILineDataSet> sets = chart.getData() + .getDataSets(); + + for (ILineDataSet iSet : sets) { + + LineDataSet set = (LineDataSet) iSet; + if (set.isDrawCirclesEnabled()) + set.setDrawCircles(false); + else + set.setDrawCircles(true); + } + chart.invalidate(); + break; + } + case R.id.animateX: { + chart.animateX(2000); + break; + } + case R.id.animateY: { + chart.animateY(2000); + break; + } + case R.id.animateXY: { + + chart.animateXY(2000, 2000); + break; + } + case R.id.actionTogglePinch: { + if (chart.isPinchZoomEnabled()) + chart.setPinchZoom(false); + else + chart.setPinchZoom(true); + + chart.invalidate(); + break; + } + case R.id.actionToggleAutoScaleMinMax: { + chart.setAutoScaleMinMaxEnabled(!chart.isAutoScaleMinMaxEnabled()); + chart.notifyDataSetChanged(); + break; + } + case R.id.actionSave: { + if (ContextCompat.checkSelfPermission(this, Manifest.permission.WRITE_EXTERNAL_STORAGE) == PackageManager.PERMISSION_GRANTED) { + saveToGallery(); + } else { + requestStoragePermission(chart); + } + break; + } + } + return true; + } + + @Override + public void onProgressChanged(SeekBar seekBar, int progress, boolean fromUser) { + + tvX.setText(String.valueOf(seekBarX.getProgress())); + tvY.setText(String.valueOf(seekBarY.getProgress())); + + setData(seekBarX.getProgress(), seekBarY.getProgress()); + + // redraw + chart.invalidate(); + } + + @Override + protected void saveToGallery() { + saveToGallery(chart, "InvertedLineChartActivity"); + } + + @Override + public void onValueSelected(Entry e, Highlight h) { + Log.i("VAL SELECTED", + "Value: " + e.getY() + ", xIndex: " + e.getX() + + ", DataSet index: " + h.getDataSetIndex()); + } + + @Override + public void onNothingSelected() {} + + @Override + public void onStartTrackingTouch(SeekBar seekBar) {} + + @Override + public void onStopTrackingTouch(SeekBar seekBar) {} +} diff --git a/MPChartExample/src/main/java/com/xxmassdeveloper/mpchartexample/LineChartActivity1.java b/MPChartExample/src/main/java/com/xxmassdeveloper/mpchartexample/LineChartActivity1.java new file mode 100644 index 00000000..dd43b056 --- /dev/null +++ b/MPChartExample/src/main/java/com/xxmassdeveloper/mpchartexample/LineChartActivity1.java @@ -0,0 +1,454 @@ + +package com.xxmassdeveloper.mpchartexample; + +import android.Manifest; +import android.content.Intent; +import android.content.pm.PackageManager; +import android.graphics.Color; +import android.graphics.DashPathEffect; +import android.graphics.drawable.Drawable; +import android.net.Uri; +import android.os.Bundle; +import androidx.core.content.ContextCompat; +import android.util.Log; +import android.view.Menu; +import android.view.MenuItem; +import android.view.WindowManager; +import android.widget.SeekBar; +import android.widget.SeekBar.OnSeekBarChangeListener; +import android.widget.TextView; + +import com.github.mikephil.charting.animation.Easing; +import com.github.mikephil.charting.charts.LineChart; +import com.github.mikephil.charting.components.Legend; +import com.github.mikephil.charting.components.Legend.LegendForm; +import com.github.mikephil.charting.components.LimitLine; +import com.github.mikephil.charting.components.LimitLine.LimitLabelPosition; +import com.github.mikephil.charting.components.XAxis; +import com.github.mikephil.charting.components.YAxis; +import com.github.mikephil.charting.data.Entry; +import com.github.mikephil.charting.data.LineData; +import com.github.mikephil.charting.data.LineDataSet; +import com.github.mikephil.charting.formatter.IFillFormatter; +import com.github.mikephil.charting.highlight.Highlight; +import com.github.mikephil.charting.interfaces.dataprovider.LineDataProvider; +import com.github.mikephil.charting.interfaces.datasets.ILineDataSet; +import com.github.mikephil.charting.listener.OnChartValueSelectedListener; +import com.github.mikephil.charting.utils.Utils; +import com.xxmassdeveloper.mpchartexample.custom.MyMarkerView; +import com.xxmassdeveloper.mpchartexample.notimportant.DemoBase; + +import java.util.ArrayList; +import java.util.List; + +/** + * Example of a heavily customized {@link LineChart} with limit lines, custom line shapes, etc. + * + * @since 1.7.4 + * @version 3.1.0 + */ +public class LineChartActivity1 extends DemoBase implements OnSeekBarChangeListener, + OnChartValueSelectedListener { + + private LineChart chart; + private SeekBar seekBarX, seekBarY; + private TextView tvX, tvY; + + @Override + protected void onCreate(Bundle savedInstanceState) { + super.onCreate(savedInstanceState); + getWindow().setFlags(WindowManager.LayoutParams.FLAG_FULLSCREEN, + WindowManager.LayoutParams.FLAG_FULLSCREEN); + setContentView(R.layout.activity_linechart); + + setTitle("LineChartActivity1"); + + tvX = findViewById(R.id.tvXMax); + tvY = findViewById(R.id.tvYMax); + + seekBarX = findViewById(R.id.seekBar1); + seekBarX.setOnSeekBarChangeListener(this); + + seekBarY = findViewById(R.id.seekBar2); + seekBarY.setMax(180); + seekBarY.setOnSeekBarChangeListener(this); + + + { // // Chart Style // // + chart = findViewById(R.id.chart1); + + // background color + chart.setBackgroundColor(Color.WHITE); + + // disable description text + chart.getDescription().setEnabled(false); + + // enable touch gestures + chart.setTouchEnabled(true); + + // set listeners + chart.setOnChartValueSelectedListener(this); + chart.setDrawGridBackground(false); + + // create marker to display box when values are selected + MyMarkerView mv = new MyMarkerView(this, R.layout.custom_marker_view); + + // Set the marker to the chart + mv.setChartView(chart); + chart.setMarker(mv); + + // enable scaling and dragging + chart.setDragEnabled(true); + chart.setScaleEnabled(true); + // chart.setScaleXEnabled(true); + // chart.setScaleYEnabled(true); + + // force pinch zoom along both axis + chart.setPinchZoom(true); + } + + XAxis xAxis; + { // // X-Axis Style // // + xAxis = chart.getXAxis(); + + // vertical grid lines + xAxis.enableGridDashedLine(10f, 10f, 0f); + } + + YAxis yAxis; + { // // Y-Axis Style // // + yAxis = chart.getAxisLeft(); + + // disable dual axis (only use LEFT axis) + chart.getAxisRight().setEnabled(false); + + // horizontal grid lines + yAxis.enableGridDashedLine(10f, 10f, 0f); + + // axis range + yAxis.setAxisMaximum(200f); + yAxis.setAxisMinimum(-50f); + } + + + { // // Create Limit Lines // // + LimitLine llXAxis = new LimitLine(9f, "Index 10"); + llXAxis.setLineWidth(4f); + llXAxis.enableDashedLine(10f, 10f, 0f); + llXAxis.setLabelPosition(LimitLabelPosition.RIGHT_BOTTOM); + llXAxis.setTextSize(10f); + llXAxis.setTypeface(tfRegular); + + LimitLine ll1 = new LimitLine(150f, "Upper Limit"); + ll1.setLineWidth(4f); + ll1.enableDashedLine(10f, 10f, 0f); + ll1.setLabelPosition(LimitLabelPosition.RIGHT_TOP); + ll1.setTextSize(10f); + ll1.setTypeface(tfRegular); + + LimitLine ll2 = new LimitLine(-30f, "Lower Limit"); + ll2.setLineWidth(4f); + ll2.enableDashedLine(10f, 10f, 0f); + ll2.setLabelPosition(LimitLabelPosition.RIGHT_BOTTOM); + ll2.setTextSize(10f); + ll2.setTypeface(tfRegular); + + // draw limit lines behind data instead of on top + yAxis.setDrawLimitLinesBehindData(true); + xAxis.setDrawLimitLinesBehindData(true); + + // add limit lines + yAxis.addLimitLine(ll1); + yAxis.addLimitLine(ll2); + //xAxis.addLimitLine(llXAxis); + } + + // add data + seekBarX.setProgress(45); + seekBarY.setProgress(180); + setData(45, 180); + + // draw points over time + chart.animateX(1500); + + // get the legend (only possible after setting data) + Legend l = chart.getLegend(); + + // draw legend entries as lines + l.setForm(LegendForm.LINE); + } + + private void setData(int count, float range) { + + ArrayList<Entry> values = new ArrayList<>(); + + for (int i = 0; i < count; i++) { + + float val = (float) (Math.random() * range) - 30; + values.add(new Entry(i, val, getResources().getDrawable(R.drawable.star))); + } + + LineDataSet set1; + + if (chart.getData() != null && + chart.getData().getDataSetCount() > 0) { + set1 = (LineDataSet) chart.getData().getDataSetByIndex(0); + set1.setValues(values); + set1.notifyDataSetChanged(); + chart.getData().notifyDataChanged(); + chart.notifyDataSetChanged(); + } else { + // create a dataset and give it a type + set1 = new LineDataSet(values, "DataSet 1"); + + set1.setDrawIcons(false); + + // draw dashed line + set1.enableDashedLine(10f, 5f, 0f); + + // black lines and points + set1.setColor(Color.BLACK); + set1.setCircleColor(Color.BLACK); + + // line thickness and point size + set1.setLineWidth(1f); + set1.setCircleRadius(3f); + + // draw points as solid circles + set1.setDrawCircleHole(false); + + // customize legend entry + set1.setFormLineWidth(1f); + set1.setFormLineDashEffect(new DashPathEffect(new float[]{10f, 5f}, 0f)); + set1.setFormSize(15.f); + + // text size of values + set1.setValueTextSize(9f); + + // draw selection line as dashed + set1.enableDashedHighlightLine(10f, 5f, 0f); + + // set the filled area + set1.setDrawFilled(true); + set1.setFillFormatter(new IFillFormatter() { + @Override + public float getFillLinePosition(ILineDataSet dataSet, LineDataProvider dataProvider) { + return chart.getAxisLeft().getAxisMinimum(); + } + }); + + // set color of filled area + if (Utils.getSDKInt() >= 18) { + // drawables only supported on api level 18 and above + Drawable drawable = ContextCompat.getDrawable(this, R.drawable.fade_red); + set1.setFillDrawable(drawable); + } else { + set1.setFillColor(Color.BLACK); + } + + ArrayList<ILineDataSet> dataSets = new ArrayList<>(); + dataSets.add(set1); // add the data sets + + // create a data object with the data sets + LineData data = new LineData(dataSets); + + // set data + chart.setData(data); + } + } + + @Override + public boolean onCreateOptionsMenu(Menu menu) { + getMenuInflater().inflate(R.menu.line, menu); + return true; + } + + @Override + public boolean onOptionsItemSelected(MenuItem item) { + + switch (item.getItemId()) { + case R.id.viewGithub: { + Intent i = new Intent(Intent.ACTION_VIEW); + i.setData(Uri.parse("https://github.com/PhilJay/MPAndroidChart/blob/master/MPChartExample/src/com/xxmassdeveloper/mpchartexample/LineChartActivity1.java")); + startActivity(i); + break; + } + case R.id.actionToggleValues: { + List<ILineDataSet> sets = chart.getData() + .getDataSets(); + + for (ILineDataSet iSet : sets) { + + LineDataSet set = (LineDataSet) iSet; + set.setDrawValues(!set.isDrawValuesEnabled()); + } + + chart.invalidate(); + break; + } + case R.id.actionToggleIcons: { + List<ILineDataSet> sets = chart.getData() + .getDataSets(); + + for (ILineDataSet iSet : sets) { + + LineDataSet set = (LineDataSet) iSet; + set.setDrawIcons(!set.isDrawIconsEnabled()); + } + + chart.invalidate(); + break; + } + case R.id.actionToggleHighlight: { + if(chart.getData() != null) { + chart.getData().setHighlightEnabled(!chart.getData().isHighlightEnabled()); + chart.invalidate(); + } + break; + } + case R.id.actionToggleFilled: { + + List<ILineDataSet> sets = chart.getData() + .getDataSets(); + + for (ILineDataSet iSet : sets) { + + LineDataSet set = (LineDataSet) iSet; + if (set.isDrawFilledEnabled()) + set.setDrawFilled(false); + else + set.setDrawFilled(true); + } + chart.invalidate(); + break; + } + case R.id.actionToggleCircles: { + List<ILineDataSet> sets = chart.getData() + .getDataSets(); + + for (ILineDataSet iSet : sets) { + + LineDataSet set = (LineDataSet) iSet; + if (set.isDrawCirclesEnabled()) + set.setDrawCircles(false); + else + set.setDrawCircles(true); + } + chart.invalidate(); + break; + } + case R.id.actionToggleCubic: { + List<ILineDataSet> sets = chart.getData() + .getDataSets(); + + for (ILineDataSet iSet : sets) { + + LineDataSet set = (LineDataSet) iSet; + set.setMode(set.getMode() == LineDataSet.Mode.CUBIC_BEZIER + ? LineDataSet.Mode.LINEAR + : LineDataSet.Mode.CUBIC_BEZIER); + } + chart.invalidate(); + break; + } + case R.id.actionToggleStepped: { + List<ILineDataSet> sets = chart.getData() + .getDataSets(); + + for (ILineDataSet iSet : sets) { + + LineDataSet set = (LineDataSet) iSet; + set.setMode(set.getMode() == LineDataSet.Mode.STEPPED + ? LineDataSet.Mode.LINEAR + : LineDataSet.Mode.STEPPED); + } + chart.invalidate(); + break; + } + case R.id.actionToggleHorizontalCubic: { + List<ILineDataSet> sets = chart.getData() + .getDataSets(); + + for (ILineDataSet iSet : sets) { + + LineDataSet set = (LineDataSet) iSet; + set.setMode(set.getMode() == LineDataSet.Mode.HORIZONTAL_BEZIER + ? LineDataSet.Mode.LINEAR + : LineDataSet.Mode.HORIZONTAL_BEZIER); + } + chart.invalidate(); + break; + } + case R.id.actionTogglePinch: { + if (chart.isPinchZoomEnabled()) + chart.setPinchZoom(false); + else + chart.setPinchZoom(true); + + chart.invalidate(); + break; + } + case R.id.actionToggleAutoScaleMinMax: { + chart.setAutoScaleMinMaxEnabled(!chart.isAutoScaleMinMaxEnabled()); + chart.notifyDataSetChanged(); + break; + } + case R.id.animateX: { + chart.animateX(2000); + break; + } + case R.id.animateY: { + chart.animateY(2000, Easing.EaseInCubic); + break; + } + case R.id.animateXY: { + chart.animateXY(2000, 2000); + break; + } + case R.id.actionSave: { + if (ContextCompat.checkSelfPermission(this, Manifest.permission.WRITE_EXTERNAL_STORAGE) == PackageManager.PERMISSION_GRANTED) { + saveToGallery(); + } else { + requestStoragePermission(chart); + } + break; + } + } + return true; + } + + @Override + public void onProgressChanged(SeekBar seekBar, int progress, boolean fromUser) { + + tvX.setText(String.valueOf(seekBarX.getProgress())); + tvY.setText(String.valueOf(seekBarY.getProgress())); + + setData(seekBarX.getProgress(), seekBarY.getProgress()); + + // redraw + chart.invalidate(); + } + + @Override + protected void saveToGallery() { + saveToGallery(chart, "LineChartActivity1"); + } + + @Override + public void onStartTrackingTouch(SeekBar seekBar) {} + + @Override + public void onStopTrackingTouch(SeekBar seekBar) {} + + @Override + public void onValueSelected(Entry e, Highlight h) { + Log.i("Entry selected", e.toString()); + Log.i("LOW HIGH", "low: " + chart.getLowestVisibleX() + ", high: " + chart.getHighestVisibleX()); + Log.i("MIN MAX", "xMin: " + chart.getXChartMin() + ", xMax: " + chart.getXChartMax() + ", yMin: " + chart.getYChartMin() + ", yMax: " + chart.getYChartMax()); + } + + @Override + public void onNothingSelected() { + Log.i("Nothing selected", "Nothing selected."); + } +} diff --git a/MPChartExample/src/main/java/com/xxmassdeveloper/mpchartexample/LineChartActivity2.java b/MPChartExample/src/main/java/com/xxmassdeveloper/mpchartexample/LineChartActivity2.java new file mode 100644 index 00000000..6b9cbb5f --- /dev/null +++ b/MPChartExample/src/main/java/com/xxmassdeveloper/mpchartexample/LineChartActivity2.java @@ -0,0 +1,409 @@ + +package com.xxmassdeveloper.mpchartexample; + +import android.Manifest; +import android.content.Intent; +import android.content.pm.PackageManager; +import android.graphics.Color; +import android.net.Uri; +import android.os.Bundle; +import androidx.core.content.ContextCompat; +import android.util.Log; +import android.view.Menu; +import android.view.MenuItem; +import android.view.WindowManager; +import android.widget.SeekBar; +import android.widget.SeekBar.OnSeekBarChangeListener; +import android.widget.TextView; + +import com.github.mikephil.charting.charts.LineChart; +import com.github.mikephil.charting.components.Legend; +import com.github.mikephil.charting.components.Legend.LegendForm; +import com.github.mikephil.charting.components.XAxis; +import com.github.mikephil.charting.components.YAxis; +import com.github.mikephil.charting.components.YAxis.AxisDependency; +import com.github.mikephil.charting.data.Entry; +import com.github.mikephil.charting.data.LineData; +import com.github.mikephil.charting.data.LineDataSet; +import com.github.mikephil.charting.highlight.Highlight; +import com.github.mikephil.charting.interfaces.datasets.ILineDataSet; +import com.github.mikephil.charting.listener.OnChartValueSelectedListener; +import com.github.mikephil.charting.utils.ColorTemplate; +import com.xxmassdeveloper.mpchartexample.notimportant.DemoBase; + +import java.util.ArrayList; +import java.util.List; + +/** + * Example of a dual axis {@link LineChart} with multiple data sets. + * + * @since 1.7.4 + * @version 3.1.0 + */ +public class LineChartActivity2 extends DemoBase implements OnSeekBarChangeListener, + OnChartValueSelectedListener { + + private LineChart chart; + private SeekBar seekBarX, seekBarY; + private TextView tvX, tvY; + + @Override + protected void onCreate(Bundle savedInstanceState) { + super.onCreate(savedInstanceState); + getWindow().setFlags(WindowManager.LayoutParams.FLAG_FULLSCREEN, + WindowManager.LayoutParams.FLAG_FULLSCREEN); + setContentView(R.layout.activity_linechart); + + setTitle("LineChartActivity2"); + + tvX = findViewById(R.id.tvXMax); + tvY = findViewById(R.id.tvYMax); + + seekBarX = findViewById(R.id.seekBar1); + seekBarX.setOnSeekBarChangeListener(this); + + seekBarY = findViewById(R.id.seekBar2); + seekBarY.setOnSeekBarChangeListener(this); + + chart = findViewById(R.id.chart1); + chart.setOnChartValueSelectedListener(this); + + // no description text + chart.getDescription().setEnabled(false); + + // enable touch gestures + chart.setTouchEnabled(true); + + chart.setDragDecelerationFrictionCoef(0.9f); + + // enable scaling and dragging + chart.setDragEnabled(true); + chart.setScaleEnabled(true); + chart.setDrawGridBackground(false); + chart.setHighlightPerDragEnabled(true); + + // if disabled, scaling can be done on x- and y-axis separately + chart.setPinchZoom(true); + + // set an alternative background color + chart.setBackgroundColor(Color.LTGRAY); + + // add data + seekBarX.setProgress(20); + seekBarY.setProgress(30); + + chart.animateX(1500); + + // get the legend (only possible after setting data) + Legend l = chart.getLegend(); + + // modify the legend ... + l.setForm(LegendForm.LINE); + l.setTypeface(tfLight); + l.setTextSize(11f); + l.setTextColor(Color.WHITE); + l.setVerticalAlignment(Legend.LegendVerticalAlignment.BOTTOM); + l.setHorizontalAlignment(Legend.LegendHorizontalAlignment.LEFT); + l.setOrientation(Legend.LegendOrientation.HORIZONTAL); + l.setDrawInside(false); +// l.setYOffset(11f); + + XAxis xAxis = chart.getXAxis(); + xAxis.setTypeface(tfLight); + xAxis.setTextSize(11f); + xAxis.setTextColor(Color.WHITE); + xAxis.setDrawGridLines(false); + xAxis.setDrawAxisLine(false); + + YAxis leftAxis = chart.getAxisLeft(); + leftAxis.setTypeface(tfLight); + leftAxis.setTextColor(ColorTemplate.getHoloBlue()); + leftAxis.setAxisMaximum(200f); + leftAxis.setAxisMinimum(0f); + leftAxis.setDrawGridLines(true); + leftAxis.setGranularityEnabled(true); + + YAxis rightAxis = chart.getAxisRight(); + rightAxis.setTypeface(tfLight); + rightAxis.setTextColor(Color.RED); + rightAxis.setAxisMaximum(900); + rightAxis.setAxisMinimum(-200); + rightAxis.setDrawGridLines(false); + rightAxis.setDrawZeroLine(false); + rightAxis.setGranularityEnabled(false); + } + + private void setData(int count, float range) { + + ArrayList<Entry> values1 = new ArrayList<>(); + + for (int i = 0; i < count; i++) { + float val = (float) (Math.random() * (range / 2f)) + 50; + values1.add(new Entry(i, val)); + } + + ArrayList<Entry> values2 = new ArrayList<>(); + + for (int i = 0; i < count; i++) { + float val = (float) (Math.random() * range) + 450; + values2.add(new Entry(i, val)); + } + + ArrayList<Entry> values3 = new ArrayList<>(); + + for (int i = 0; i < count; i++) { + float val = (float) (Math.random() * range) + 500; + values3.add(new Entry(i, val)); + } + + LineDataSet set1, set2, set3; + + if (chart.getData() != null && + chart.getData().getDataSetCount() > 0) { + set1 = (LineDataSet) chart.getData().getDataSetByIndex(0); + set2 = (LineDataSet) chart.getData().getDataSetByIndex(1); + set3 = (LineDataSet) chart.getData().getDataSetByIndex(2); + set1.setValues(values1); + set2.setValues(values2); + set3.setValues(values3); + chart.getData().notifyDataChanged(); + chart.notifyDataSetChanged(); + } else { + // create a dataset and give it a type + set1 = new LineDataSet(values1, "DataSet 1"); + + set1.setAxisDependency(AxisDependency.LEFT); + set1.setColor(ColorTemplate.getHoloBlue()); + set1.setCircleColor(Color.WHITE); + set1.setLineWidth(2f); + set1.setCircleRadius(3f); + set1.setFillAlpha(65); + set1.setFillColor(ColorTemplate.getHoloBlue()); + set1.setHighLightColor(Color.rgb(244, 117, 117)); + set1.setDrawCircleHole(false); + //set1.setFillFormatter(new MyFillFormatter(0f)); + //set1.setDrawHorizontalHighlightIndicator(false); + //set1.setVisible(false); + //set1.setCircleHoleColor(Color.WHITE); + + // create a dataset and give it a type + set2 = new LineDataSet(values2, "DataSet 2"); + set2.setAxisDependency(AxisDependency.RIGHT); + set2.setColor(Color.RED); + set2.setCircleColor(Color.WHITE); + set2.setLineWidth(2f); + set2.setCircleRadius(3f); + set2.setFillAlpha(65); + set2.setFillColor(Color.RED); + set2.setDrawCircleHole(false); + set2.setHighLightColor(Color.rgb(244, 117, 117)); + //set2.setFillFormatter(new MyFillFormatter(900f)); + + set3 = new LineDataSet(values3, "DataSet 3"); + set3.setAxisDependency(AxisDependency.RIGHT); + set3.setColor(Color.YELLOW); + set3.setCircleColor(Color.WHITE); + set3.setLineWidth(2f); + set3.setCircleRadius(3f); + set3.setFillAlpha(65); + set3.setFillColor(ColorTemplate.colorWithAlpha(Color.YELLOW, 200)); + set3.setDrawCircleHole(false); + set3.setHighLightColor(Color.rgb(244, 117, 117)); + + // create a data object with the data sets + LineData data = new LineData(set1, set2, set3); + data.setValueTextColor(Color.WHITE); + data.setValueTextSize(9f); + + // set data + chart.setData(data); + } + } + + @Override + public boolean onCreateOptionsMenu(Menu menu) { + getMenuInflater().inflate(R.menu.line, menu); + return true; + } + + @Override + public boolean onOptionsItemSelected(MenuItem item) { + + switch (item.getItemId()) { + case R.id.viewGithub: { + Intent i = new Intent(Intent.ACTION_VIEW); + i.setData(Uri.parse("https://github.com/PhilJay/MPAndroidChart/blob/master/MPChartExample/src/com/xxmassdeveloper/mpchartexample/LineChartActivity2.java")); + startActivity(i); + break; + } + case R.id.actionToggleValues: { + List<ILineDataSet> sets = chart.getData() + .getDataSets(); + + for (ILineDataSet iSet : sets) { + + LineDataSet set = (LineDataSet) iSet; + set.setDrawValues(!set.isDrawValuesEnabled()); + } + + chart.invalidate(); + break; + } + case R.id.actionToggleHighlight: { + if (chart.getData() != null) { + chart.getData().setHighlightEnabled(!chart.getData().isHighlightEnabled()); + chart.invalidate(); + } + break; + } + case R.id.actionToggleFilled: { + + List<ILineDataSet> sets = chart.getData() + .getDataSets(); + + for (ILineDataSet iSet : sets) { + + LineDataSet set = (LineDataSet) iSet; + if (set.isDrawFilledEnabled()) + set.setDrawFilled(false); + else + set.setDrawFilled(true); + } + chart.invalidate(); + break; + } + case R.id.actionToggleCircles: { + List<ILineDataSet> sets = chart.getData() + .getDataSets(); + + for (ILineDataSet iSet : sets) { + + LineDataSet set = (LineDataSet) iSet; + if (set.isDrawCirclesEnabled()) + set.setDrawCircles(false); + else + set.setDrawCircles(true); + } + chart.invalidate(); + break; + } + case R.id.actionToggleCubic: { + List<ILineDataSet> sets = chart.getData() + .getDataSets(); + + for (ILineDataSet iSet : sets) { + + LineDataSet set = (LineDataSet) iSet; + set.setMode(set.getMode() == LineDataSet.Mode.CUBIC_BEZIER + ? LineDataSet.Mode.LINEAR + : LineDataSet.Mode.CUBIC_BEZIER); + } + chart.invalidate(); + break; + } + case R.id.actionToggleStepped: { + List<ILineDataSet> sets = chart.getData() + .getDataSets(); + + for (ILineDataSet iSet : sets) { + + LineDataSet set = (LineDataSet) iSet; + set.setMode(set.getMode() == LineDataSet.Mode.STEPPED + ? LineDataSet.Mode.LINEAR + : LineDataSet.Mode.STEPPED); + } + chart.invalidate(); + break; + } + case R.id.actionToggleHorizontalCubic: { + List<ILineDataSet> sets = chart.getData() + .getDataSets(); + + for (ILineDataSet iSet : sets) { + + LineDataSet set = (LineDataSet) iSet; + set.setMode(set.getMode() == LineDataSet.Mode.HORIZONTAL_BEZIER + ? LineDataSet.Mode.LINEAR + : LineDataSet.Mode.HORIZONTAL_BEZIER); + } + chart.invalidate(); + break; + } + case R.id.actionTogglePinch: { + if (chart.isPinchZoomEnabled()) + chart.setPinchZoom(false); + else + chart.setPinchZoom(true); + + chart.invalidate(); + break; + } + case R.id.actionToggleAutoScaleMinMax: { + chart.setAutoScaleMinMaxEnabled(!chart.isAutoScaleMinMaxEnabled()); + chart.notifyDataSetChanged(); + break; + } + case R.id.animateX: { + chart.animateX(2000); + break; + } + case R.id.animateY: { + chart.animateY(2000); + break; + } + case R.id.animateXY: { + chart.animateXY(2000, 2000); + break; + } + case R.id.actionSave: { + if (ContextCompat.checkSelfPermission(this, Manifest.permission.WRITE_EXTERNAL_STORAGE) == PackageManager.PERMISSION_GRANTED) { + saveToGallery(); + } else { + requestStoragePermission(chart); + } + break; + } + } + return true; + } + + @Override + public void onProgressChanged(SeekBar seekBar, int progress, boolean fromUser) { + + tvX.setText(String.valueOf(seekBarX.getProgress())); + tvY.setText(String.valueOf(seekBarY.getProgress())); + + setData(seekBarX.getProgress(), seekBarY.getProgress()); + + // redraw + chart.invalidate(); + } + + @Override + protected void saveToGallery() { + saveToGallery(chart, "LineChartActivity2"); + } + + @Override + public void onValueSelected(Entry e, Highlight h) { + Log.i("Entry selected", e.toString()); + + chart.centerViewToAnimated(e.getX(), e.getY(), chart.getData().getDataSetByIndex(h.getDataSetIndex()) + .getAxisDependency(), 500); + //chart.zoomAndCenterAnimated(2.5f, 2.5f, e.getX(), e.getY(), chart.getData().getDataSetByIndex(dataSetIndex) + // .getAxisDependency(), 1000); + //chart.zoomAndCenterAnimated(1.8f, 1.8f, e.getX(), e.getY(), chart.getData().getDataSetByIndex(dataSetIndex) + // .getAxisDependency(), 1000); + } + + @Override + public void onNothingSelected() { + Log.i("Nothing selected", "Nothing selected."); + } + + @Override + public void onStartTrackingTouch(SeekBar seekBar) {} + + @Override + public void onStopTrackingTouch(SeekBar seekBar) {} +} diff --git a/MPChartExample/src/main/java/com/xxmassdeveloper/mpchartexample/LineChartActivityColored.java b/MPChartExample/src/main/java/com/xxmassdeveloper/mpchartexample/LineChartActivityColored.java new file mode 100644 index 00000000..6a12e8f9 --- /dev/null +++ b/MPChartExample/src/main/java/com/xxmassdeveloper/mpchartexample/LineChartActivityColored.java @@ -0,0 +1,155 @@ + +package com.xxmassdeveloper.mpchartexample; + +import android.content.Intent; +import android.graphics.Color; +import android.graphics.Typeface; +import android.net.Uri; +import android.os.Bundle; +import android.view.Menu; +import android.view.MenuItem; +import android.view.WindowManager; + +import com.github.mikephil.charting.charts.LineChart; +import com.github.mikephil.charting.components.Legend; +import com.github.mikephil.charting.data.Entry; +import com.github.mikephil.charting.data.LineData; +import com.github.mikephil.charting.data.LineDataSet; +import com.xxmassdeveloper.mpchartexample.notimportant.DemoBase; + +import java.util.ArrayList; + +@SuppressWarnings("SameParameterValue") +public class LineChartActivityColored extends DemoBase { + + private final LineChart[] charts = new LineChart[4]; + + @Override + protected void onCreate(Bundle savedInstanceState) { + super.onCreate(savedInstanceState); + getWindow().setFlags(WindowManager.LayoutParams.FLAG_FULLSCREEN, + WindowManager.LayoutParams.FLAG_FULLSCREEN); + setContentView(R.layout.activity_colored_lines); + + setTitle("LineChartActivityColored"); + + charts[0] = findViewById(R.id.chart1); + charts[1] = findViewById(R.id.chart2); + charts[2] = findViewById(R.id.chart3); + charts[3] = findViewById(R.id.chart4); + + Typeface mTf = Typeface.createFromAsset(getAssets(), "OpenSans-Bold.ttf"); + + for (int i = 0; i < charts.length; i++) { + + LineData data = getData(36, 100); + data.setValueTypeface(mTf); + + // add some transparency to the color with "& 0x90FFFFFF" + setupChart(charts[i], data, colors[i % colors.length]); + } + } + + private final int[] colors = new int[] { + Color.rgb(137, 230, 81), + Color.rgb(240, 240, 30), + Color.rgb(89, 199, 250), + Color.rgb(250, 104, 104) + }; + + private void setupChart(LineChart chart, LineData data, int color) { + + ((LineDataSet) data.getDataSetByIndex(0)).setCircleHoleColor(color); + + // no description text + chart.getDescription().setEnabled(false); + + // chart.setDrawHorizontalGrid(false); + // + // enable / disable grid background + chart.setDrawGridBackground(false); +// chart.getRenderer().getGridPaint().setGridColor(Color.WHITE & 0x70FFFFFF); + + // enable touch gestures + chart.setTouchEnabled(true); + + // enable scaling and dragging + chart.setDragEnabled(true); + chart.setScaleEnabled(true); + + // if disabled, scaling can be done on x- and y-axis separately + chart.setPinchZoom(false); + + chart.setBackgroundColor(color); + + // set custom chart offsets (automatic offset calculation is hereby disabled) + chart.setViewPortOffsets(10, 0, 10, 0); + + // add data + chart.setData(data); + + // get the legend (only possible after setting data) + Legend l = chart.getLegend(); + l.setEnabled(false); + + chart.getAxisLeft().setEnabled(false); + chart.getAxisLeft().setSpaceTop(40); + chart.getAxisLeft().setSpaceBottom(40); + chart.getAxisRight().setEnabled(false); + + chart.getXAxis().setEnabled(false); + + // animate calls invalidate()... + chart.animateX(2500); + } + + private LineData getData(int count, float range) { + + ArrayList<Entry> values = new ArrayList<>(); + + for (int i = 0; i < count; i++) { + float val = (float) (Math.random() * range) + 3; + values.add(new Entry(i, val)); + } + + // create a dataset and give it a type + LineDataSet set1 = new LineDataSet(values, "DataSet 1"); + // set1.setFillAlpha(110); + // set1.setFillColor(Color.RED); + + set1.setLineWidth(1.75f); + set1.setCircleRadius(5f); + set1.setCircleHoleRadius(2.5f); + set1.setColor(Color.WHITE); + set1.setCircleColor(Color.WHITE); + set1.setHighLightColor(Color.WHITE); + set1.setDrawValues(false); + + // create a data object with the data sets + return new LineData(set1); + } + + @Override + public boolean onCreateOptionsMenu(Menu menu) { + getMenuInflater().inflate(R.menu.only_github, menu); + return true; + } + + @Override + public boolean onOptionsItemSelected(MenuItem item) { + + switch (item.getItemId()) { + case R.id.viewGithub: { + Intent i = new Intent(Intent.ACTION_VIEW); + i.setData(Uri.parse("https://github.com/PhilJay/MPAndroidChart/blob/master/MPChartExample/src/com/xxmassdeveloper/mpchartexample/LineChartActivityColored.java")); + startActivity(i); + break; + } + } + + return true; + } + + @Override + public void saveToGallery() { /* Intentionally left empty */ } +} diff --git a/MPChartExample/src/main/java/com/xxmassdeveloper/mpchartexample/LineChartTime.java b/MPChartExample/src/main/java/com/xxmassdeveloper/mpchartexample/LineChartTime.java new file mode 100644 index 00000000..212b90ff --- /dev/null +++ b/MPChartExample/src/main/java/com/xxmassdeveloper/mpchartexample/LineChartTime.java @@ -0,0 +1,318 @@ + +package com.xxmassdeveloper.mpchartexample; + +import android.Manifest; +import android.content.Intent; +import android.content.pm.PackageManager; +import android.graphics.Color; +import android.net.Uri; +import android.os.Bundle; +import androidx.core.content.ContextCompat; +import android.view.Menu; +import android.view.MenuItem; +import android.view.WindowManager; +import android.widget.SeekBar; +import android.widget.SeekBar.OnSeekBarChangeListener; +import android.widget.TextView; + +import com.github.mikephil.charting.charts.LineChart; +import com.github.mikephil.charting.components.AxisBase; +import com.github.mikephil.charting.components.Legend; +import com.github.mikephil.charting.components.XAxis; +import com.github.mikephil.charting.components.YAxis; +import com.github.mikephil.charting.components.YAxis.AxisDependency; +import com.github.mikephil.charting.data.Entry; +import com.github.mikephil.charting.data.LineData; +import com.github.mikephil.charting.data.LineDataSet; +import com.github.mikephil.charting.formatter.IAxisValueFormatter; +import com.github.mikephil.charting.interfaces.datasets.ILineDataSet; +import com.github.mikephil.charting.utils.ColorTemplate; +import com.xxmassdeveloper.mpchartexample.notimportant.DemoBase; + +import java.text.SimpleDateFormat; +import java.util.ArrayList; +import java.util.Date; +import java.util.List; +import java.util.Locale; +import java.util.concurrent.TimeUnit; + +public class LineChartTime extends DemoBase implements OnSeekBarChangeListener { + + private LineChart chart; + private SeekBar seekBarX; + private TextView tvX; + + @Override + protected void onCreate(Bundle savedInstanceState) { + super.onCreate(savedInstanceState); + getWindow().setFlags(WindowManager.LayoutParams.FLAG_FULLSCREEN, + WindowManager.LayoutParams.FLAG_FULLSCREEN); + setContentView(R.layout.activity_linechart_time); + + setTitle("LineChartTime"); + + tvX = findViewById(R.id.tvXMax); + seekBarX = findViewById(R.id.seekBar1); + seekBarX.setOnSeekBarChangeListener(this); + + chart = findViewById(R.id.chart1); + + // no description text + chart.getDescription().setEnabled(false); + + // enable touch gestures + chart.setTouchEnabled(true); + + chart.setDragDecelerationFrictionCoef(0.9f); + + // enable scaling and dragging + chart.setDragEnabled(true); + chart.setScaleEnabled(true); + chart.setDrawGridBackground(false); + chart.setHighlightPerDragEnabled(true); + + // set an alternative background color + chart.setBackgroundColor(Color.WHITE); + chart.setViewPortOffsets(0f, 0f, 0f, 0f); + + // add data + seekBarX.setProgress(100); + + // get the legend (only possible after setting data) + Legend l = chart.getLegend(); + l.setEnabled(false); + + XAxis xAxis = chart.getXAxis(); + xAxis.setPosition(XAxis.XAxisPosition.TOP_INSIDE); + xAxis.setTypeface(tfLight); + xAxis.setTextSize(10f); + xAxis.setTextColor(Color.WHITE); + xAxis.setDrawAxisLine(false); + xAxis.setDrawGridLines(true); + xAxis.setTextColor(Color.rgb(255, 192, 56)); + xAxis.setCenterAxisLabels(true); + xAxis.setGranularity(1f); // one hour + xAxis.setValueFormatter(new IAxisValueFormatter() { + + private final SimpleDateFormat mFormat = new SimpleDateFormat("dd MMM HH:mm", Locale.ENGLISH); + + @Override + public String getFormattedValue(float value, AxisBase axis) { + + long millis = TimeUnit.HOURS.toMillis((long) value); + return mFormat.format(new Date(millis)); + } + }); + + YAxis leftAxis = chart.getAxisLeft(); + leftAxis.setPosition(YAxis.YAxisLabelPosition.INSIDE_CHART); + leftAxis.setTypeface(tfLight); + leftAxis.setTextColor(ColorTemplate.getHoloBlue()); + leftAxis.setDrawGridLines(true); + leftAxis.setGranularityEnabled(true); + leftAxis.setAxisMinimum(0f); + leftAxis.setAxisMaximum(170f); + leftAxis.setYOffset(-9f); + leftAxis.setTextColor(Color.rgb(255, 192, 56)); + + YAxis rightAxis = chart.getAxisRight(); + rightAxis.setEnabled(false); + } + + private void setData(int count, float range) { + + // now in hours + long now = TimeUnit.MILLISECONDS.toHours(System.currentTimeMillis()); + + ArrayList<Entry> values = new ArrayList<>(); + + // count = hours + float to = now + count; + + // increment by 1 hour + for (float x = now; x < to; x++) { + + float y = getRandom(range, 50); + values.add(new Entry(x, y)); // add one entry per hour + } + + // create a dataset and give it a type + LineDataSet set1 = new LineDataSet(values, "DataSet 1"); + set1.setAxisDependency(AxisDependency.LEFT); + set1.setColor(ColorTemplate.getHoloBlue()); + set1.setValueTextColor(ColorTemplate.getHoloBlue()); + set1.setLineWidth(1.5f); + set1.setDrawCircles(false); + set1.setDrawValues(false); + set1.setFillAlpha(65); + set1.setFillColor(ColorTemplate.getHoloBlue()); + set1.setHighLightColor(Color.rgb(244, 117, 117)); + set1.setDrawCircleHole(false); + + // create a data object with the data sets + LineData data = new LineData(set1); + data.setValueTextColor(Color.WHITE); + data.setValueTextSize(9f); + + // set data + chart.setData(data); + } + + @Override + public boolean onCreateOptionsMenu(Menu menu) { + getMenuInflater().inflate(R.menu.line, menu); + return true; + } + + @Override + public boolean onOptionsItemSelected(MenuItem item) { + + switch (item.getItemId()) { + case R.id.viewGithub: { + Intent i = new Intent(Intent.ACTION_VIEW); + i.setData(Uri.parse("https://github.com/PhilJay/MPAndroidChart/blob/master/MPChartExample/src/com/xxmassdeveloper/mpchartexample/LineChartTime.java")); + startActivity(i); + break; + } + case R.id.actionToggleValues: { + List<ILineDataSet> sets = chart.getData() + .getDataSets(); + + for (ILineDataSet iSet : sets) { + + LineDataSet set = (LineDataSet) iSet; + set.setDrawValues(!set.isDrawValuesEnabled()); + } + + chart.invalidate(); + break; + } + case R.id.actionToggleHighlight: { + if (chart.getData() != null) { + chart.getData().setHighlightEnabled(!chart.getData().isHighlightEnabled()); + chart.invalidate(); + } + break; + } + case R.id.actionToggleFilled: { + + List<ILineDataSet> sets = chart.getData() + .getDataSets(); + + for (ILineDataSet iSet : sets) { + + LineDataSet set = (LineDataSet) iSet; + if (set.isDrawFilledEnabled()) + set.setDrawFilled(false); + else + set.setDrawFilled(true); + } + chart.invalidate(); + break; + } + case R.id.actionToggleCircles: { + List<ILineDataSet> sets = chart.getData() + .getDataSets(); + + for (ILineDataSet iSet : sets) { + + LineDataSet set = (LineDataSet) iSet; + if (set.isDrawCirclesEnabled()) + set.setDrawCircles(false); + else + set.setDrawCircles(true); + } + chart.invalidate(); + break; + } + case R.id.actionToggleCubic: { + List<ILineDataSet> sets = chart.getData() + .getDataSets(); + + for (ILineDataSet iSet : sets) { + + LineDataSet set = (LineDataSet) iSet; + if (set.getMode() == LineDataSet.Mode.CUBIC_BEZIER) + set.setMode(LineDataSet.Mode.LINEAR); + else + set.setMode(LineDataSet.Mode.CUBIC_BEZIER); + } + chart.invalidate(); + break; + } + case R.id.actionToggleStepped: { + List<ILineDataSet> sets = chart.getData() + .getDataSets(); + + for (ILineDataSet iSet : sets) { + + LineDataSet set = (LineDataSet) iSet; + if (set.getMode() == LineDataSet.Mode.STEPPED) + set.setMode(LineDataSet.Mode.LINEAR); + else + set.setMode(LineDataSet.Mode.STEPPED); + } + chart.invalidate(); + break; + } + case R.id.actionTogglePinch: { + if (chart.isPinchZoomEnabled()) + chart.setPinchZoom(false); + else + chart.setPinchZoom(true); + + chart.invalidate(); + break; + } + case R.id.actionToggleAutoScaleMinMax: { + chart.setAutoScaleMinMaxEnabled(!chart.isAutoScaleMinMaxEnabled()); + chart.notifyDataSetChanged(); + break; + } + case R.id.animateX: { + chart.animateX(2000); + break; + } + case R.id.animateY: { + chart.animateY(2000); + break; + } + case R.id.animateXY: { + chart.animateXY(2000, 2000); + break; + } + + case R.id.actionSave: { + if (ContextCompat.checkSelfPermission(this, Manifest.permission.WRITE_EXTERNAL_STORAGE) == PackageManager.PERMISSION_GRANTED) { + saveToGallery(); + } else { + requestStoragePermission(chart); + } + break; + } + } + return true; + } + + @Override + public void onProgressChanged(SeekBar seekBar, int progress, boolean fromUser) { + + tvX.setText(String.valueOf(seekBarX.getProgress())); + + setData(seekBarX.getProgress(), 50); + + // redraw + chart.invalidate(); + } + + @Override + protected void saveToGallery() { + saveToGallery(chart, "LineChartTime"); + } + + @Override + public void onStartTrackingTouch(SeekBar seekBar) {} + + @Override + public void onStopTrackingTouch(SeekBar seekBar) {} +} diff --git a/MPChartExample/src/main/java/com/xxmassdeveloper/mpchartexample/ListViewBarChartActivity.java b/MPChartExample/src/main/java/com/xxmassdeveloper/mpchartexample/ListViewBarChartActivity.java new file mode 100644 index 00000000..1466e5f9 --- /dev/null +++ b/MPChartExample/src/main/java/com/xxmassdeveloper/mpchartexample/ListViewBarChartActivity.java @@ -0,0 +1,181 @@ + +package com.xxmassdeveloper.mpchartexample; + +import android.annotation.SuppressLint; +import android.content.Context; +import android.content.Intent; +import android.graphics.Color; +import android.net.Uri; +import android.os.Bundle; +import androidx.annotation.NonNull; +import android.view.LayoutInflater; +import android.view.Menu; +import android.view.MenuItem; +import android.view.View; +import android.view.ViewGroup; +import android.view.WindowManager; +import android.widget.ArrayAdapter; +import android.widget.ListView; + +import com.github.mikephil.charting.charts.BarChart; +import com.github.mikephil.charting.components.XAxis; +import com.github.mikephil.charting.components.XAxis.XAxisPosition; +import com.github.mikephil.charting.components.YAxis; +import com.github.mikephil.charting.data.BarData; +import com.github.mikephil.charting.data.BarDataSet; +import com.github.mikephil.charting.data.BarEntry; +import com.github.mikephil.charting.interfaces.datasets.IBarDataSet; +import com.github.mikephil.charting.utils.ColorTemplate; +import com.xxmassdeveloper.mpchartexample.notimportant.DemoBase; + +import java.util.ArrayList; +import java.util.List; + +/** + * Demonstrates the use of charts inside a ListView. IMPORTANT: provide a + * specific height attribute for the chart inside your ListView item + * + * @author Philipp Jahoda + */ +public class ListViewBarChartActivity extends DemoBase { + + @Override + protected void onCreate(Bundle savedInstanceState) { + super.onCreate(savedInstanceState); + getWindow().setFlags(WindowManager.LayoutParams.FLAG_FULLSCREEN, + WindowManager.LayoutParams.FLAG_FULLSCREEN); + setContentView(R.layout.activity_listview_chart); + + setTitle("ListViewBarChartActivity"); + + ListView lv = findViewById(R.id.listView1); + + ArrayList<BarData> list = new ArrayList<>(); + + // 20 items + for (int i = 0; i < 20; i++) { + list.add(generateData(i + 1)); + } + + ChartDataAdapter cda = new ChartDataAdapter(getApplicationContext(), list); + lv.setAdapter(cda); + } + + private class ChartDataAdapter extends ArrayAdapter<BarData> { + + ChartDataAdapter(Context context, List<BarData> objects) { + super(context, 0, objects); + } + + @SuppressLint("InflateParams") + @NonNull + @Override + public View getView(int position, View convertView, @NonNull ViewGroup parent) { + + BarData data = getItem(position); + + ViewHolder holder; + + if (convertView == null) { + + holder = new ViewHolder(); + + convertView = LayoutInflater.from(getContext()).inflate( + R.layout.list_item_barchart, null); + holder.chart = convertView.findViewById(R.id.chart); + + convertView.setTag(holder); + + } else { + holder = (ViewHolder) convertView.getTag(); + } + + // apply styling + if (data != null) { + data.setValueTypeface(tfLight); + data.setValueTextColor(Color.BLACK); + } + holder.chart.getDescription().setEnabled(false); + holder.chart.setDrawGridBackground(false); + + XAxis xAxis = holder.chart.getXAxis(); + xAxis.setPosition(XAxisPosition.BOTTOM); + xAxis.setTypeface(tfLight); + xAxis.setDrawGridLines(false); + + YAxis leftAxis = holder.chart.getAxisLeft(); + leftAxis.setTypeface(tfLight); + leftAxis.setLabelCount(5, false); + leftAxis.setSpaceTop(15f); + + YAxis rightAxis = holder.chart.getAxisRight(); + rightAxis.setTypeface(tfLight); + rightAxis.setLabelCount(5, false); + rightAxis.setSpaceTop(15f); + + // set data + holder.chart.setData(data); + holder.chart.setFitBars(true); + + // do not forget to refresh the chart +// holder.chart.invalidate(); + holder.chart.animateY(700); + + return convertView; + } + + private class ViewHolder { + + BarChart chart; + } + } + + /** + * generates a random ChartData object with just one DataSet + * + * @return Bar data + */ + private BarData generateData(int cnt) { + + ArrayList<BarEntry> entries = new ArrayList<>(); + + for (int i = 0; i < 12; i++) { + entries.add(new BarEntry(i, (float) (Math.random() * 70) + 30)); + } + + BarDataSet d = new BarDataSet(entries, "New DataSet " + cnt); + d.setColors(ColorTemplate.VORDIPLOM_COLORS); + d.setBarShadowColor(Color.rgb(203, 203, 203)); + + ArrayList<IBarDataSet> sets = new ArrayList<>(); + sets.add(d); + + BarData cd = new BarData(sets); + cd.setBarWidth(0.9f); + return cd; + } + + @Override + public boolean onCreateOptionsMenu(Menu menu) { + getMenuInflater().inflate(R.menu.only_github, menu); + return true; + } + + @Override + public boolean onOptionsItemSelected(MenuItem item) { + + switch (item.getItemId()) { + case R.id.viewGithub: { + Intent i = new Intent(Intent.ACTION_VIEW); + i.setData(Uri.parse("https://github.com/PhilJay/MPAndroidChart/blob/master/MPChartExample/src/com/xxmassdeveloper/mpchartexample/ListViewBarChartActivity.java")); + startActivity(i); + break; + } + } + + return true; + } + + @Override + public void saveToGallery() { /* Intentionally left empty */ } +} diff --git a/MPChartExample/src/main/java/com/xxmassdeveloper/mpchartexample/ListViewMultiChartActivity.java b/MPChartExample/src/main/java/com/xxmassdeveloper/mpchartexample/ListViewMultiChartActivity.java new file mode 100644 index 00000000..14556916 --- /dev/null +++ b/MPChartExample/src/main/java/com/xxmassdeveloper/mpchartexample/ListViewMultiChartActivity.java @@ -0,0 +1,209 @@ + +package com.xxmassdeveloper.mpchartexample; + +import android.content.Context; +import android.content.Intent; +import android.graphics.Color; +import android.net.Uri; +import android.os.Bundle; +import androidx.annotation.NonNull; +import android.view.Menu; +import android.view.MenuItem; +import android.view.View; +import android.view.ViewGroup; +import android.view.WindowManager; +import android.widget.ArrayAdapter; +import android.widget.ListView; + +import com.github.mikephil.charting.data.BarData; +import com.github.mikephil.charting.data.BarDataSet; +import com.github.mikephil.charting.data.BarEntry; +import com.github.mikephil.charting.data.Entry; +import com.github.mikephil.charting.data.LineData; +import com.github.mikephil.charting.data.LineDataSet; +import com.github.mikephil.charting.data.PieData; +import com.github.mikephil.charting.data.PieDataSet; +import com.github.mikephil.charting.data.PieEntry; +import com.github.mikephil.charting.interfaces.datasets.ILineDataSet; +import com.github.mikephil.charting.utils.ColorTemplate; +import com.xxmassdeveloper.mpchartexample.listviewitems.BarChartItem; +import com.xxmassdeveloper.mpchartexample.listviewitems.ChartItem; +import com.xxmassdeveloper.mpchartexample.listviewitems.LineChartItem; +import com.xxmassdeveloper.mpchartexample.listviewitems.PieChartItem; +import com.xxmassdeveloper.mpchartexample.notimportant.DemoBase; + +import java.util.ArrayList; +import java.util.List; + +/** + * Demonstrates the use of charts inside a ListView. IMPORTANT: provide a + * specific height attribute for the chart inside your ListView item + * + * @author Philipp Jahoda + */ +public class ListViewMultiChartActivity extends DemoBase { + + @Override + protected void onCreate(Bundle savedInstanceState) { + super.onCreate(savedInstanceState); + getWindow().setFlags(WindowManager.LayoutParams.FLAG_FULLSCREEN, + WindowManager.LayoutParams.FLAG_FULLSCREEN); + setContentView(R.layout.activity_listview_chart); + + setTitle("ListViewMultiChartActivity"); + + ListView lv = findViewById(R.id.listView1); + + ArrayList<ChartItem> list = new ArrayList<>(); + + // 30 items + for (int i = 0; i < 30; i++) { + + if(i % 3 == 0) { + list.add(new LineChartItem(generateDataLine(i + 1), getApplicationContext())); + } else if(i % 3 == 1) { + list.add(new BarChartItem(generateDataBar(i + 1), getApplicationContext())); + } else if(i % 3 == 2) { + list.add(new PieChartItem(generateDataPie(), getApplicationContext())); + } + } + + ChartDataAdapter cda = new ChartDataAdapter(getApplicationContext(), list); + lv.setAdapter(cda); + } + + /** adapter that supports 3 different item types */ + private class ChartDataAdapter extends ArrayAdapter<ChartItem> { + + ChartDataAdapter(Context context, List<ChartItem> objects) { + super(context, 0, objects); + } + + @NonNull + @Override + public View getView(int position, View convertView, @NonNull ViewGroup parent) { + //noinspection ConstantConditions + return getItem(position).getView(position, convertView, getContext()); + } + + @Override + public int getItemViewType(int position) { + // return the views type + ChartItem ci = getItem(position); + return ci != null ? ci.getItemType() : 0; + } + + @Override + public int getViewTypeCount() { + return 3; // we have 3 different item-types + } + } + + /** + * generates a random ChartData object with just one DataSet + * + * @return Line data + */ + private LineData generateDataLine(int cnt) { + + ArrayList<Entry> values1 = new ArrayList<>(); + + for (int i = 0; i < 12; i++) { + values1.add(new Entry(i, (int) (Math.random() * 65) + 40)); + } + + LineDataSet d1 = new LineDataSet(values1, "New DataSet " + cnt + ", (1)"); + d1.setLineWidth(2.5f); + d1.setCircleRadius(4.5f); + d1.setHighLightColor(Color.rgb(244, 117, 117)); + d1.setDrawValues(false); + + ArrayList<Entry> values2 = new ArrayList<>(); + + for (int i = 0; i < 12; i++) { + values2.add(new Entry(i, values1.get(i).getY() - 30)); + } + + LineDataSet d2 = new LineDataSet(values2, "New DataSet " + cnt + ", (2)"); + d2.setLineWidth(2.5f); + d2.setCircleRadius(4.5f); + d2.setHighLightColor(Color.rgb(244, 117, 117)); + d2.setColor(ColorTemplate.VORDIPLOM_COLORS[0]); + d2.setCircleColor(ColorTemplate.VORDIPLOM_COLORS[0]); + d2.setDrawValues(false); + + ArrayList<ILineDataSet> sets = new ArrayList<>(); + sets.add(d1); + sets.add(d2); + + return new LineData(sets); + } + + /** + * generates a random ChartData object with just one DataSet + * + * @return Bar data + */ + private BarData generateDataBar(int cnt) { + + ArrayList<BarEntry> entries = new ArrayList<>(); + + for (int i = 0; i < 12; i++) { + entries.add(new BarEntry(i, (int) (Math.random() * 70) + 30)); + } + + BarDataSet d = new BarDataSet(entries, "New DataSet " + cnt); + d.setColors(ColorTemplate.VORDIPLOM_COLORS); + d.setHighLightAlpha(255); + + BarData cd = new BarData(d); + cd.setBarWidth(0.9f); + return cd; + } + + /** + * generates a random ChartData object with just one DataSet + * + * @return Pie data + */ + private PieData generateDataPie() { + + ArrayList<PieEntry> entries = new ArrayList<>(); + + for (int i = 0; i < 4; i++) { + entries.add(new PieEntry((float) ((Math.random() * 70) + 30), "Quarter " + (i+1))); + } + + PieDataSet d = new PieDataSet(entries, ""); + + // space between slices + d.setSliceSpace(2f); + d.setColors(ColorTemplate.VORDIPLOM_COLORS); + + return new PieData(d); + } + + @Override + public boolean onCreateOptionsMenu(Menu menu) { + getMenuInflater().inflate(R.menu.only_github, menu); + return true; + } + + @Override + public boolean onOptionsItemSelected(MenuItem item) { + + switch (item.getItemId()) { + case R.id.viewGithub: { + Intent i = new Intent(Intent.ACTION_VIEW); + i.setData(Uri.parse("https://github.com/PhilJay/MPAndroidChart/blob/master/MPChartExample/src/com/xxmassdeveloper/mpchartexample/ListViewMultiChartActivity.java")); + startActivity(i); + break; + } + } + + return true; + } + + @Override + public void saveToGallery() { /* Intentionally left empty */ } +} diff --git a/MPChartExample/src/main/java/com/xxmassdeveloper/mpchartexample/MultiLineChartActivity.java b/MPChartExample/src/main/java/com/xxmassdeveloper/mpchartexample/MultiLineChartActivity.java new file mode 100644 index 00000000..11d69d8d --- /dev/null +++ b/MPChartExample/src/main/java/com/xxmassdeveloper/mpchartexample/MultiLineChartActivity.java @@ -0,0 +1,354 @@ + +package com.xxmassdeveloper.mpchartexample; + +import android.Manifest; +import android.content.Intent; +import android.content.pm.PackageManager; +import android.net.Uri; +import android.os.Bundle; +import androidx.core.content.ContextCompat; +import android.util.Log; +import android.view.Menu; +import android.view.MenuItem; +import android.view.MotionEvent; +import android.view.WindowManager; +import android.widget.SeekBar; +import android.widget.SeekBar.OnSeekBarChangeListener; +import android.widget.TextView; + +import com.github.mikephil.charting.charts.LineChart; +import com.github.mikephil.charting.components.Legend; +import com.github.mikephil.charting.data.Entry; +import com.github.mikephil.charting.data.LineData; +import com.github.mikephil.charting.data.LineDataSet; +import com.github.mikephil.charting.highlight.Highlight; +import com.github.mikephil.charting.interfaces.datasets.ILineDataSet; +import com.github.mikephil.charting.listener.ChartTouchListener; +import com.github.mikephil.charting.listener.OnChartGestureListener; +import com.github.mikephil.charting.listener.OnChartValueSelectedListener; +import com.github.mikephil.charting.utils.ColorTemplate; +import com.xxmassdeveloper.mpchartexample.notimportant.DemoBase; + +import java.util.ArrayList; +import java.util.List; + +public class MultiLineChartActivity extends DemoBase implements OnSeekBarChangeListener, + OnChartGestureListener, OnChartValueSelectedListener { + + private LineChart chart; + private SeekBar seekBarX, seekBarY; + private TextView tvX, tvY; + + @Override + protected void onCreate(Bundle savedInstanceState) { + super.onCreate(savedInstanceState); + getWindow().setFlags(WindowManager.LayoutParams.FLAG_FULLSCREEN, + WindowManager.LayoutParams.FLAG_FULLSCREEN); + setContentView(R.layout.activity_linechart); + + setTitle("MultiLineChartActivity"); + + tvX = findViewById(R.id.tvXMax); + tvY = findViewById(R.id.tvYMax); + + seekBarX = findViewById(R.id.seekBar1); + seekBarX.setOnSeekBarChangeListener(this); + + seekBarY = findViewById(R.id.seekBar2); + seekBarY.setOnSeekBarChangeListener(this); + + chart = findViewById(R.id.chart1); + chart.setOnChartValueSelectedListener(this); + + chart.setDrawGridBackground(false); + chart.getDescription().setEnabled(false); + chart.setDrawBorders(false); + + chart.getAxisLeft().setEnabled(false); + chart.getAxisRight().setDrawAxisLine(false); + chart.getAxisRight().setDrawGridLines(false); + chart.getXAxis().setDrawAxisLine(false); + chart.getXAxis().setDrawGridLines(false); + + // enable touch gestures + chart.setTouchEnabled(true); + + // enable scaling and dragging + chart.setDragEnabled(true); + chart.setScaleEnabled(true); + + // if disabled, scaling can be done on x- and y-axis separately + chart.setPinchZoom(false); + + seekBarX.setProgress(20); + seekBarY.setProgress(100); + + Legend l = chart.getLegend(); + l.setVerticalAlignment(Legend.LegendVerticalAlignment.TOP); + l.setHorizontalAlignment(Legend.LegendHorizontalAlignment.RIGHT); + l.setOrientation(Legend.LegendOrientation.VERTICAL); + l.setDrawInside(false); + } + + private final int[] colors = new int[] { + ColorTemplate.VORDIPLOM_COLORS[0], + ColorTemplate.VORDIPLOM_COLORS[1], + ColorTemplate.VORDIPLOM_COLORS[2] + }; + + @Override + public void onProgressChanged(SeekBar seekBar, int progress, boolean fromUser) { + + chart.resetTracking(); + + progress = seekBarX.getProgress(); + + tvX.setText(String.valueOf(seekBarX.getProgress())); + tvY.setText(String.valueOf(seekBarY.getProgress())); + + ArrayList<ILineDataSet> dataSets = new ArrayList<>(); + + for (int z = 0; z < 3; z++) { + + ArrayList<Entry> values = new ArrayList<>(); + + for (int i = 0; i < progress; i++) { + double val = (Math.random() * seekBarY.getProgress()) + 3; + values.add(new Entry(i, (float) val)); + } + + LineDataSet d = new LineDataSet(values, "DataSet " + (z + 1)); + d.setLineWidth(2.5f); + d.setCircleRadius(4f); + + int color = colors[z % colors.length]; + d.setColor(color); + d.setCircleColor(color); + dataSets.add(d); + } + + // make the first DataSet dashed + ((LineDataSet) dataSets.get(0)).enableDashedLine(10, 10, 0); + ((LineDataSet) dataSets.get(0)).setColors(ColorTemplate.VORDIPLOM_COLORS); + ((LineDataSet) dataSets.get(0)).setCircleColors(ColorTemplate.VORDIPLOM_COLORS); + + LineData data = new LineData(dataSets); + chart.setData(data); + chart.invalidate(); + } + + @Override + public boolean onCreateOptionsMenu(Menu menu) { + getMenuInflater().inflate(R.menu.line, menu); + menu.removeItem(R.id.actionToggleIcons); + return true; + } + + @Override + public boolean onOptionsItemSelected(MenuItem item) { + + switch (item.getItemId()) { + case R.id.viewGithub: { + Intent i = new Intent(Intent.ACTION_VIEW); + i.setData(Uri.parse("https://github.com/PhilJay/MPAndroidChart/blob/master/MPChartExample/src/com/xxmassdeveloper/mpchartexample/MultiLineChartActivity.java")); + startActivity(i); + break; + } + case R.id.actionToggleValues: { + List<ILineDataSet> sets = chart.getData() + .getDataSets(); + + for (ILineDataSet iSet : sets) { + + LineDataSet set = (LineDataSet) iSet; + set.setDrawValues(!set.isDrawValuesEnabled()); + } + + chart.invalidate(); + break; + } + /* + case R.id.actionToggleIcons: { break; } + */ + case R.id.actionTogglePinch: { + if (chart.isPinchZoomEnabled()) + chart.setPinchZoom(false); + else + chart.setPinchZoom(true); + + chart.invalidate(); + break; + } + case R.id.actionToggleAutoScaleMinMax: { + chart.setAutoScaleMinMaxEnabled(!chart.isAutoScaleMinMaxEnabled()); + chart.notifyDataSetChanged(); + break; + } + case R.id.actionToggleHighlight: { + if(chart.getData() != null) { + chart.getData().setHighlightEnabled(!chart.getData().isHighlightEnabled()); + chart.invalidate(); + } + break; + } + case R.id.actionToggleFilled: { + List<ILineDataSet> sets = chart.getData() + .getDataSets(); + + for (ILineDataSet iSet : sets) { + + LineDataSet set = (LineDataSet) iSet; + if (set.isDrawFilledEnabled()) + set.setDrawFilled(false); + else + set.setDrawFilled(true); + } + chart.invalidate(); + break; + } + case R.id.actionToggleCircles: { + List<ILineDataSet> sets = chart.getData() + .getDataSets(); + + for (ILineDataSet iSet : sets) { + + LineDataSet set = (LineDataSet) iSet; + if (set.isDrawCirclesEnabled()) + set.setDrawCircles(false); + else + set.setDrawCircles(true); + } + chart.invalidate(); + break; + } + case R.id.actionToggleCubic: { + List<ILineDataSet> sets = chart.getData() + .getDataSets(); + + for (ILineDataSet iSet : sets) { + + LineDataSet set = (LineDataSet) iSet; + set.setMode(set.getMode() == LineDataSet.Mode.CUBIC_BEZIER + ? LineDataSet.Mode.LINEAR + : LineDataSet.Mode.CUBIC_BEZIER); + } + chart.invalidate(); + break; + } + case R.id.actionToggleStepped: { + List<ILineDataSet> sets = chart.getData() + .getDataSets(); + + for (ILineDataSet iSet : sets) { + + LineDataSet set = (LineDataSet) iSet; + set.setMode(set.getMode() == LineDataSet.Mode.STEPPED + ? LineDataSet.Mode.LINEAR + : LineDataSet.Mode.STEPPED); + } + chart.invalidate(); + break; + } + case R.id.actionToggleHorizontalCubic: { + List<ILineDataSet> sets = chart.getData() + .getDataSets(); + + for (ILineDataSet iSet : sets) { + + LineDataSet set = (LineDataSet) iSet; + set.setMode(set.getMode() == LineDataSet.Mode.HORIZONTAL_BEZIER + ? LineDataSet.Mode.LINEAR + : LineDataSet.Mode.HORIZONTAL_BEZIER); + } + chart.invalidate(); + break; + } + case R.id.actionSave: { + if (ContextCompat.checkSelfPermission(this, Manifest.permission.WRITE_EXTERNAL_STORAGE) == PackageManager.PERMISSION_GRANTED) { + saveToGallery(); + } else { + requestStoragePermission(chart); + } + break; + } + case R.id.animateX: { + chart.animateX(2000); + break; + } + case R.id.animateY: { + chart.animateY(2000); + break; + } + case R.id.animateXY: { + chart.animateXY(2000, 2000); + break; + } + } + return true; + } + + @Override + protected void saveToGallery() { + saveToGallery(chart, "MultiLineChartActivity"); + } + + @Override + public void onChartGestureStart(MotionEvent me, ChartTouchListener.ChartGesture lastPerformedGesture) { + Log.i("Gesture", "START, x: " + me.getX() + ", y: " + me.getY()); + } + + @Override + public void onChartGestureEnd(MotionEvent me, ChartTouchListener.ChartGesture lastPerformedGesture) { + Log.i("Gesture", "END, lastGesture: " + lastPerformedGesture); + + // un-highlight values after the gesture is finished and no single-tap + if(lastPerformedGesture != ChartTouchListener.ChartGesture.SINGLE_TAP) + chart.highlightValues(null); // or highlightTouch(null) for callback to onNothingSelected(...) + } + + @Override + public void onChartLongPressed(MotionEvent me) { + Log.i("LongPress", "Chart long pressed."); + } + + @Override + public void onChartDoubleTapped(MotionEvent me) { + Log.i("DoubleTap", "Chart double-tapped."); + } + + @Override + public void onChartSingleTapped(MotionEvent me) { + Log.i("SingleTap", "Chart single-tapped."); + } + + @Override + public void onChartFling(MotionEvent me1, MotionEvent me2, float velocityX, float velocityY) { + Log.i("Fling", "Chart fling. VelocityX: " + velocityX + ", VelocityY: " + velocityY); + } + + @Override + public void onChartScale(MotionEvent me, float scaleX, float scaleY) { + Log.i("Scale / Zoom", "ScaleX: " + scaleX + ", ScaleY: " + scaleY); + } + + @Override + public void onChartTranslate(MotionEvent me, float dX, float dY) { + Log.i("Translate / Move", "dX: " + dX + ", dY: " + dY); + } + + @Override + public void onValueSelected(Entry e, Highlight h) { + Log.i("VAL SELECTED", + "Value: " + e.getY() + ", xIndex: " + e.getX() + + ", DataSet index: " + h.getDataSetIndex()); + } + + @Override + public void onNothingSelected() {} + + @Override + public void onStartTrackingTouch(SeekBar seekBar) {} + + @Override + public void onStopTrackingTouch(SeekBar seekBar) {} +} diff --git a/MPChartExample/src/main/java/com/xxmassdeveloper/mpchartexample/PerformanceLineChart.java b/MPChartExample/src/main/java/com/xxmassdeveloper/mpchartexample/PerformanceLineChart.java new file mode 100644 index 00000000..c5573234 --- /dev/null +++ b/MPChartExample/src/main/java/com/xxmassdeveloper/mpchartexample/PerformanceLineChart.java @@ -0,0 +1,144 @@ + +package com.xxmassdeveloper.mpchartexample; + +import android.content.Intent; +import android.graphics.Color; +import android.net.Uri; +import android.os.Bundle; +import android.view.Menu; +import android.view.MenuItem; +import android.view.WindowManager; +import android.widget.SeekBar; +import android.widget.SeekBar.OnSeekBarChangeListener; +import android.widget.TextView; + +import com.github.mikephil.charting.charts.LineChart; +import com.github.mikephil.charting.components.Legend; +import com.github.mikephil.charting.data.Entry; +import com.github.mikephil.charting.data.LineData; +import com.github.mikephil.charting.data.LineDataSet; +import com.xxmassdeveloper.mpchartexample.notimportant.DemoBase; + +import java.util.ArrayList; + +@SuppressWarnings("SameParameterValue") +public class PerformanceLineChart extends DemoBase implements OnSeekBarChangeListener { + + private LineChart chart; + private SeekBar seekBarValues; + private TextView tvCount; + + @Override + protected void onCreate(Bundle savedInstanceState) { + super.onCreate(savedInstanceState); + getWindow().setFlags(WindowManager.LayoutParams.FLAG_FULLSCREEN, + WindowManager.LayoutParams.FLAG_FULLSCREEN); + setContentView(R.layout.activity_performance_linechart); + + setTitle("PerformanceLineChart"); + + tvCount = findViewById(R.id.tvValueCount); + seekBarValues = findViewById(R.id.seekbarValues); + seekBarValues.setOnSeekBarChangeListener(this); + + chart = findViewById(R.id.chart1); + chart.setDrawGridBackground(false); + + // no description text + chart.getDescription().setEnabled(false); + + // enable touch gestures + chart.setTouchEnabled(true); + + // enable scaling and dragging + chart.setDragEnabled(true); + chart.setScaleEnabled(true); + + // if disabled, scaling can be done on x- and y-axis separately + chart.setPinchZoom(false); + + chart.getAxisLeft().setDrawGridLines(false); + chart.getAxisRight().setEnabled(false); + chart.getXAxis().setDrawGridLines(true); + chart.getXAxis().setDrawAxisLine(false); + + seekBarValues.setProgress(9000); + + // don't forget to refresh the drawing + chart.invalidate(); + } + + private void setData(int count, float range) { + + ArrayList<Entry> values = new ArrayList<>(); + + for (int i = 0; i < count; i++) { + float val = (float) (Math.random() * (range + 1)) + 3; + values.add(new Entry(i * 0.001f, val)); + } + + // create a dataset and give it a type + LineDataSet set1 = new LineDataSet(values, "DataSet 1"); + + set1.setColor(Color.BLACK); + set1.setLineWidth(0.5f); + set1.setDrawValues(false); + set1.setDrawCircles(false); + set1.setMode(LineDataSet.Mode.LINEAR); + set1.setDrawFilled(false); + + // create a data object with the data sets + LineData data = new LineData(set1); + + // set data + chart.setData(data); + + // get the legend (only possible after setting data) + Legend l = chart.getLegend(); + l.setEnabled(false); + } + + @Override + public boolean onCreateOptionsMenu(Menu menu) { + getMenuInflater().inflate(R.menu.only_github, menu); + return true; + } + + @Override + public boolean onOptionsItemSelected(MenuItem item) { + + switch (item.getItemId()) { + case R.id.viewGithub: { + Intent i = new Intent(Intent.ACTION_VIEW); + i.setData(Uri.parse("https://github.com/PhilJay/MPAndroidChart/blob/master/MPChartExample/src/com/xxmassdeveloper/mpchartexample/PerformanceLineChart.java")); + startActivity(i); + break; + } + } + + return true; + } + + @Override + public void onProgressChanged(SeekBar seekBar, int progress, boolean fromUser) { + + int count = seekBarValues.getProgress() + 1000; + tvCount.setText(String.valueOf(count)); + + chart.resetTracking(); + + setData(count, 500f); + + // redraw + chart.invalidate(); + } + + @Override + public void saveToGallery() { /* Intentionally left empty */ } + + @Override + public void onStartTrackingTouch(SeekBar seekBar) {} + + @Override + public void onStopTrackingTouch(SeekBar seekBar) {} +} diff --git a/MPChartExample/src/main/java/com/xxmassdeveloper/mpchartexample/PieChartActivity.java b/MPChartExample/src/main/java/com/xxmassdeveloper/mpchartexample/PieChartActivity.java new file mode 100644 index 00000000..830025fb --- /dev/null +++ b/MPChartExample/src/main/java/com/xxmassdeveloper/mpchartexample/PieChartActivity.java @@ -0,0 +1,326 @@ + +package com.xxmassdeveloper.mpchartexample; + +import android.Manifest; +import android.content.Intent; +import android.content.pm.PackageManager; +import android.graphics.Color; +import android.graphics.Typeface; +import android.net.Uri; +import android.os.Bundle; +import androidx.core.content.ContextCompat; +import android.text.SpannableString; +import android.text.style.ForegroundColorSpan; +import android.text.style.RelativeSizeSpan; +import android.text.style.StyleSpan; +import android.util.Log; +import android.view.Menu; +import android.view.MenuItem; +import android.view.WindowManager; +import android.widget.SeekBar; +import android.widget.SeekBar.OnSeekBarChangeListener; +import android.widget.TextView; + +import com.github.mikephil.charting.animation.Easing; +import com.github.mikephil.charting.charts.PieChart; +import com.github.mikephil.charting.components.Legend; +import com.github.mikephil.charting.data.Entry; +import com.github.mikephil.charting.data.PieData; +import com.github.mikephil.charting.data.PieDataSet; +import com.github.mikephil.charting.data.PieEntry; +import com.github.mikephil.charting.formatter.PercentFormatter; +import com.github.mikephil.charting.highlight.Highlight; +import com.github.mikephil.charting.interfaces.datasets.IDataSet; +import com.github.mikephil.charting.listener.OnChartValueSelectedListener; +import com.github.mikephil.charting.utils.ColorTemplate; +import com.github.mikephil.charting.utils.MPPointF; +import com.xxmassdeveloper.mpchartexample.notimportant.DemoBase; + +import java.util.ArrayList; + +public class PieChartActivity extends DemoBase implements OnSeekBarChangeListener, + OnChartValueSelectedListener { + + private PieChart chart; + private SeekBar seekBarX, seekBarY; + private TextView tvX, tvY; + + @Override + protected void onCreate(Bundle savedInstanceState) { + super.onCreate(savedInstanceState); + getWindow().setFlags(WindowManager.LayoutParams.FLAG_FULLSCREEN, + WindowManager.LayoutParams.FLAG_FULLSCREEN); + setContentView(R.layout.activity_piechart); + + setTitle("PieChartActivity"); + + tvX = findViewById(R.id.tvXMax); + tvY = findViewById(R.id.tvYMax); + + seekBarX = findViewById(R.id.seekBar1); + seekBarY = findViewById(R.id.seekBar2); + + seekBarX.setOnSeekBarChangeListener(this); + seekBarY.setOnSeekBarChangeListener(this); + + chart = findViewById(R.id.chart1); + chart.setUsePercentValues(true); + chart.getDescription().setEnabled(false); + chart.setExtraOffsets(5, 10, 5, 5); + + chart.setDragDecelerationFrictionCoef(0.95f); + + chart.setCenterTextTypeface(tfLight); + chart.setCenterText(generateCenterSpannableText()); + + chart.setDrawHoleEnabled(true); + chart.setHoleColor(Color.WHITE); + + chart.setTransparentCircleColor(Color.WHITE); + chart.setTransparentCircleAlpha(110); + + chart.setHoleRadius(58f); + chart.setTransparentCircleRadius(61f); + + chart.setDrawCenterText(true); + + chart.setRotationAngle(0); + // enable rotation of the chart by touch + chart.setRotationEnabled(true); + chart.setHighlightPerTapEnabled(true); + + // chart.setUnit(" €"); + // chart.setDrawUnitsInChart(true); + + // add a selection listener + chart.setOnChartValueSelectedListener(this); + + seekBarX.setProgress(4); + seekBarY.setProgress(10); + + chart.animateY(1400, Easing.EaseInOutQuad); + // chart.spin(2000, 0, 360); + + Legend l = chart.getLegend(); + l.setVerticalAlignment(Legend.LegendVerticalAlignment.TOP); + l.setHorizontalAlignment(Legend.LegendHorizontalAlignment.RIGHT); + l.setOrientation(Legend.LegendOrientation.VERTICAL); + l.setDrawInside(false); + l.setXEntrySpace(7f); + l.setYEntrySpace(0f); + l.setYOffset(0f); + + // entry label styling + chart.setEntryLabelColor(Color.WHITE); + chart.setEntryLabelTypeface(tfRegular); + chart.setEntryLabelTextSize(12f); + } + + private void setData(int count, float range) { + ArrayList<PieEntry> entries = new ArrayList<>(); + + // NOTE: The order of the entries when being added to the entries array determines their position around the center of + // the chart. + for (int i = 0; i < count ; i++) { + entries.add(new PieEntry((float) ((Math.random() * range) + range / 5), + parties[i % parties.length], + getResources().getDrawable(R.drawable.star))); + } + + PieDataSet dataSet = new PieDataSet(entries, "Election Results"); + + dataSet.setDrawIcons(false); + + dataSet.setSliceSpace(3f); + dataSet.setIconsOffset(new MPPointF(0, 40)); + dataSet.setSelectionShift(5f); + + // add a lot of colors + + ArrayList<Integer> colors = new ArrayList<>(); + + for (int c : ColorTemplate.VORDIPLOM_COLORS) + colors.add(c); + + for (int c : ColorTemplate.JOYFUL_COLORS) + colors.add(c); + + for (int c : ColorTemplate.COLORFUL_COLORS) + colors.add(c); + + for (int c : ColorTemplate.LIBERTY_COLORS) + colors.add(c); + + for (int c : ColorTemplate.PASTEL_COLORS) + colors.add(c); + + colors.add(ColorTemplate.getHoloBlue()); + + dataSet.setColors(colors); + //dataSet.setSelectionShift(0f); + + PieData data = new PieData(dataSet); + data.setValueFormatter(new PercentFormatter()); + data.setValueTextSize(11f); + data.setValueTextColor(Color.WHITE); + data.setValueTypeface(tfLight); + chart.setData(data); + + // undo all highlights + chart.highlightValues(null); + + chart.invalidate(); + } + + @Override + public boolean onCreateOptionsMenu(Menu menu) { + getMenuInflater().inflate(R.menu.pie, menu); + return true; + } + + @Override + public boolean onOptionsItemSelected(MenuItem item) { + + switch (item.getItemId()) { + case R.id.viewGithub: { + Intent i = new Intent(Intent.ACTION_VIEW); + i.setData(Uri.parse("https://github.com/PhilJay/MPAndroidChart/blob/master/MPChartExample/src/com/xxmassdeveloper/mpchartexample/PieChartActivity.java")); + startActivity(i); + break; + } + case R.id.actionToggleValues: { + for (IDataSet<?> set : chart.getData().getDataSets()) + set.setDrawValues(!set.isDrawValuesEnabled()); + + chart.invalidate(); + break; + } + case R.id.actionToggleIcons: { + for (IDataSet<?> set : chart.getData().getDataSets()) + set.setDrawIcons(!set.isDrawIconsEnabled()); + + chart.invalidate(); + break; + } + case R.id.actionToggleHole: { + if (chart.isDrawHoleEnabled()) + chart.setDrawHoleEnabled(false); + else + chart.setDrawHoleEnabled(true); + chart.invalidate(); + break; + } + case R.id.actionToggleMinAngles: { + if (chart.getMinAngleForSlices() == 0f) + chart.setMinAngleForSlices(36f); + else + chart.setMinAngleForSlices(0f); + chart.notifyDataSetChanged(); + chart.invalidate(); + break; + } + case R.id.actionToggleCurvedSlices: { + boolean toSet = !chart.isDrawRoundedSlicesEnabled() || !chart.isDrawHoleEnabled(); + chart.setDrawRoundedSlices(toSet); + if (toSet && !chart.isDrawHoleEnabled()) { + chart.setDrawHoleEnabled(true); + } + if (toSet && chart.isDrawSlicesUnderHoleEnabled()) { + chart.setDrawSlicesUnderHole(false); + } + chart.invalidate(); + break; + } + case R.id.actionDrawCenter: { + if (chart.isDrawCenterTextEnabled()) + chart.setDrawCenterText(false); + else + chart.setDrawCenterText(true); + chart.invalidate(); + break; + } + case R.id.actionToggleXValues: { + + chart.setDrawEntryLabels(!chart.isDrawEntryLabelsEnabled()); + chart.invalidate(); + break; + } + case R.id.actionTogglePercent: + chart.setUsePercentValues(!chart.isUsePercentValuesEnabled()); + chart.invalidate(); + break; + case R.id.animateX: { + chart.animateX(1400); + break; + } + case R.id.animateY: { + chart.animateY(1400); + break; + } + case R.id.animateXY: { + chart.animateXY(1400, 1400); + break; + } + case R.id.actionToggleSpin: { + chart.spin(1000, chart.getRotationAngle(), chart.getRotationAngle() + 360, Easing.EaseInOutCubic); + break; + } + case R.id.actionSave: { + if (ContextCompat.checkSelfPermission(this, Manifest.permission.WRITE_EXTERNAL_STORAGE) == PackageManager.PERMISSION_GRANTED) { + saveToGallery(); + } else { + requestStoragePermission(chart); + } + break; + } + } + return true; + } + + @Override + public void onProgressChanged(SeekBar seekBar, int progress, boolean fromUser) { + + tvX.setText(String.valueOf(seekBarX.getProgress())); + tvY.setText(String.valueOf(seekBarY.getProgress())); + + setData(seekBarX.getProgress(), seekBarY.getProgress()); + } + + @Override + protected void saveToGallery() { + saveToGallery(chart, "PieChartActivity"); + } + + private SpannableString generateCenterSpannableText() { + + SpannableString s = new SpannableString("MPAndroidChart\ndeveloped by Philipp Jahoda"); + s.setSpan(new RelativeSizeSpan(1.7f), 0, 14, 0); + s.setSpan(new StyleSpan(Typeface.NORMAL), 14, s.length() - 15, 0); + s.setSpan(new ForegroundColorSpan(Color.GRAY), 14, s.length() - 15, 0); + s.setSpan(new RelativeSizeSpan(.8f), 14, s.length() - 15, 0); + s.setSpan(new StyleSpan(Typeface.ITALIC), s.length() - 14, s.length(), 0); + s.setSpan(new ForegroundColorSpan(ColorTemplate.getHoloBlue()), s.length() - 14, s.length(), 0); + return s; + } + + @Override + public void onValueSelected(Entry e, Highlight h) { + + if (e == null) + return; + Log.i("VAL SELECTED", + "Value: " + e.getY() + ", index: " + h.getX() + + ", DataSet index: " + h.getDataSetIndex()); + } + + @Override + public void onNothingSelected() { + Log.i("PieChart", "nothing selected"); + } + + @Override + public void onStartTrackingTouch(SeekBar seekBar) {} + + @Override + public void onStopTrackingTouch(SeekBar seekBar) {} +} diff --git a/MPChartExample/src/main/java/com/xxmassdeveloper/mpchartexample/PiePolylineChartActivity.java b/MPChartExample/src/main/java/com/xxmassdeveloper/mpchartexample/PiePolylineChartActivity.java new file mode 100644 index 00000000..dd3bd575 --- /dev/null +++ b/MPChartExample/src/main/java/com/xxmassdeveloper/mpchartexample/PiePolylineChartActivity.java @@ -0,0 +1,320 @@ + +package com.xxmassdeveloper.mpchartexample; + +import android.Manifest; +import android.content.Intent; +import android.content.pm.PackageManager; +import android.graphics.Color; +import android.graphics.Typeface; +import android.net.Uri; +import android.os.Bundle; +import androidx.core.content.ContextCompat; +import android.text.SpannableString; +import android.text.style.ForegroundColorSpan; +import android.text.style.RelativeSizeSpan; +import android.text.style.StyleSpan; +import android.util.Log; +import android.view.Menu; +import android.view.MenuItem; +import android.view.WindowManager; +import android.widget.SeekBar; +import android.widget.SeekBar.OnSeekBarChangeListener; +import android.widget.TextView; + +import com.github.mikephil.charting.animation.Easing; +import com.github.mikephil.charting.charts.PieChart; +import com.github.mikephil.charting.components.Legend; +import com.github.mikephil.charting.data.Entry; +import com.github.mikephil.charting.data.PieData; +import com.github.mikephil.charting.data.PieDataSet; +import com.github.mikephil.charting.data.PieEntry; +import com.github.mikephil.charting.formatter.PercentFormatter; +import com.github.mikephil.charting.highlight.Highlight; +import com.github.mikephil.charting.interfaces.datasets.IDataSet; +import com.github.mikephil.charting.listener.OnChartValueSelectedListener; +import com.github.mikephil.charting.utils.ColorTemplate; +import com.xxmassdeveloper.mpchartexample.notimportant.DemoBase; + +import java.util.ArrayList; + +public class PiePolylineChartActivity extends DemoBase implements OnSeekBarChangeListener, + OnChartValueSelectedListener { + + private PieChart chart; + private SeekBar seekBarX, seekBarY; + private TextView tvX, tvY; + + private Typeface tf; + + @Override + protected void onCreate(Bundle savedInstanceState) { + super.onCreate(savedInstanceState); + getWindow().setFlags(WindowManager.LayoutParams.FLAG_FULLSCREEN, + WindowManager.LayoutParams.FLAG_FULLSCREEN); + setContentView(R.layout.activity_piechart); + + setTitle("PiePolylineChartActivity"); + + tvX = findViewById(R.id.tvXMax); + tvY = findViewById(R.id.tvYMax); + + seekBarX = findViewById(R.id.seekBar1); + seekBarY = findViewById(R.id.seekBar2); + + seekBarX.setOnSeekBarChangeListener(this); + seekBarY.setOnSeekBarChangeListener(this); + + chart = findViewById(R.id.chart1); + chart.setUsePercentValues(true); + chart.getDescription().setEnabled(false); + chart.setExtraOffsets(5, 10, 5, 5); + + chart.setDragDecelerationFrictionCoef(0.95f); + + tf = Typeface.createFromAsset(getAssets(), "OpenSans-Regular.ttf"); + + chart.setCenterTextTypeface(Typeface.createFromAsset(getAssets(), "OpenSans-Light.ttf")); + chart.setCenterText(generateCenterSpannableText()); + + chart.setExtraOffsets(20.f, 0.f, 20.f, 0.f); + + chart.setDrawHoleEnabled(true); + chart.setHoleColor(Color.WHITE); + + chart.setTransparentCircleColor(Color.WHITE); + chart.setTransparentCircleAlpha(110); + + chart.setHoleRadius(58f); + chart.setTransparentCircleRadius(61f); + + chart.setDrawCenterText(true); + + chart.setRotationAngle(0); + // enable rotation of the chart by touch + chart.setRotationEnabled(true); + chart.setHighlightPerTapEnabled(true); + + // chart.setUnit(" €"); + // chart.setDrawUnitsInChart(true); + + // add a selection listener + chart.setOnChartValueSelectedListener(this); + + seekBarX.setProgress(4); + seekBarY.setProgress(100); + + chart.animateY(1400, Easing.EaseInOutQuad); + // chart.spin(2000, 0, 360); + + Legend l = chart.getLegend(); + l.setVerticalAlignment(Legend.LegendVerticalAlignment.TOP); + l.setHorizontalAlignment(Legend.LegendHorizontalAlignment.RIGHT); + l.setOrientation(Legend.LegendOrientation.VERTICAL); + l.setDrawInside(false); + l.setEnabled(false); + } + + private void setData(int count, float range) { + + ArrayList<PieEntry> entries = new ArrayList<>(); + + // NOTE: The order of the entries when being added to the entries array determines their position around the center of + // the chart. + for (int i = 0; i < count; i++) { + entries.add(new PieEntry((float) (Math.random() * range) + range / 5, parties[i % parties.length])); + } + + PieDataSet dataSet = new PieDataSet(entries, "Election Results"); + dataSet.setSliceSpace(3f); + dataSet.setSelectionShift(5f); + + // add a lot of colors + + ArrayList<Integer> colors = new ArrayList<>(); + + for (int c : ColorTemplate.VORDIPLOM_COLORS) + colors.add(c); + + for (int c : ColorTemplate.JOYFUL_COLORS) + colors.add(c); + + for (int c : ColorTemplate.COLORFUL_COLORS) + colors.add(c); + + for (int c : ColorTemplate.LIBERTY_COLORS) + colors.add(c); + + for (int c : ColorTemplate.PASTEL_COLORS) + colors.add(c); + + colors.add(ColorTemplate.getHoloBlue()); + + dataSet.setColors(colors); + //dataSet.setSelectionShift(0f); + + + dataSet.setValueLinePart1OffsetPercentage(80.f); + dataSet.setValueLinePart1Length(0.2f); + dataSet.setValueLinePart2Length(0.4f); + + //dataSet.setXValuePosition(PieDataSet.ValuePosition.OUTSIDE_SLICE); + dataSet.setYValuePosition(PieDataSet.ValuePosition.OUTSIDE_SLICE); + + PieData data = new PieData(dataSet); + data.setValueFormatter(new PercentFormatter()); + data.setValueTextSize(11f); + data.setValueTextColor(Color.BLACK); + data.setValueTypeface(tf); + chart.setData(data); + + // undo all highlights + chart.highlightValues(null); + + chart.invalidate(); + } + + @Override + public boolean onCreateOptionsMenu(Menu menu) { + getMenuInflater().inflate(R.menu.pie, menu); + return true; + } + + @Override + public boolean onOptionsItemSelected(MenuItem item) { + + switch (item.getItemId()) { + case R.id.viewGithub: { + Intent i = new Intent(Intent.ACTION_VIEW); + i.setData(Uri.parse("https://github.com/PhilJay/MPAndroidChart/blob/master/MPChartExample/src/com/xxmassdeveloper/mpchartexample/PiePolylineChartActivity.java")); + startActivity(i); + break; + } + case R.id.actionToggleValues: { + for (IDataSet<?> set : chart.getData().getDataSets()) + set.setDrawValues(!set.isDrawValuesEnabled()); + + chart.invalidate(); + break; + } + case R.id.actionToggleHole: { + if (chart.isDrawHoleEnabled()) + chart.setDrawHoleEnabled(false); + else + chart.setDrawHoleEnabled(true); + chart.invalidate(); + break; + } + case R.id.actionToggleMinAngles: { + if (chart.getMinAngleForSlices() == 0f) + chart.setMinAngleForSlices(36f); + else + chart.setMinAngleForSlices(0f); + chart.notifyDataSetChanged(); + chart.invalidate(); + break; + } + case R.id.actionToggleCurvedSlices: { + boolean toSet = !chart.isDrawRoundedSlicesEnabled() || !chart.isDrawHoleEnabled(); + chart.setDrawRoundedSlices(toSet); + if (toSet && !chart.isDrawHoleEnabled()) { + chart.setDrawHoleEnabled(true); + } + if (toSet && chart.isDrawSlicesUnderHoleEnabled()) { + chart.setDrawSlicesUnderHole(false); + } + chart.invalidate(); + break; + } + case R.id.actionDrawCenter: { + if (chart.isDrawCenterTextEnabled()) + chart.setDrawCenterText(false); + else + chart.setDrawCenterText(true); + chart.invalidate(); + break; + } + case R.id.actionToggleXValues: { + + chart.setDrawEntryLabels(!chart.isDrawEntryLabelsEnabled()); + chart.invalidate(); + break; + } + case R.id.actionTogglePercent: + chart.setUsePercentValues(!chart.isUsePercentValuesEnabled()); + chart.invalidate(); + break; + case R.id.animateX: { + chart.animateX(1400); + break; + } + case R.id.animateY: { + chart.animateY(1400); + break; + } + case R.id.animateXY: { + chart.animateXY(1400, 1400); + break; + } + case R.id.actionToggleSpin: { + chart.spin(1000, chart.getRotationAngle(), chart.getRotationAngle() + 360, Easing.EaseInOutCubic); + break; + } + case R.id.actionSave: { + if (ContextCompat.checkSelfPermission(this, Manifest.permission.WRITE_EXTERNAL_STORAGE) == PackageManager.PERMISSION_GRANTED) { + saveToGallery(); + } else { + requestStoragePermission(chart); + } + break; + } + } + return true; + } + + @Override + public void onProgressChanged(SeekBar seekBar, int progress, boolean fromUser) { + + tvX.setText(String.valueOf(seekBarX.getProgress())); + tvY.setText(String.valueOf(seekBarY.getProgress())); + + setData(seekBarX.getProgress(), seekBarY.getProgress()); + } + + @Override + protected void saveToGallery() { + saveToGallery(chart, "PiePolylineChartActivity"); + } + + private SpannableString generateCenterSpannableText() { + + SpannableString s = new SpannableString("MPAndroidChart\ndeveloped by Philipp Jahoda"); + s.setSpan(new RelativeSizeSpan(1.5f), 0, 14, 0); + s.setSpan(new StyleSpan(Typeface.NORMAL), 14, s.length() - 15, 0); + s.setSpan(new ForegroundColorSpan(Color.GRAY), 14, s.length() - 15, 0); + s.setSpan(new RelativeSizeSpan(.65f), 14, s.length() - 15, 0); + s.setSpan(new StyleSpan(Typeface.ITALIC), s.length() - 14, s.length(), 0); + s.setSpan(new ForegroundColorSpan(ColorTemplate.getHoloBlue()), s.length() - 14, s.length(), 0); + return s; + } + + @Override + public void onValueSelected(Entry e, Highlight h) { + + if (e == null) + return; + Log.i("VAL SELECTED", + "Value: " + e.getY() + ", xIndex: " + e.getX() + + ", DataSet index: " + h.getDataSetIndex()); + } + + @Override + public void onNothingSelected() { + Log.i("PieChart", "nothing selected"); + } + + @Override + public void onStartTrackingTouch(SeekBar seekBar) {} + + @Override + public void onStopTrackingTouch(SeekBar seekBar) {} +} diff --git a/MPChartExample/src/main/java/com/xxmassdeveloper/mpchartexample/RadarChartActivity.java b/MPChartExample/src/main/java/com/xxmassdeveloper/mpchartexample/RadarChartActivity.java new file mode 100644 index 00000000..883eb7df --- /dev/null +++ b/MPChartExample/src/main/java/com/xxmassdeveloper/mpchartexample/RadarChartActivity.java @@ -0,0 +1,260 @@ + +package com.xxmassdeveloper.mpchartexample; + +import android.Manifest; +import android.content.Intent; +import android.content.pm.PackageManager; +import android.graphics.Color; +import android.net.Uri; +import android.os.Bundle; +import androidx.core.content.ContextCompat; +import android.view.Menu; +import android.view.MenuItem; +import android.view.WindowManager; + +import com.github.mikephil.charting.animation.Easing; +import com.github.mikephil.charting.charts.RadarChart; +import com.github.mikephil.charting.components.AxisBase; +import com.github.mikephil.charting.components.Legend; +import com.github.mikephil.charting.components.MarkerView; +import com.github.mikephil.charting.components.XAxis; +import com.github.mikephil.charting.components.YAxis; +import com.github.mikephil.charting.data.RadarData; +import com.github.mikephil.charting.data.RadarDataSet; +import com.github.mikephil.charting.data.RadarEntry; +import com.github.mikephil.charting.formatter.IAxisValueFormatter; +import com.github.mikephil.charting.interfaces.datasets.IDataSet; +import com.github.mikephil.charting.interfaces.datasets.IRadarDataSet; +import com.xxmassdeveloper.mpchartexample.custom.RadarMarkerView; +import com.xxmassdeveloper.mpchartexample.notimportant.DemoBase; + +import java.util.ArrayList; + +public class RadarChartActivity extends DemoBase { + + private RadarChart chart; + + @Override + protected void onCreate(Bundle savedInstanceState) { + super.onCreate(savedInstanceState); + getWindow().setFlags(WindowManager.LayoutParams.FLAG_FULLSCREEN, + WindowManager.LayoutParams.FLAG_FULLSCREEN); + setContentView(R.layout.activity_radarchart); + + setTitle("RadarChartActivity"); + + chart = findViewById(R.id.chart1); + chart.setBackgroundColor(Color.rgb(60, 65, 82)); + + chart.getDescription().setEnabled(false); + + chart.setWebLineWidth(1f); + chart.setWebColor(Color.LTGRAY); + chart.setWebLineWidthInner(1f); + chart.setWebColorInner(Color.LTGRAY); + chart.setWebAlpha(100); + + // create a custom MarkerView (extend MarkerView) and specify the layout + // to use for it + MarkerView mv = new RadarMarkerView(this, R.layout.radar_markerview); + mv.setChartView(chart); // For bounds control + chart.setMarker(mv); // Set the marker to the chart + + setData(); + + chart.animateXY(1400, 1400, Easing.EaseInOutQuad); + + XAxis xAxis = chart.getXAxis(); + xAxis.setTypeface(tfLight); + xAxis.setTextSize(9f); + xAxis.setYOffset(0f); + xAxis.setXOffset(0f); + xAxis.setValueFormatter(new IAxisValueFormatter() { + + private final String[] mActivities = new String[]{"Burger", "Steak", "Salad", "Pasta", "Pizza"}; + + @Override + public String getFormattedValue(float value, AxisBase axis) { + return mActivities[(int) value % mActivities.length]; + } + }); + xAxis.setTextColor(Color.WHITE); + + YAxis yAxis = chart.getYAxis(); + yAxis.setTypeface(tfLight); + yAxis.setLabelCount(5, false); + yAxis.setTextSize(9f); + yAxis.setAxisMinimum(0f); + yAxis.setAxisMaximum(80f); + yAxis.setDrawLabels(false); + + Legend l = chart.getLegend(); + l.setVerticalAlignment(Legend.LegendVerticalAlignment.TOP); + l.setHorizontalAlignment(Legend.LegendHorizontalAlignment.CENTER); + l.setOrientation(Legend.LegendOrientation.HORIZONTAL); + l.setDrawInside(false); + l.setTypeface(tfLight); + l.setXEntrySpace(7f); + l.setYEntrySpace(5f); + l.setTextColor(Color.WHITE); + } + + private void setData() { + + float mul = 80; + float min = 20; + int cnt = 5; + + ArrayList<RadarEntry> entries1 = new ArrayList<>(); + ArrayList<RadarEntry> entries2 = new ArrayList<>(); + + // NOTE: The order of the entries when being added to the entries array determines their position around the center of + // the chart. + for (int i = 0; i < cnt; i++) { + float val1 = (float) (Math.random() * mul) + min; + entries1.add(new RadarEntry(val1)); + + float val2 = (float) (Math.random() * mul) + min; + entries2.add(new RadarEntry(val2)); + } + + RadarDataSet set1 = new RadarDataSet(entries1, "Last Week"); + set1.setColor(Color.rgb(103, 110, 129)); + set1.setFillColor(Color.rgb(103, 110, 129)); + set1.setDrawFilled(true); + set1.setFillAlpha(180); + set1.setLineWidth(2f); + set1.setDrawHighlightCircleEnabled(true); + set1.setDrawHighlightIndicators(false); + + RadarDataSet set2 = new RadarDataSet(entries2, "This Week"); + set2.setColor(Color.rgb(121, 162, 175)); + set2.setFillColor(Color.rgb(121, 162, 175)); + set2.setDrawFilled(true); + set2.setFillAlpha(180); + set2.setLineWidth(2f); + set2.setDrawHighlightCircleEnabled(true); + set2.setDrawHighlightIndicators(false); + + ArrayList<IRadarDataSet> sets = new ArrayList<>(); + sets.add(set1); + sets.add(set2); + + RadarData data = new RadarData(sets); + data.setValueTypeface(tfLight); + data.setValueTextSize(8f); + data.setDrawValues(false); + data.setValueTextColor(Color.WHITE); + + chart.setData(data); + chart.invalidate(); + } + + @Override + public boolean onCreateOptionsMenu(Menu menu) { + getMenuInflater().inflate(R.menu.radar, menu); + return true; + } + + @Override + public boolean onOptionsItemSelected(MenuItem item) { + + switch (item.getItemId()) { + case R.id.viewGithub: { + Intent i = new Intent(Intent.ACTION_VIEW); + i.setData(Uri.parse("https://github.com/PhilJay/MPAndroidChart/blob/master/MPChartExample/src/com/xxmassdeveloper/mpchartexample/RadarChartActivity.java")); + startActivity(i); + break; + } + case R.id.actionToggleValues: { + for (IDataSet<?> set : chart.getData().getDataSets()) + set.setDrawValues(!set.isDrawValuesEnabled()); + + chart.invalidate(); + break; + } + case R.id.actionToggleHighlight: { + if (chart.getData() != null) { + chart.getData().setHighlightEnabled(!chart.getData().isHighlightEnabled()); + chart.invalidate(); + } + break; + } + case R.id.actionToggleRotate: { + if (chart.isRotationEnabled()) + chart.setRotationEnabled(false); + else + chart.setRotationEnabled(true); + chart.invalidate(); + break; + } + case R.id.actionToggleFilled: { + + ArrayList<IRadarDataSet> sets = (ArrayList<IRadarDataSet>) chart.getData() + .getDataSets(); + + for (IRadarDataSet set : sets) { + if (set.isDrawFilledEnabled()) + set.setDrawFilled(false); + else + set.setDrawFilled(true); + } + chart.invalidate(); + break; + } + case R.id.actionToggleHighlightCircle: { + + ArrayList<IRadarDataSet> sets = (ArrayList<IRadarDataSet>) chart.getData() + .getDataSets(); + + for (IRadarDataSet set : sets) { + set.setDrawHighlightCircleEnabled(!set.isDrawHighlightCircleEnabled()); + } + chart.invalidate(); + break; + } + case R.id.actionToggleXLabels: { + chart.getXAxis().setEnabled(!chart.getXAxis().isEnabled()); + chart.notifyDataSetChanged(); + chart.invalidate(); + break; + } + case R.id.actionToggleYLabels: { + + chart.getYAxis().setEnabled(!chart.getYAxis().isEnabled()); + chart.invalidate(); + break; + } + case R.id.animateX: { + chart.animateX(1400); + break; + } + case R.id.animateY: { + chart.animateY(1400); + break; + } + case R.id.animateXY: { + chart.animateXY(1400, 1400); + break; + } + case R.id.actionToggleSpin: { + chart.spin(2000, chart.getRotationAngle(), chart.getRotationAngle() + 360, Easing.EaseInOutCubic); + break; + } + case R.id.actionSave: { + if (ContextCompat.checkSelfPermission(this, Manifest.permission.WRITE_EXTERNAL_STORAGE) == PackageManager.PERMISSION_GRANTED) { + saveToGallery(); + } else { + requestStoragePermission(chart); + } + break; + } + } + return true; + } + + @Override + protected void saveToGallery() { + saveToGallery(chart, "RadarChartActivity"); + } +} diff --git a/MPChartExample/src/main/java/com/xxmassdeveloper/mpchartexample/RealtimeLineChartActivity.java b/MPChartExample/src/main/java/com/xxmassdeveloper/mpchartexample/RealtimeLineChartActivity.java new file mode 100644 index 00000000..e26c460f --- /dev/null +++ b/MPChartExample/src/main/java/com/xxmassdeveloper/mpchartexample/RealtimeLineChartActivity.java @@ -0,0 +1,249 @@ + +package com.xxmassdeveloper.mpchartexample; + +import android.Manifest; +import android.content.Intent; +import android.content.pm.PackageManager; +import android.graphics.Color; +import android.net.Uri; +import android.os.Bundle; +import androidx.core.content.ContextCompat; +import android.util.Log; +import android.view.Menu; +import android.view.MenuItem; +import android.view.WindowManager; +import android.widget.Toast; + +import com.github.mikephil.charting.charts.LineChart; +import com.github.mikephil.charting.components.Legend; +import com.github.mikephil.charting.components.Legend.LegendForm; +import com.github.mikephil.charting.components.XAxis; +import com.github.mikephil.charting.components.YAxis; +import com.github.mikephil.charting.components.YAxis.AxisDependency; +import com.github.mikephil.charting.data.Entry; +import com.github.mikephil.charting.data.LineData; +import com.github.mikephil.charting.data.LineDataSet; +import com.github.mikephil.charting.highlight.Highlight; +import com.github.mikephil.charting.interfaces.datasets.ILineDataSet; +import com.github.mikephil.charting.listener.OnChartValueSelectedListener; +import com.github.mikephil.charting.utils.ColorTemplate; +import com.xxmassdeveloper.mpchartexample.notimportant.DemoBase; + +public class RealtimeLineChartActivity extends DemoBase implements + OnChartValueSelectedListener { + + private LineChart chart; + + @Override + protected void onCreate(Bundle savedInstanceState) { + super.onCreate(savedInstanceState); + getWindow().setFlags(WindowManager.LayoutParams.FLAG_FULLSCREEN, + WindowManager.LayoutParams.FLAG_FULLSCREEN); + setContentView(R.layout.activity_realtime_linechart); + + setTitle("RealtimeLineChartActivity"); + + chart = findViewById(R.id.chart1); + chart.setOnChartValueSelectedListener(this); + + // enable description text + chart.getDescription().setEnabled(true); + + // enable touch gestures + chart.setTouchEnabled(true); + + // enable scaling and dragging + chart.setDragEnabled(true); + chart.setScaleEnabled(true); + chart.setDrawGridBackground(false); + + // if disabled, scaling can be done on x- and y-axis separately + chart.setPinchZoom(true); + + // set an alternative background color + chart.setBackgroundColor(Color.LTGRAY); + + LineData data = new LineData(); + data.setValueTextColor(Color.WHITE); + + // add empty data + chart.setData(data); + + // get the legend (only possible after setting data) + Legend l = chart.getLegend(); + + // modify the legend ... + l.setForm(LegendForm.LINE); + l.setTypeface(tfLight); + l.setTextColor(Color.WHITE); + + XAxis xl = chart.getXAxis(); + xl.setTypeface(tfLight); + xl.setTextColor(Color.WHITE); + xl.setDrawGridLines(false); + xl.setAvoidFirstLastClipping(true); + xl.setEnabled(true); + + YAxis leftAxis = chart.getAxisLeft(); + leftAxis.setTypeface(tfLight); + leftAxis.setTextColor(Color.WHITE); + leftAxis.setAxisMaximum(100f); + leftAxis.setAxisMinimum(0f); + leftAxis.setDrawGridLines(true); + + YAxis rightAxis = chart.getAxisRight(); + rightAxis.setEnabled(false); + + } + + private void addEntry() { + + LineData data = chart.getData(); + + if (data != null) { + + ILineDataSet set = data.getDataSetByIndex(0); + // set.addEntry(...); // can be called as well + + if (set == null) { + set = createSet(); + data.addDataSet(set); + } + + data.addEntry(new Entry(set.getEntryCount(), (float) (Math.random() * 40) + 30f), 0); + data.notifyDataChanged(); + + // let the chart know it's data has changed + chart.notifyDataSetChanged(); + + // limit the number of visible entries + chart.setVisibleXRangeMaximum(120); + // chart.setVisibleYRange(30, AxisDependency.LEFT); + + // move to the latest entry + chart.moveViewToX(data.getEntryCount()); + + // this automatically refreshes the chart (calls invalidate()) + // chart.moveViewTo(data.getXValCount()-7, 55f, + // AxisDependency.LEFT); + } + } + + private LineDataSet createSet() { + + LineDataSet set = new LineDataSet(null, "Dynamic Data"); + set.setAxisDependency(AxisDependency.LEFT); + set.setColor(ColorTemplate.getHoloBlue()); + set.setCircleColor(Color.WHITE); + set.setLineWidth(2f); + set.setCircleRadius(4f); + set.setFillAlpha(65); + set.setFillColor(ColorTemplate.getHoloBlue()); + set.setHighLightColor(Color.rgb(244, 117, 117)); + set.setValueTextColor(Color.WHITE); + set.setValueTextSize(9f); + set.setDrawValues(false); + return set; + } + + private Thread thread; + + private void feedMultiple() { + + if (thread != null) + thread.interrupt(); + + final Runnable runnable = new Runnable() { + + @Override + public void run() { + addEntry(); + } + }; + + thread = new Thread(new Runnable() { + + @Override + public void run() { + for (int i = 0; i < 1000; i++) { + + // Don't generate garbage runnables inside the loop. + runOnUiThread(runnable); + + try { + Thread.sleep(25); + } catch (InterruptedException e) { + e.printStackTrace(); + } + } + } + }); + + thread.start(); + } + + @Override + public boolean onCreateOptionsMenu(Menu menu) { + getMenuInflater().inflate(R.menu.realtime, menu); + return true; + } + + @Override + public boolean onOptionsItemSelected(MenuItem item) { + + switch (item.getItemId()) { + case R.id.viewGithub: { + Intent i = new Intent(Intent.ACTION_VIEW); + i.setData(Uri.parse("https://github.com/PhilJay/MPAndroidChart/blob/master/MPChartExample/src/com/xxmassdeveloper/mpchartexample/RealtimeLineChartActivity.java")); + startActivity(i); + break; + } + case R.id.actionAdd: { + addEntry(); + break; + } + case R.id.actionClear: { + chart.clearValues(); + Toast.makeText(this, "Chart cleared!", Toast.LENGTH_SHORT).show(); + break; + } + case R.id.actionFeedMultiple: { + feedMultiple(); + break; + } + case R.id.actionSave: { + if (ContextCompat.checkSelfPermission(this, Manifest.permission.WRITE_EXTERNAL_STORAGE) == PackageManager.PERMISSION_GRANTED) { + saveToGallery(); + } else { + requestStoragePermission(chart); + } + break; + } + } + return true; + } + + @Override + protected void saveToGallery() { + saveToGallery(chart, "RealtimeLineChartActivity"); + } + + @Override + public void onValueSelected(Entry e, Highlight h) { + Log.i("Entry selected", e.toString()); + } + + @Override + public void onNothingSelected() { + Log.i("Nothing selected", "Nothing selected."); + } + + @Override + protected void onPause() { + super.onPause(); + + if (thread != null) { + thread.interrupt(); + } + } +} diff --git a/MPChartExample/src/main/java/com/xxmassdeveloper/mpchartexample/ScatterChartActivity.java b/MPChartExample/src/main/java/com/xxmassdeveloper/mpchartexample/ScatterChartActivity.java new file mode 100644 index 00000000..e51755ad --- /dev/null +++ b/MPChartExample/src/main/java/com/xxmassdeveloper/mpchartexample/ScatterChartActivity.java @@ -0,0 +1,247 @@ + +package com.xxmassdeveloper.mpchartexample; + +import android.Manifest; +import android.content.Intent; +import android.content.pm.PackageManager; +import android.net.Uri; +import android.os.Bundle; +import androidx.core.content.ContextCompat; +import android.util.Log; +import android.view.Menu; +import android.view.MenuItem; +import android.view.WindowManager; +import android.widget.SeekBar; +import android.widget.SeekBar.OnSeekBarChangeListener; +import android.widget.TextView; + +import com.github.mikephil.charting.charts.ScatterChart; +import com.github.mikephil.charting.components.Legend; +import com.github.mikephil.charting.components.XAxis; +import com.github.mikephil.charting.components.YAxis; +import com.github.mikephil.charting.data.Entry; +import com.github.mikephil.charting.data.ScatterData; +import com.github.mikephil.charting.data.ScatterDataSet; +import com.github.mikephil.charting.highlight.Highlight; +import com.github.mikephil.charting.interfaces.datasets.IScatterDataSet; +import com.github.mikephil.charting.listener.OnChartValueSelectedListener; +import com.github.mikephil.charting.utils.ColorTemplate; +import com.xxmassdeveloper.mpchartexample.custom.CustomScatterShapeRenderer; +import com.xxmassdeveloper.mpchartexample.notimportant.DemoBase; + +import java.util.ArrayList; +import java.util.List; + +public class ScatterChartActivity extends DemoBase implements OnSeekBarChangeListener, + OnChartValueSelectedListener { + + private ScatterChart chart; + private SeekBar seekBarX, seekBarY; + private TextView tvX, tvY; + + @Override + protected void onCreate(Bundle savedInstanceState) { + super.onCreate(savedInstanceState); + getWindow().setFlags(WindowManager.LayoutParams.FLAG_FULLSCREEN, + WindowManager.LayoutParams.FLAG_FULLSCREEN); + setContentView(R.layout.activity_scatterchart); + + setTitle("ScatterChartActivity"); + + tvX = findViewById(R.id.tvXMax); + tvY = findViewById(R.id.tvYMax); + + seekBarX = findViewById(R.id.seekBar1); + seekBarX.setOnSeekBarChangeListener(this); + + seekBarY = findViewById(R.id.seekBar2); + seekBarY.setOnSeekBarChangeListener(this); + + chart = findViewById(R.id.chart1); + chart.getDescription().setEnabled(false); + chart.setOnChartValueSelectedListener(this); + + chart.setDrawGridBackground(false); + chart.setTouchEnabled(true); + chart.setMaxHighlightDistance(50f); + + // enable scaling and dragging + chart.setDragEnabled(true); + chart.setScaleEnabled(true); + + chart.setMaxVisibleValueCount(200); + chart.setPinchZoom(true); + + seekBarX.setProgress(45); + seekBarY.setProgress(100); + + Legend l = chart.getLegend(); + l.setVerticalAlignment(Legend.LegendVerticalAlignment.TOP); + l.setHorizontalAlignment(Legend.LegendHorizontalAlignment.RIGHT); + l.setOrientation(Legend.LegendOrientation.VERTICAL); + l.setDrawInside(false); + l.setTypeface(tfLight); + l.setXOffset(5f); + + YAxis yl = chart.getAxisLeft(); + yl.setTypeface(tfLight); + yl.setAxisMinimum(0f); // this replaces setStartAtZero(true) + + chart.getAxisRight().setEnabled(false); + + XAxis xl = chart.getXAxis(); + xl.setTypeface(tfLight); + xl.setDrawGridLines(false); + } + + @Override + public void onProgressChanged(SeekBar seekBar, int progress, boolean fromUser) { + + tvX.setText(String.valueOf(seekBarX.getProgress())); + tvY.setText(String.valueOf(seekBarY.getProgress())); + + ArrayList<Entry> values1 = new ArrayList<>(); + ArrayList<Entry> values2 = new ArrayList<>(); + ArrayList<Entry> values3 = new ArrayList<>(); + + for (int i = 0; i < seekBarX.getProgress(); i++) { + float val = (float) (Math.random() * seekBarY.getProgress()) + 3; + values1.add(new Entry(i, val)); + } + + for (int i = 0; i < seekBarX.getProgress(); i++) { + float val = (float) (Math.random() * seekBarY.getProgress()) + 3; + values2.add(new Entry(i+0.33f, val)); + } + + for (int i = 0; i < seekBarX.getProgress(); i++) { + float val = (float) (Math.random() * seekBarY.getProgress()) + 3; + values3.add(new Entry(i+0.66f, val)); + } + + // create a dataset and give it a type + ScatterDataSet set1 = new ScatterDataSet(values1, "DS 1"); + set1.setScatterShape(ScatterChart.ScatterShape.SQUARE); + set1.setColor(ColorTemplate.COLORFUL_COLORS[0]); + ScatterDataSet set2 = new ScatterDataSet(values2, "DS 2"); + set2.setScatterShape(ScatterChart.ScatterShape.CIRCLE); + set2.setScatterShapeHoleColor(ColorTemplate.COLORFUL_COLORS[3]); + set2.setScatterShapeHoleRadius(3f); + set2.setColor(ColorTemplate.COLORFUL_COLORS[1]); + ScatterDataSet set3 = new ScatterDataSet(values3, "DS 3"); + set3.setShapeRenderer(new CustomScatterShapeRenderer()); + set3.setColor(ColorTemplate.COLORFUL_COLORS[2]); + + set1.setScatterShapeSize(8f); + set2.setScatterShapeSize(8f); + set3.setScatterShapeSize(8f); + + ArrayList<IScatterDataSet> dataSets = new ArrayList<>(); + dataSets.add(set1); // add the data sets + dataSets.add(set2); + dataSets.add(set3); + + // create a data object with the data sets + ScatterData data = new ScatterData(dataSets); + data.setValueTypeface(tfLight); + + chart.setData(data); + chart.invalidate(); + } + + @Override + public boolean onCreateOptionsMenu(Menu menu) { + getMenuInflater().inflate(R.menu.scatter, menu); + return true; + } + + @Override + public boolean onOptionsItemSelected(MenuItem item) { + + switch (item.getItemId()) { + case R.id.viewGithub: { + Intent i = new Intent(Intent.ACTION_VIEW); + i.setData(Uri.parse("https://github.com/PhilJay/MPAndroidChart/blob/master/MPChartExample/src/com/xxmassdeveloper/mpchartexample/ScatterChartActivity.java")); + startActivity(i); + break; + } + case R.id.actionToggleValues: { + List<IScatterDataSet> sets = chart.getData() + .getDataSets(); + + for (IScatterDataSet iSet : sets) { + + ScatterDataSet set = (ScatterDataSet) iSet; + set.setDrawValues(!set.isDrawValuesEnabled()); + } + + chart.invalidate(); + break; + } + case R.id.actionToggleHighlight: { + if(chart.getData() != null) { + chart.getData().setHighlightEnabled(!chart.getData().isHighlightEnabled()); + chart.invalidate(); + } + break; + } + case R.id.actionTogglePinch: { + if (chart.isPinchZoomEnabled()) + chart.setPinchZoom(false); + else + chart.setPinchZoom(true); + + chart.invalidate(); + break; + } + case R.id.actionToggleAutoScaleMinMax: { + chart.setAutoScaleMinMaxEnabled(!chart.isAutoScaleMinMaxEnabled()); + chart.notifyDataSetChanged(); + break; + } + case R.id.animateX: { + chart.animateX(3000); + break; + } + case R.id.animateY: { + chart.animateY(3000); + break; + } + case R.id.animateXY: { + + chart.animateXY(3000, 3000); + break; + } + case R.id.actionSave: { + if (ContextCompat.checkSelfPermission(this, Manifest.permission.WRITE_EXTERNAL_STORAGE) == PackageManager.PERMISSION_GRANTED) { + saveToGallery(); + } else { + requestStoragePermission(chart); + } + break; + } + } + return true; + } + + @Override + protected void saveToGallery() { + saveToGallery(chart, "ScatterChartActivity"); + } + + @Override + public void onValueSelected(Entry e, Highlight h) { + Log.i("VAL SELECTED", + "Value: " + e.getY() + ", xIndex: " + e.getX() + + ", DataSet index: " + h.getDataSetIndex()); + } + + @Override + public void onNothingSelected() {} + + @Override + public void onStartTrackingTouch(SeekBar seekBar) {} + + @Override + public void onStopTrackingTouch(SeekBar seekBar) {} +} diff --git a/MPChartExample/src/main/java/com/xxmassdeveloper/mpchartexample/ScrollViewActivity.java b/MPChartExample/src/main/java/com/xxmassdeveloper/mpchartexample/ScrollViewActivity.java new file mode 100644 index 00000000..37de64d7 --- /dev/null +++ b/MPChartExample/src/main/java/com/xxmassdeveloper/mpchartexample/ScrollViewActivity.java @@ -0,0 +1,101 @@ + +package com.xxmassdeveloper.mpchartexample; + +import android.content.Intent; +import android.net.Uri; +import android.os.Bundle; +import android.view.Menu; +import android.view.MenuItem; +import android.view.WindowManager; + +import com.github.mikephil.charting.charts.BarChart; +import com.github.mikephil.charting.components.XAxis; +import com.github.mikephil.charting.components.XAxis.XAxisPosition; +import com.github.mikephil.charting.data.BarData; +import com.github.mikephil.charting.data.BarDataSet; +import com.github.mikephil.charting.data.BarEntry; +import com.github.mikephil.charting.utils.ColorTemplate; +import com.xxmassdeveloper.mpchartexample.notimportant.DemoBase; + +import java.util.ArrayList; + +@SuppressWarnings("SameParameterValue") +public class ScrollViewActivity extends DemoBase { + + private BarChart chart; + + @Override + protected void onCreate(Bundle savedInstanceState) { + super.onCreate(savedInstanceState); + getWindow().setFlags(WindowManager.LayoutParams.FLAG_FULLSCREEN, + WindowManager.LayoutParams.FLAG_FULLSCREEN); + setContentView(R.layout.activity_scrollview); + + setTitle("ScrollViewActivity"); + + chart = findViewById(R.id.chart1); + + chart.getDescription().setEnabled(false); + + // scaling can now only be done on x- and y-axis separately + chart.setPinchZoom(false); + + chart.setDrawBarShadow(false); + chart.setDrawGridBackground(false); + + XAxis xAxis = chart.getXAxis(); + xAxis.setPosition(XAxisPosition.BOTTOM); + xAxis.setDrawGridLines(false); + + chart.getAxisLeft().setDrawGridLines(false); + + chart.getLegend().setEnabled(false); + + setData(10); + chart.setFitBars(true); + } + + private void setData(int count) { + + ArrayList<BarEntry> values = new ArrayList<>(); + + for (int i = 0; i < count; i++) { + float val = (float) (Math.random() * count) + 15; + values.add(new BarEntry(i, (int) val)); + } + + BarDataSet set = new BarDataSet(values, "Data Set"); + set.setColors(ColorTemplate.VORDIPLOM_COLORS); + set.setDrawValues(false); + + BarData data = new BarData(set); + + chart.setData(data); + chart.invalidate(); + chart.animateY(800); + } + + @Override + public boolean onCreateOptionsMenu(Menu menu) { + getMenuInflater().inflate(R.menu.only_github, menu); + return true; + } + + @Override + public boolean onOptionsItemSelected(MenuItem item) { + + switch (item.getItemId()) { + case R.id.viewGithub: { + Intent i = new Intent(Intent.ACTION_VIEW); + i.setData(Uri.parse("https://github.com/PhilJay/MPAndroidChart/blob/master/MPChartExample/src/com/xxmassdeveloper/mpchartexample/ScrollViewActivity.java")); + startActivity(i); + break; + } + } + + return true; + } + + @Override + public void saveToGallery() { /* Intentionally left empty */ } +} diff --git a/MPChartExample/src/main/java/com/xxmassdeveloper/mpchartexample/StackedBarActivity.java b/MPChartExample/src/main/java/com/xxmassdeveloper/mpchartexample/StackedBarActivity.java new file mode 100644 index 00000000..676e0e62 --- /dev/null +++ b/MPChartExample/src/main/java/com/xxmassdeveloper/mpchartexample/StackedBarActivity.java @@ -0,0 +1,284 @@ +package com.xxmassdeveloper.mpchartexample; + +import android.Manifest; +import android.content.Intent; +import android.content.pm.PackageManager; +import android.graphics.Color; +import android.net.Uri; +import android.os.Bundle; +import androidx.core.content.ContextCompat; +import android.util.Log; +import android.view.Menu; +import android.view.MenuItem; +import android.view.WindowManager; +import android.widget.SeekBar; +import android.widget.SeekBar.OnSeekBarChangeListener; +import android.widget.TextView; + +import com.github.mikephil.charting.charts.BarChart; +import com.github.mikephil.charting.components.Legend; +import com.github.mikephil.charting.components.XAxis; +import com.github.mikephil.charting.components.XAxis.XAxisPosition; +import com.github.mikephil.charting.components.YAxis; +import com.github.mikephil.charting.data.BarData; +import com.github.mikephil.charting.data.BarDataSet; +import com.github.mikephil.charting.data.BarEntry; +import com.github.mikephil.charting.data.Entry; +import com.github.mikephil.charting.highlight.Highlight; +import com.github.mikephil.charting.interfaces.datasets.IBarDataSet; +import com.github.mikephil.charting.listener.OnChartValueSelectedListener; +import com.github.mikephil.charting.utils.ColorTemplate; +import com.xxmassdeveloper.mpchartexample.custom.MyAxisValueFormatter; +import com.xxmassdeveloper.mpchartexample.custom.MyValueFormatter; +import com.xxmassdeveloper.mpchartexample.notimportant.DemoBase; + +import java.util.ArrayList; +import java.util.List; + +public class StackedBarActivity extends DemoBase implements OnSeekBarChangeListener, OnChartValueSelectedListener { + + private BarChart chart; + private SeekBar seekBarX, seekBarY; + private TextView tvX, tvY; + + @Override + protected void onCreate(Bundle savedInstanceState) { + super.onCreate(savedInstanceState); + getWindow().setFlags(WindowManager.LayoutParams.FLAG_FULLSCREEN, WindowManager.LayoutParams.FLAG_FULLSCREEN); + setContentView(R.layout.activity_barchart); + + setTitle("StackedBarActivity"); + + tvX = findViewById(R.id.tvXMax); + tvY = findViewById(R.id.tvYMax); + + seekBarX = findViewById(R.id.seekBar1); + seekBarX.setOnSeekBarChangeListener(this); + + seekBarY = findViewById(R.id.seekBar2); + seekBarY.setOnSeekBarChangeListener(this); + + chart = findViewById(R.id.chart1); + chart.setOnChartValueSelectedListener(this); + + chart.getDescription().setEnabled(false); + + // if more than 60 entries are displayed in the chart, no values will be + // drawn + chart.setMaxVisibleValueCount(40); + + // scaling can now only be done on x- and y-axis separately + chart.setPinchZoom(false); + + chart.setDrawGridBackground(false); + chart.setDrawBarShadow(false); + + chart.setDrawValueAboveBar(false); + chart.setHighlightFullBarEnabled(false); + + // change the position of the y-labels + YAxis leftAxis = chart.getAxisLeft(); + leftAxis.setValueFormatter(new MyAxisValueFormatter()); + leftAxis.setAxisMinimum(0f); // this replaces setStartAtZero(true) + chart.getAxisRight().setEnabled(false); + + XAxis xLabels = chart.getXAxis(); + xLabels.setPosition(XAxisPosition.TOP); + + // chart.setDrawXLabels(false); + // chart.setDrawYLabels(false); + + // setting data + seekBarX.setProgress(12); + seekBarY.setProgress(100); + + Legend l = chart.getLegend(); + l.setVerticalAlignment(Legend.LegendVerticalAlignment.BOTTOM); + l.setHorizontalAlignment(Legend.LegendHorizontalAlignment.RIGHT); + l.setOrientation(Legend.LegendOrientation.HORIZONTAL); + l.setDrawInside(false); + l.setFormSize(8f); + l.setFormToTextSpace(4f); + l.setXEntrySpace(6f); + + // chart.setDrawLegend(false); + } + + @Override + public void onProgressChanged(SeekBar seekBar, int progress, boolean fromUser) { + + tvX.setText(String.valueOf(seekBarX.getProgress())); + tvY.setText(String.valueOf(seekBarY.getProgress())); + + ArrayList<BarEntry> values = new ArrayList<>(); + + for (int i = 0; i < seekBarX.getProgress(); i++) { + float mul = (seekBarY.getProgress() + 1); + float val1 = (float) (Math.random() * mul) + mul / 3; + float val2 = (float) (Math.random() * mul) + mul / 3; + float val3 = (float) (Math.random() * mul) + mul / 3; + + values.add(new BarEntry( + i, + new float[]{val1, val2, val3}, + getResources().getDrawable(R.drawable.star))); + } + + BarDataSet set1; + + if (chart.getData() != null && + chart.getData().getDataSetCount() > 0) { + set1 = (BarDataSet) chart.getData().getDataSetByIndex(0); + set1.setValues(values); + chart.getData().notifyDataChanged(); + chart.notifyDataSetChanged(); + } else { + set1 = new BarDataSet(values, "Statistics Vienna 2014"); + set1.setDrawIcons(false); + set1.setColors(getColors()); + set1.setStackLabels(new String[]{"Births", "Divorces", "Marriages"}); + + ArrayList<IBarDataSet> dataSets = new ArrayList<>(); + dataSets.add(set1); + + BarData data = new BarData(dataSets); + data.setValueFormatter(new MyValueFormatter()); + data.setValueTextColor(Color.WHITE); + + chart.setData(data); + } + + chart.setFitBars(true); + chart.invalidate(); + } + + @Override + public boolean onCreateOptionsMenu(Menu menu) { + getMenuInflater().inflate(R.menu.bar, menu); + return true; + } + + @Override + public boolean onOptionsItemSelected(MenuItem item) { + + switch (item.getItemId()) { + case R.id.viewGithub: { + Intent i = new Intent(Intent.ACTION_VIEW); + i.setData(Uri.parse("https://github.com/PhilJay/MPAndroidChart/blob/master/MPChartExample/src/com/xxmassdeveloper/mpchartexample/StackedBarActivity.java")); + startActivity(i); + break; + } + case R.id.actionToggleValues: { + List<IBarDataSet> sets = chart.getData() + .getDataSets(); + + for (IBarDataSet iSet : sets) { + + BarDataSet set = (BarDataSet) iSet; + set.setDrawValues(!set.isDrawValuesEnabled()); + } + + chart.invalidate(); + break; + } + case R.id.actionToggleIcons: { + List<IBarDataSet> sets = chart.getData() + .getDataSets(); + + for (IBarDataSet iSet : sets) { + + BarDataSet set = (BarDataSet) iSet; + set.setDrawIcons(!set.isDrawIconsEnabled()); + } + + chart.invalidate(); + break; + } + case R.id.actionToggleHighlight: { + if (chart.getData() != null) { + chart.getData().setHighlightEnabled(!chart.getData().isHighlightEnabled()); + chart.invalidate(); + } + break; + } + case R.id.actionTogglePinch: { + if (chart.isPinchZoomEnabled()) + chart.setPinchZoom(false); + else + chart.setPinchZoom(true); + + chart.invalidate(); + break; + } + case R.id.actionToggleAutoScaleMinMax: { + chart.setAutoScaleMinMaxEnabled(!chart.isAutoScaleMinMaxEnabled()); + chart.notifyDataSetChanged(); + break; + } + case R.id.actionToggleBarBorders: { + for (IBarDataSet set : chart.getData().getDataSets()) + ((BarDataSet) set).setBarBorderWidth(set.getBarBorderWidth() == 1.f ? 0.f : 1.f); + + chart.invalidate(); + break; + } + case R.id.animateX: { + chart.animateX(2000); + break; + } + case R.id.animateY: { + chart.animateY(2000); + break; + } + case R.id.animateXY: { + + chart.animateXY(2000, 2000); + break; + } + case R.id.actionSave: { + if (ContextCompat.checkSelfPermission(this, Manifest.permission.WRITE_EXTERNAL_STORAGE) == PackageManager.PERMISSION_GRANTED) { + saveToGallery(); + } else { + requestStoragePermission(chart); + } + break; + } + } + return true; + } + + @Override + protected void saveToGallery() { + saveToGallery(chart, "StackedBarActivity"); + } + + @Override + public void onStartTrackingTouch(SeekBar seekBar) {} + + @Override + public void onStopTrackingTouch(SeekBar seekBar) {} + + @Override + public void onValueSelected(Entry e, Highlight h) { + + BarEntry entry = (BarEntry) e; + + if (entry.getYVals() != null) + Log.i("VAL SELECTED", "Value: " + entry.getYVals()[h.getStackIndex()]); + else + Log.i("VAL SELECTED", "Value: " + entry.getY()); + } + + @Override + public void onNothingSelected() {} + + private int[] getColors() { + + // have as many colors as stack-values per entry + int[] colors = new int[3]; + + System.arraycopy(ColorTemplate.MATERIAL_COLORS, 0, colors, 0, 3); + + return colors; + } +} diff --git a/MPChartExample/src/main/java/com/xxmassdeveloper/mpchartexample/StackedBarActivityNegative.java b/MPChartExample/src/main/java/com/xxmassdeveloper/mpchartexample/StackedBarActivityNegative.java new file mode 100644 index 00000000..7af58c85 --- /dev/null +++ b/MPChartExample/src/main/java/com/xxmassdeveloper/mpchartexample/StackedBarActivityNegative.java @@ -0,0 +1,265 @@ + +package com.xxmassdeveloper.mpchartexample; + +import android.Manifest; +import android.content.Intent; +import android.content.pm.PackageManager; +import android.graphics.Color; +import android.net.Uri; +import android.os.Bundle; +import androidx.core.content.ContextCompat; +import android.util.Log; +import android.view.Menu; +import android.view.MenuItem; +import android.view.WindowManager; + +import com.github.mikephil.charting.charts.HorizontalBarChart; +import com.github.mikephil.charting.components.AxisBase; +import com.github.mikephil.charting.components.Legend; +import com.github.mikephil.charting.components.XAxis; +import com.github.mikephil.charting.components.XAxis.XAxisPosition; +import com.github.mikephil.charting.components.YAxis; +import com.github.mikephil.charting.data.BarData; +import com.github.mikephil.charting.data.BarDataSet; +import com.github.mikephil.charting.data.BarEntry; +import com.github.mikephil.charting.data.Entry; +import com.github.mikephil.charting.formatter.IValueFormatter; +import com.github.mikephil.charting.formatter.IAxisValueFormatter; +import com.github.mikephil.charting.highlight.Highlight; +import com.github.mikephil.charting.interfaces.datasets.IBarDataSet; +import com.github.mikephil.charting.listener.OnChartValueSelectedListener; +import com.github.mikephil.charting.utils.ViewPortHandler; +import com.xxmassdeveloper.mpchartexample.notimportant.DemoBase; + +import java.text.DecimalFormat; +import java.util.ArrayList; +import java.util.List; + +public class StackedBarActivityNegative extends DemoBase implements + OnChartValueSelectedListener { + + private HorizontalBarChart chart; + + @Override + protected void onCreate(Bundle savedInstanceState) { + super.onCreate(savedInstanceState); + getWindow().setFlags(WindowManager.LayoutParams.FLAG_FULLSCREEN, + WindowManager.LayoutParams.FLAG_FULLSCREEN); + setContentView(R.layout.activity_age_distribution); + + setTitle("StackedBarActivityNegative"); + + chart = findViewById(R.id.chart1); + chart.setOnChartValueSelectedListener(this); + chart.setDrawGridBackground(false); + chart.getDescription().setEnabled(false); + + // scaling can now only be done on x- and y-axis separately + chart.setPinchZoom(false); + + chart.setDrawBarShadow(false); + chart.setDrawValueAboveBar(true); + chart.setHighlightFullBarEnabled(false); + + chart.getAxisLeft().setEnabled(false); + chart.getAxisRight().setAxisMaximum(25f); + chart.getAxisRight().setAxisMinimum(-25f); + chart.getAxisRight().setDrawGridLines(false); + chart.getAxisRight().setDrawZeroLine(true); + chart.getAxisRight().setLabelCount(7, false); + chart.getAxisRight().setValueFormatter(new CustomFormatter()); + chart.getAxisRight().setTextSize(9f); + + XAxis xAxis = chart.getXAxis(); + xAxis.setPosition(XAxisPosition.BOTH_SIDED); + xAxis.setDrawGridLines(false); + xAxis.setDrawAxisLine(false); + xAxis.setTextSize(9f); + xAxis.setAxisMinimum(0f); + xAxis.setAxisMaximum(110f); + xAxis.setCenterAxisLabels(true); + xAxis.setLabelCount(12); + xAxis.setGranularity(10f); + xAxis.setValueFormatter(new IAxisValueFormatter() { + + private final DecimalFormat format = new DecimalFormat("###"); + + @Override + public String getFormattedValue(float value, AxisBase axis) { + return format.format(value) + "-" + format.format(value + 10); + } + }); + + Legend l = chart.getLegend(); + l.setVerticalAlignment(Legend.LegendVerticalAlignment.BOTTOM); + l.setHorizontalAlignment(Legend.LegendHorizontalAlignment.RIGHT); + l.setOrientation(Legend.LegendOrientation.HORIZONTAL); + l.setDrawInside(false); + l.setFormSize(8f); + l.setFormToTextSpace(4f); + l.setXEntrySpace(6f); + + // IMPORTANT: When using negative values in stacked bars, always make sure the negative values are in the array first + ArrayList<BarEntry> values = new ArrayList<>(); + values.add(new BarEntry(5, new float[]{ -10, 10 })); + values.add(new BarEntry(15, new float[]{ -12, 13 })); + values.add(new BarEntry(25, new float[]{ -15, 15 })); + values.add(new BarEntry(35, new float[]{ -17, 17 })); + values.add(new BarEntry(45, new float[]{ -19, 20 })); + values.add(new BarEntry(45, new float[]{ -19, 20 }, getResources().getDrawable(R.drawable.star))); + values.add(new BarEntry(55, new float[]{ -19, 19 })); + values.add(new BarEntry(65, new float[]{ -16, 16 })); + values.add(new BarEntry(75, new float[]{ -13, 14 })); + values.add(new BarEntry(85, new float[]{ -10, 11 })); + values.add(new BarEntry(95, new float[]{ -5, 6 })); + values.add(new BarEntry(105, new float[]{ -1, 2 })); + + BarDataSet set = new BarDataSet(values, "Age Distribution"); + set.setDrawIcons(false); + set.setValueFormatter(new CustomFormatter()); + set.setValueTextSize(7f); + set.setAxisDependency(YAxis.AxisDependency.RIGHT); + set.setColors(Color.rgb(67,67,72), Color.rgb(124,181,236)); + set.setStackLabels(new String[]{ + "Men", "Women" + }); + + BarData data = new BarData(set); + data.setBarWidth(8.5f); + chart.setData(data); + chart.invalidate(); + } + + @Override + public boolean onCreateOptionsMenu(Menu menu) { + getMenuInflater().inflate(R.menu.bar, menu); + return true; + } + + @Override + public boolean onOptionsItemSelected(MenuItem item) { + + switch (item.getItemId()) { + case R.id.viewGithub: { + Intent i = new Intent(Intent.ACTION_VIEW); + i.setData(Uri.parse("https://github.com/PhilJay/MPAndroidChart/blob/master/MPChartExample/src/com/xxmassdeveloper/mpchartexample/StackedBarActivityNegative.java")); + startActivity(i); + break; + } + case R.id.actionToggleValues: { + List<IBarDataSet> sets = chart.getData() + .getDataSets(); + + for (IBarDataSet iSet : sets) { + + BarDataSet set = (BarDataSet) iSet; + set.setDrawValues(!set.isDrawValuesEnabled()); + } + + chart.invalidate(); + break; + } + case R.id.actionToggleIcons: { + List<IBarDataSet> sets = chart.getData() + .getDataSets(); + + for (IBarDataSet iSet : sets) { + + BarDataSet set = (BarDataSet) iSet; + set.setDrawIcons(!set.isDrawIconsEnabled()); + } + + chart.invalidate(); + break; + } + case R.id.actionToggleHighlight: { + if(chart.getData() != null) { + chart.getData().setHighlightEnabled(!chart.getData().isHighlightEnabled()); + chart.invalidate(); + } + break; + } + case R.id.actionTogglePinch: { + if (chart.isPinchZoomEnabled()) + chart.setPinchZoom(false); + else + chart.setPinchZoom(true); + + chart.invalidate(); + break; + } + case R.id.actionToggleAutoScaleMinMax: { + chart.setAutoScaleMinMaxEnabled(!chart.isAutoScaleMinMaxEnabled()); + chart.notifyDataSetChanged(); + break; + } + case R.id.actionToggleBarBorders: { + for (IBarDataSet set : chart.getData().getDataSets()) + ((BarDataSet)set).setBarBorderWidth(set.getBarBorderWidth() == 1.f ? 0.f : 1.f); + + chart.invalidate(); + break; + } + case R.id.animateX: { + chart.animateX(3000); + break; + } + case R.id.animateY: { + chart.animateY(3000); + break; + } + case R.id.animateXY: { + + chart.animateXY(3000, 3000); + break; + } + case R.id.actionSave: { + if (ContextCompat.checkSelfPermission(this, Manifest.permission.WRITE_EXTERNAL_STORAGE) == PackageManager.PERMISSION_GRANTED) { + saveToGallery(); + } else { + requestStoragePermission(chart); + } + break; + } + } + return true; + } + + @Override + protected void saveToGallery() { + saveToGallery(chart, "StackedBarActivityNegative"); + } + + @Override + public void onValueSelected(Entry e, Highlight h) { + BarEntry entry = (BarEntry) e; + Log.i("VAL SELECTED", + "Value: " + Math.abs(entry.getYVals()[h.getStackIndex()])); + } + + @Override + public void onNothingSelected() { + Log.i("NOTING SELECTED", ""); + } + + private class CustomFormatter implements IValueFormatter, IAxisValueFormatter { + + private final DecimalFormat mFormat; + + CustomFormatter() { + mFormat = new DecimalFormat("###"); + } + + // data + @Override + public String getFormattedValue(float value, Entry entry, int dataSetIndex, ViewPortHandler viewPortHandler) { + return mFormat.format(Math.abs(value)) + "m"; + } + + // YAxis + @Override + public String getFormattedValue(float value, AxisBase axis) { + return mFormat.format(Math.abs(value)) + "m"; + } + } +} diff --git a/MPChartExample/src/main/java/com/xxmassdeveloper/mpchartexample/custom/CustomScatterShapeRenderer.java b/MPChartExample/src/main/java/com/xxmassdeveloper/mpchartexample/custom/CustomScatterShapeRenderer.java new file mode 100644 index 00000000..6279e395 --- /dev/null +++ b/MPChartExample/src/main/java/com/xxmassdeveloper/mpchartexample/custom/CustomScatterShapeRenderer.java @@ -0,0 +1,30 @@ +package com.xxmassdeveloper.mpchartexample.custom; + +import android.graphics.Canvas; +import android.graphics.Paint; + +import com.github.mikephil.charting.interfaces.datasets.IScatterDataSet; +import com.github.mikephil.charting.renderer.scatter.IShapeRenderer; +import com.github.mikephil.charting.utils.ViewPortHandler; + +/** + * Custom shape renderer that draws a single line. + * Created by philipp on 26/06/16. + */ +public class CustomScatterShapeRenderer implements IShapeRenderer +{ + + @Override + public void renderShape(Canvas c, IScatterDataSet dataSet, ViewPortHandler viewPortHandler, + float posX, float posY, Paint renderPaint) { + + final float shapeHalf = dataSet.getScatterShapeSize() / 2f; + + c.drawLine( + posX - shapeHalf, + posY - shapeHalf, + posX + shapeHalf, + posY + shapeHalf, + renderPaint); + } +} diff --git a/MPChartExample/src/main/java/com/xxmassdeveloper/mpchartexample/custom/DayAxisValueFormatter.java b/MPChartExample/src/main/java/com/xxmassdeveloper/mpchartexample/custom/DayAxisValueFormatter.java new file mode 100644 index 00000000..ba4d860d --- /dev/null +++ b/MPChartExample/src/main/java/com/xxmassdeveloper/mpchartexample/custom/DayAxisValueFormatter.java @@ -0,0 +1,139 @@ +package com.xxmassdeveloper.mpchartexample.custom; + +import com.github.mikephil.charting.charts.BarLineChartBase; +import com.github.mikephil.charting.components.AxisBase; +import com.github.mikephil.charting.formatter.IAxisValueFormatter; + +/** + * Created by philipp on 02/06/16. + */ +public class DayAxisValueFormatter implements IAxisValueFormatter +{ + + private final String[] mMonths = new String[]{ + "Jan", "Feb", "Mar", "Apr", "May", "Jun", "Jul", "Aug", "Sep", "Oct", "Nov", "Dec" + }; + + private final BarLineChartBase<?> chart; + + public DayAxisValueFormatter(BarLineChartBase<?> chart) { + this.chart = chart; + } + + @Override + public String getFormattedValue(float value, AxisBase axis) { + + int days = (int) value; + + int year = determineYear(days); + + int month = determineMonth(days); + String monthName = mMonths[month % mMonths.length]; + String yearName = String.valueOf(year); + + if (chart.getVisibleXRange() > 30 * 6) { + + return monthName + " " + yearName; + } else { + + int dayOfMonth = determineDayOfMonth(days, month + 12 * (year - 2016)); + + String appendix = "th"; + + switch (dayOfMonth) { + case 1: + appendix = "st"; + break; + case 2: + appendix = "nd"; + break; + case 3: + appendix = "rd"; + break; + case 21: + appendix = "st"; + break; + case 22: + appendix = "nd"; + break; + case 23: + appendix = "rd"; + break; + case 31: + appendix = "st"; + break; + } + + return dayOfMonth == 0 ? "" : dayOfMonth + appendix + " " + monthName; + } + } + + private int getDaysForMonth(int month, int year) { + + // month is 0-based + + if (month == 1) { + boolean is29Feb = false; + + if (year < 1582) + is29Feb = (year < 1 ? year + 1 : year) % 4 == 0; + else if (year > 1582) + is29Feb = year % 4 == 0 && (year % 100 != 0 || year % 400 == 0); + + return is29Feb ? 29 : 28; + } + + if (month == 3 || month == 5 || month == 8 || month == 10) + return 30; + else + return 31; + } + + private int determineMonth(int dayOfYear) { + + int month = -1; + int days = 0; + + while (days < dayOfYear) { + month = month + 1; + + if (month >= 12) + month = 0; + + int year = determineYear(days); + days += getDaysForMonth(month, year); + } + + return Math.max(month, 0); + } + + private int determineDayOfMonth(int days, int month) { + + int count = 0; + int daysForMonths = 0; + + while (count < month) { + + int year = determineYear(daysForMonths); + daysForMonths += getDaysForMonth(count % 12, year); + count++; + } + + return days - daysForMonths; + } + + private int determineYear(int days) { + + if (days <= 366) + return 2016; + else if (days <= 730) + return 2017; + else if (days <= 1094) + return 2018; + else if (days <= 1458) + return 2019; + else + return 2020; + + } +} diff --git a/MPChartExample/src/main/java/com/xxmassdeveloper/mpchartexample/custom/MyAxisValueFormatter.java b/MPChartExample/src/main/java/com/xxmassdeveloper/mpchartexample/custom/MyAxisValueFormatter.java new file mode 100644 index 00000000..e7cdbfcd --- /dev/null +++ b/MPChartExample/src/main/java/com/xxmassdeveloper/mpchartexample/custom/MyAxisValueFormatter.java @@ -0,0 +1,21 @@ +package com.xxmassdeveloper.mpchartexample.custom; + +import com.github.mikephil.charting.components.AxisBase; +import com.github.mikephil.charting.formatter.IAxisValueFormatter; + +import java.text.DecimalFormat; + +public class MyAxisValueFormatter implements IAxisValueFormatter +{ + + private final DecimalFormat mFormat; + + public MyAxisValueFormatter() { + mFormat = new DecimalFormat("###,###,###,##0.0"); + } + + @Override + public String getFormattedValue(float value, AxisBase axis) { + return mFormat.format(value) + " $"; + } +} diff --git a/MPChartExample/src/main/java/com/xxmassdeveloper/mpchartexample/custom/MyCustomXAxisValueFormatter.java b/MPChartExample/src/main/java/com/xxmassdeveloper/mpchartexample/custom/MyCustomXAxisValueFormatter.java new file mode 100644 index 00000000..bea4908e --- /dev/null +++ b/MPChartExample/src/main/java/com/xxmassdeveloper/mpchartexample/custom/MyCustomXAxisValueFormatter.java @@ -0,0 +1,43 @@ +package com.xxmassdeveloper.mpchartexample.custom; + +import com.github.mikephil.charting.components.AxisBase; +import com.github.mikephil.charting.formatter.IAxisValueFormatter; +import com.github.mikephil.charting.utils.ViewPortHandler; + +import java.text.DecimalFormat; + +/** + * Created by Philipp Jahoda on 14/09/15. + * + * @deprecated The {@link MyAxisValueFormatter} does exactly the same thing and is more functional. + */ +@Deprecated +public class MyCustomXAxisValueFormatter implements IAxisValueFormatter +{ + + private final DecimalFormat mFormat; + private final ViewPortHandler mViewPortHandler; + + public MyCustomXAxisValueFormatter(ViewPortHandler viewPortHandler) { + mViewPortHandler = viewPortHandler; + // maybe do something here or provide parameters in constructor + mFormat = new DecimalFormat("###,###,###,##0.0"); + } + + @Override + public String getFormattedValue(float value, AxisBase axis) { + + //Log.i("TRANS", "x: " + viewPortHandler.getTransX() + ", y: " + viewPortHandler.getTransY()); + + // e.g. adjust the x-axis values depending on scale / zoom level + final float xScale = mViewPortHandler.getScaleX(); + if (xScale > 5) + return "4"; + else if (xScale > 3) + return "3"; + else if (xScale > 1) + return "2"; + else + return mFormat.format(value); + } +} diff --git a/MPChartExample/src/main/java/com/xxmassdeveloper/mpchartexample/custom/MyFillFormatter.java b/MPChartExample/src/main/java/com/xxmassdeveloper/mpchartexample/custom/MyFillFormatter.java new file mode 100644 index 00000000..2ca87b2f --- /dev/null +++ b/MPChartExample/src/main/java/com/xxmassdeveloper/mpchartexample/custom/MyFillFormatter.java @@ -0,0 +1,25 @@ +package com.xxmassdeveloper.mpchartexample.custom; + +import com.github.mikephil.charting.formatter.IFillFormatter; +import com.github.mikephil.charting.interfaces.dataprovider.LineDataProvider; +import com.github.mikephil.charting.interfaces.datasets.ILineDataSet; + +/** + * Created by Philipp Jahoda on 12/09/15. + */ +@SuppressWarnings("unused") +public class MyFillFormatter implements IFillFormatter +{ + + private float fillPos; + + public MyFillFormatter(float fillPos) { + this.fillPos = fillPos; + } + + @Override + public float getFillLinePosition(ILineDataSet dataSet, LineDataProvider dataProvider) { + // your logic could be here + return fillPos; + } +} diff --git a/MPChartExample/src/main/java/com/xxmassdeveloper/mpchartexample/custom/MyMarkerView.java b/MPChartExample/src/main/java/com/xxmassdeveloper/mpchartexample/custom/MyMarkerView.java new file mode 100644 index 00000000..2c1da9b4 --- /dev/null +++ b/MPChartExample/src/main/java/com/xxmassdeveloper/mpchartexample/custom/MyMarkerView.java @@ -0,0 +1,54 @@ + +package com.xxmassdeveloper.mpchartexample.custom; + +import android.annotation.SuppressLint; +import android.content.Context; +import android.widget.TextView; + +import com.github.mikephil.charting.components.MarkerView; +import com.github.mikephil.charting.data.CandleEntry; +import com.github.mikephil.charting.data.Entry; +import com.github.mikephil.charting.highlight.Highlight; +import com.github.mikephil.charting.utils.MPPointF; +import com.github.mikephil.charting.utils.Utils; +import com.xxmassdeveloper.mpchartexample.R; + +/** + * Custom implementation of the MarkerView. + * + * @author Philipp Jahoda + */ +@SuppressLint("ViewConstructor") +public class MyMarkerView extends MarkerView { + + private final TextView tvContent; + + public MyMarkerView(Context context, int layoutResource) { + super(context, layoutResource); + + tvContent = findViewById(R.id.tvContent); + } + + // runs every time the MarkerView is redrawn, can be used to update the + // content (user-interface) + @Override + public void refreshContent(Entry e, Highlight highlight) { + + if (e instanceof CandleEntry) { + + CandleEntry ce = (CandleEntry) e; + + tvContent.setText(Utils.formatNumber(ce.getHigh(), 0, true)); + } else { + + tvContent.setText(Utils.formatNumber(e.getY(), 0, true)); + } + + super.refreshContent(e, highlight); + } + + @Override + public MPPointF getOffset() { + return new MPPointF(-(getWidth() / 2), -getHeight()); + } +} diff --git a/MPChartExample/src/main/java/com/xxmassdeveloper/mpchartexample/custom/MyValueFormatter.java b/MPChartExample/src/main/java/com/xxmassdeveloper/mpchartexample/custom/MyValueFormatter.java new file mode 100644 index 00000000..ec1c1198 --- /dev/null +++ b/MPChartExample/src/main/java/com/xxmassdeveloper/mpchartexample/custom/MyValueFormatter.java @@ -0,0 +1,22 @@ +package com.xxmassdeveloper.mpchartexample.custom; + +import com.github.mikephil.charting.data.Entry; +import com.github.mikephil.charting.formatter.IValueFormatter; +import com.github.mikephil.charting.utils.ViewPortHandler; + +import java.text.DecimalFormat; + +public class MyValueFormatter implements IValueFormatter +{ + + private final DecimalFormat mFormat; + + public MyValueFormatter() { + mFormat = new DecimalFormat("###,###,###,##0.0"); + } + + @Override + public String getFormattedValue(float value, Entry entry, int dataSetIndex, ViewPortHandler viewPortHandler) { + return mFormat.format(value) + " $"; + } +} diff --git a/MPChartExample/src/main/java/com/xxmassdeveloper/mpchartexample/custom/RadarMarkerView.java b/MPChartExample/src/main/java/com/xxmassdeveloper/mpchartexample/custom/RadarMarkerView.java new file mode 100644 index 00000000..ca057a5a --- /dev/null +++ b/MPChartExample/src/main/java/com/xxmassdeveloper/mpchartexample/custom/RadarMarkerView.java @@ -0,0 +1,48 @@ + +package com.xxmassdeveloper.mpchartexample.custom; + +import android.annotation.SuppressLint; +import android.content.Context; +import android.graphics.Typeface; +import android.widget.TextView; + +import com.github.mikephil.charting.components.MarkerView; +import com.github.mikephil.charting.data.Entry; +import com.github.mikephil.charting.highlight.Highlight; +import com.github.mikephil.charting.utils.MPPointF; +import com.xxmassdeveloper.mpchartexample.R; + +import java.text.DecimalFormat; + +/** + * Custom implementation of the MarkerView. + * + * @author Philipp Jahoda + */ +@SuppressLint("ViewConstructor") +public class RadarMarkerView extends MarkerView { + + private final TextView tvContent; + private final DecimalFormat format = new DecimalFormat("##0"); + + public RadarMarkerView(Context context, int layoutResource) { + super(context, layoutResource); + + tvContent = findViewById(R.id.tvContent); + tvContent.setTypeface(Typeface.createFromAsset(context.getAssets(), "OpenSans-Light.ttf")); + } + + // runs every time the MarkerView is redrawn, can be used to update the + // content (user-interface) + @Override + public void refreshContent(Entry e, Highlight highlight) { + tvContent.setText(String.format("%s %%", format.format(e.getY()))); + + super.refreshContent(e, highlight); + } + + @Override + public MPPointF getOffset() { + return new MPPointF(-(getWidth() / 2), -getHeight() - 10); + } +} diff --git a/MPChartExample/src/main/java/com/xxmassdeveloper/mpchartexample/custom/StackedBarsMarkerView.java b/MPChartExample/src/main/java/com/xxmassdeveloper/mpchartexample/custom/StackedBarsMarkerView.java new file mode 100644 index 00000000..554ef2fe --- /dev/null +++ b/MPChartExample/src/main/java/com/xxmassdeveloper/mpchartexample/custom/StackedBarsMarkerView.java @@ -0,0 +1,61 @@ + +package com.xxmassdeveloper.mpchartexample.custom; + +import android.annotation.SuppressLint; +import android.content.Context; +import android.widget.TextView; + +import com.github.mikephil.charting.components.MarkerView; +import com.github.mikephil.charting.data.BarEntry; +import com.github.mikephil.charting.data.Entry; +import com.github.mikephil.charting.highlight.Highlight; +import com.github.mikephil.charting.utils.MPPointF; +import com.github.mikephil.charting.utils.Utils; +import com.xxmassdeveloper.mpchartexample.R; + +/** + * Custom implementation of the MarkerView. + * + * @author Philipp Jahoda + */ +@SuppressWarnings("unused") +@SuppressLint("ViewConstructor") +public class StackedBarsMarkerView extends MarkerView { + + private TextView tvContent; + + public StackedBarsMarkerView(Context context, int layoutResource) { + super(context, layoutResource); + + tvContent = findViewById(R.id.tvContent); + } + + // runs every time the MarkerView is redrawn, can be used to update the + // content (user-interface) + @Override + public void refreshContent(Entry e, Highlight highlight) { + + if (e instanceof BarEntry) { + + BarEntry be = (BarEntry) e; + + if(be.getYVals() != null) { + + // draw the stack value + tvContent.setText(Utils.formatNumber(be.getYVals()[highlight.getStackIndex()], 0, true)); + } else { + tvContent.setText(Utils.formatNumber(be.getY(), 0, true)); + } + } else { + + tvContent.setText(Utils.formatNumber(e.getY(), 0, true)); + } + + super.refreshContent(e, highlight); + } + + @Override + public MPPointF getOffset() { + return new MPPointF(-(getWidth() / 2), -getHeight()); + } +} diff --git a/MPChartExample/src/main/java/com/xxmassdeveloper/mpchartexample/custom/XYMarkerView.java b/MPChartExample/src/main/java/com/xxmassdeveloper/mpchartexample/custom/XYMarkerView.java new file mode 100644 index 00000000..51e4247d --- /dev/null +++ b/MPChartExample/src/main/java/com/xxmassdeveloper/mpchartexample/custom/XYMarkerView.java @@ -0,0 +1,52 @@ + +package com.xxmassdeveloper.mpchartexample.custom; + +import android.annotation.SuppressLint; +import android.content.Context; +import android.widget.TextView; + +import com.github.mikephil.charting.components.MarkerView; +import com.github.mikephil.charting.data.Entry; +import com.github.mikephil.charting.formatter.IAxisValueFormatter; +import com.github.mikephil.charting.highlight.Highlight; +import com.github.mikephil.charting.utils.MPPointF; +import com.xxmassdeveloper.mpchartexample.R; + +import java.text.DecimalFormat; + +/** + * Custom implementation of the MarkerView. + * + * @author Philipp Jahoda + */ +@SuppressLint("ViewConstructor") +public class XYMarkerView extends MarkerView { + + private final TextView tvContent; + private final IAxisValueFormatter xAxisValueFormatter; + + private final DecimalFormat format; + + public XYMarkerView(Context context, IAxisValueFormatter xAxisValueFormatter) { + super(context, R.layout.custom_marker_view); + + this.xAxisValueFormatter = xAxisValueFormatter; + tvContent = findViewById(R.id.tvContent); + format = new DecimalFormat("###.0"); + } + + // runs every time the MarkerView is redrawn, can be used to update the + // content (user-interface) + @Override + public void refreshContent(Entry e, Highlight highlight) { + + tvContent.setText(String.format("x: %s, y: %s", xAxisValueFormatter.getFormattedValue(e.getX(), null), format.format(e.getY()))); + + super.refreshContent(e, highlight); + } + + @Override + public MPPointF getOffset() { + return new MPPointF(-(getWidth() / 2), -getHeight()); + } +} diff --git a/MPChartExample/src/main/java/com/xxmassdeveloper/mpchartexample/custom/YearXAxisFormatter.java b/MPChartExample/src/main/java/com/xxmassdeveloper/mpchartexample/custom/YearXAxisFormatter.java new file mode 100644 index 00000000..7122e0d8 --- /dev/null +++ b/MPChartExample/src/main/java/com/xxmassdeveloper/mpchartexample/custom/YearXAxisFormatter.java @@ -0,0 +1,27 @@ +package com.xxmassdeveloper.mpchartexample.custom; + +import com.github.mikephil.charting.components.AxisBase; +import com.github.mikephil.charting.formatter.IAxisValueFormatter; + +/** + * Created by Philipp Jahoda on 14/09/15. + */ +@SuppressWarnings("unused") +public class YearXAxisFormatter implements IAxisValueFormatter +{ + + private final String[] mMonths = new String[]{ + "Jan", "Feb", "Mar", "Apr", "May", "Jun", "Jul", "Aug", "Sep", "Okt", "Nov", "Dec" + }; + + public YearXAxisFormatter() { + // take parameters to change behavior of formatter + } + + @Override + public String getFormattedValue(float value, AxisBase axis) { + + float percent = value / axis.mAxisRange; + return mMonths[(int) (mMonths.length * percent)]; + } +} diff --git a/MPChartExample/src/main/java/com/xxmassdeveloper/mpchartexample/fragments/BarChartFrag.java b/MPChartExample/src/main/java/com/xxmassdeveloper/mpchartexample/fragments/BarChartFrag.java new file mode 100644 index 00000000..4bcc5437 --- /dev/null +++ b/MPChartExample/src/main/java/com/xxmassdeveloper/mpchartexample/fragments/BarChartFrag.java @@ -0,0 +1,112 @@ +package com.xxmassdeveloper.mpchartexample.fragments; +import android.graphics.Typeface; +import android.os.Bundle; +import androidx.annotation.NonNull; +import androidx.fragment.app.Fragment; +import android.util.Log; +import android.view.LayoutInflater; +import android.view.MotionEvent; +import android.view.View; +import android.view.ViewGroup; +import android.widget.FrameLayout; + +import com.github.mikephil.charting.charts.BarChart; +import com.github.mikephil.charting.components.Legend; +import com.github.mikephil.charting.components.XAxis; +import com.github.mikephil.charting.components.YAxis; +import com.github.mikephil.charting.listener.ChartTouchListener; +import com.github.mikephil.charting.listener.OnChartGestureListener; +import com.xxmassdeveloper.mpchartexample.R; +import com.xxmassdeveloper.mpchartexample.custom.MyMarkerView; + + +public class BarChartFrag extends SimpleFragment implements OnChartGestureListener { + + @NonNull + public static Fragment newInstance() { + return new BarChartFrag(); + } + + private BarChart chart; + + @Override + public View onCreateView(@NonNull LayoutInflater inflater, ViewGroup container, Bundle savedInstanceState) { + View v = inflater.inflate(R.layout.frag_simple_bar, container, false); + + // create a new chart object + chart = new BarChart(getActivity()); + chart.getDescription().setEnabled(false); + chart.setOnChartGestureListener(this); + + MyMarkerView mv = new MyMarkerView(getActivity(), R.layout.custom_marker_view); + mv.setChartView(chart); // For bounds control + chart.setMarker(mv); + + chart.setDrawGridBackground(false); + chart.setDrawBarShadow(false); + + Typeface tf = Typeface.createFromAsset(context.getAssets(), "OpenSans-Light.ttf"); + + chart.setData(generateBarData(1, 20000, 12)); + + Legend l = chart.getLegend(); + l.setTypeface(tf); + + YAxis leftAxis = chart.getAxisLeft(); + leftAxis.setTypeface(tf); + leftAxis.setAxisMinimum(0f); // this replaces setStartAtZero(true) + + chart.getAxisRight().setEnabled(false); + + XAxis xAxis = chart.getXAxis(); + xAxis.setEnabled(false); + + // programmatically add the chart + FrameLayout parent = v.findViewById(R.id.parentLayout); + parent.addView(chart); + + return v; + } + + @Override + public void onChartGestureStart(MotionEvent me, ChartTouchListener.ChartGesture lastPerformedGesture) { + Log.i("Gesture", "START"); + } + + @Override + public void onChartGestureEnd(MotionEvent me, ChartTouchListener.ChartGesture lastPerformedGesture) { + Log.i("Gesture", "END"); + chart.highlightValues(null); + } + + @Override + public void onChartLongPressed(MotionEvent me) { + Log.i("LongPress", "Chart long pressed."); + } + + @Override + public void onChartDoubleTapped(MotionEvent me) { + Log.i("DoubleTap", "Chart double-tapped."); + } + + @Override + public void onChartSingleTapped(MotionEvent me) { + Log.i("SingleTap", "Chart single-tapped."); + } + + @Override + public void onChartFling(MotionEvent me1, MotionEvent me2, float velocityX, float velocityY) { + Log.i("Fling", "Chart fling. VelocityX: " + velocityX + ", VelocityY: " + velocityY); + } + + @Override + public void onChartScale(MotionEvent me, float scaleX, float scaleY) { + Log.i("Scale / Zoom", "ScaleX: " + scaleX + ", ScaleY: " + scaleY); + } + + @Override + public void onChartTranslate(MotionEvent me, float dX, float dY) { + Log.i("Translate / Move", "dX: " + dX + ", dY: " + dY); + } + +} diff --git a/MPChartExample/src/main/java/com/xxmassdeveloper/mpchartexample/fragments/ComplexityFragment.java b/MPChartExample/src/main/java/com/xxmassdeveloper/mpchartexample/fragments/ComplexityFragment.java new file mode 100644 index 00000000..9edee8bd --- /dev/null +++ b/MPChartExample/src/main/java/com/xxmassdeveloper/mpchartexample/fragments/ComplexityFragment.java @@ -0,0 +1,55 @@ +package com.xxmassdeveloper.mpchartexample.fragments; +import android.graphics.Typeface; +import android.os.Bundle; +import androidx.annotation.NonNull; +import androidx.fragment.app.Fragment; +import android.view.LayoutInflater; +import android.view.View; +import android.view.ViewGroup; + +import com.github.mikephil.charting.charts.LineChart; +import com.github.mikephil.charting.components.Legend; +import com.github.mikephil.charting.components.XAxis; +import com.github.mikephil.charting.components.YAxis; +import com.xxmassdeveloper.mpchartexample.R; + + +public class ComplexityFragment extends SimpleFragment { + + @NonNull + public static Fragment newInstance() { + return new ComplexityFragment(); + } + + @SuppressWarnings("FieldCanBeLocal") + private LineChart chart; + + @Override + public View onCreateView(@NonNull LayoutInflater inflater, ViewGroup container, Bundle savedInstanceState) { + View v = inflater.inflate(R.layout.frag_simple_line, container, false); + + chart = v.findViewById(R.id.lineChart1); + + chart.getDescription().setEnabled(false); + + chart.setDrawGridBackground(false); + + chart.setData(getComplexity()); + chart.animateX(3000); + + Typeface tf = Typeface.createFromAsset(context.getAssets(), "OpenSans-Light.ttf"); + + Legend l = chart.getLegend(); + l.setTypeface(tf); + + YAxis leftAxis = chart.getAxisLeft(); + leftAxis.setTypeface(tf); + + chart.getAxisRight().setEnabled(false); + + XAxis xAxis = chart.getXAxis(); + xAxis.setEnabled(false); + + return v; + } +} diff --git a/MPChartExample/src/main/java/com/xxmassdeveloper/mpchartexample/fragments/PieChartFrag.java b/MPChartExample/src/main/java/com/xxmassdeveloper/mpchartexample/fragments/PieChartFrag.java new file mode 100644 index 00000000..5de9a46e --- /dev/null +++ b/MPChartExample/src/main/java/com/xxmassdeveloper/mpchartexample/fragments/PieChartFrag.java @@ -0,0 +1,64 @@ +package com.xxmassdeveloper.mpchartexample.fragments; +import android.graphics.Color; +import android.graphics.Typeface; +import android.os.Bundle; +import androidx.annotation.NonNull; +import androidx.fragment.app.Fragment; +import android.text.SpannableString; +import android.text.style.ForegroundColorSpan; +import android.text.style.RelativeSizeSpan; +import android.view.LayoutInflater; +import android.view.View; +import android.view.ViewGroup; + +import com.github.mikephil.charting.charts.PieChart; +import com.github.mikephil.charting.components.Legend; +import com.xxmassdeveloper.mpchartexample.R; + + +public class PieChartFrag extends SimpleFragment { + + @NonNull + public static Fragment newInstance() { + return new PieChartFrag(); + } + + @SuppressWarnings("FieldCanBeLocal") + private PieChart chart; + + @Override + public View onCreateView(@NonNull LayoutInflater inflater, ViewGroup container, Bundle savedInstanceState) { + View v = inflater.inflate(R.layout.frag_simple_pie, container, false); + + chart = v.findViewById(R.id.pieChart1); + chart.getDescription().setEnabled(false); + + Typeface tf = Typeface.createFromAsset(context.getAssets(), "OpenSans-Light.ttf"); + + chart.setCenterTextTypeface(tf); + chart.setCenterText(generateCenterText()); + chart.setCenterTextSize(10f); + chart.setCenterTextTypeface(tf); + + // radius of the center hole in percent of maximum radius + chart.setHoleRadius(45f); + chart.setTransparentCircleRadius(50f); + + Legend l = chart.getLegend(); + l.setVerticalAlignment(Legend.LegendVerticalAlignment.TOP); + l.setHorizontalAlignment(Legend.LegendHorizontalAlignment.RIGHT); + l.setOrientation(Legend.LegendOrientation.VERTICAL); + l.setDrawInside(false); + + chart.setData(generatePieData()); + + return v; + } + + private SpannableString generateCenterText() { + SpannableString s = new SpannableString("Revenues\nQuarters 2015"); + s.setSpan(new RelativeSizeSpan(2f), 0, 8, 0); + s.setSpan(new ForegroundColorSpan(Color.GRAY), 8, s.length(), 0); + return s; + } +} diff --git a/MPChartExample/src/main/java/com/xxmassdeveloper/mpchartexample/fragments/ScatterChartFrag.java b/MPChartExample/src/main/java/com/xxmassdeveloper/mpchartexample/fragments/ScatterChartFrag.java new file mode 100644 index 00000000..d5d292bf --- /dev/null +++ b/MPChartExample/src/main/java/com/xxmassdeveloper/mpchartexample/fragments/ScatterChartFrag.java @@ -0,0 +1,69 @@ +package com.xxmassdeveloper.mpchartexample.fragments; + +import android.graphics.Typeface; +import android.os.Bundle; +import androidx.annotation.NonNull; +import androidx.fragment.app.Fragment; +import android.view.LayoutInflater; +import android.view.View; +import android.view.ViewGroup; + +import com.github.mikephil.charting.charts.ScatterChart; +import com.github.mikephil.charting.components.Legend; +import com.github.mikephil.charting.components.XAxis; +import com.github.mikephil.charting.components.XAxis.XAxisPosition; +import com.github.mikephil.charting.components.YAxis; +import com.xxmassdeveloper.mpchartexample.R; +import com.xxmassdeveloper.mpchartexample.custom.MyMarkerView; + + +public class ScatterChartFrag extends SimpleFragment { + + @NonNull + public static Fragment newInstance() { + return new ScatterChartFrag(); + } + + @SuppressWarnings("FieldCanBeLocal") + private ScatterChart chart; + + @Override + public View onCreateView(@NonNull LayoutInflater inflater, ViewGroup container, Bundle savedInstanceState) { + View v = inflater.inflate(R.layout.frag_simple_scatter, container, false); + + chart = v.findViewById(R.id.scatterChart1); + chart.getDescription().setEnabled(false); + + Typeface tf = Typeface.createFromAsset(context.getAssets(), "OpenSans-Light.ttf"); + + MyMarkerView mv = new MyMarkerView(getActivity(), R.layout.custom_marker_view); + mv.setChartView(chart); // For bounds control + chart.setMarker(mv); + + chart.setDrawGridBackground(false); + chart.setData(generateScatterData(6, 10000, 200)); + + XAxis xAxis = chart.getXAxis(); + xAxis.setEnabled(true); + xAxis.setPosition(XAxisPosition.BOTTOM); + + YAxis leftAxis = chart.getAxisLeft(); + leftAxis.setTypeface(tf); + + YAxis rightAxis = chart.getAxisRight(); + rightAxis.setTypeface(tf); + rightAxis.setDrawGridLines(false); + + Legend l = chart.getLegend(); + l.setWordWrapEnabled(true); + l.setTypeface(tf); + l.setFormSize(14f); + l.setTextSize(9f); + + // increase the space between legend & bottom and legend & content + l.setYOffset(13f); + chart.setExtraBottomOffset(16f); + + return v; + } +} diff --git a/MPChartExample/src/main/java/com/xxmassdeveloper/mpchartexample/fragments/SimpleChartDemo.java b/MPChartExample/src/main/java/com/xxmassdeveloper/mpchartexample/fragments/SimpleChartDemo.java new file mode 100644 index 00000000..32b78142 --- /dev/null +++ b/MPChartExample/src/main/java/com/xxmassdeveloper/mpchartexample/fragments/SimpleChartDemo.java @@ -0,0 +1,117 @@ + +package com.xxmassdeveloper.mpchartexample.fragments; + +import android.app.AlertDialog; +import android.content.DialogInterface; +import android.content.DialogInterface.OnClickListener; +import android.content.Intent; +import android.net.Uri; +import android.os.Bundle; +import androidx.fragment.app.Fragment; +import androidx.fragment.app.FragmentManager; +import androidx.fragment.app.FragmentPagerAdapter; +import androidx.viewpager.widget.ViewPager; +import android.view.Menu; +import android.view.MenuItem; +import android.view.WindowManager; + +import com.xxmassdeveloper.mpchartexample.R; +import com.xxmassdeveloper.mpchartexample.notimportant.DemoBase; + +/** + * Demonstrates how to keep your charts straight forward, simple and beautiful with the MPAndroidChart library. + * + * @author Philipp Jahoda + */ +public class SimpleChartDemo extends DemoBase { + + @Override + protected void onCreate(Bundle savedInstanceState) { + super.onCreate(savedInstanceState); + getWindow().setFlags(WindowManager.LayoutParams.FLAG_FULLSCREEN, + WindowManager.LayoutParams.FLAG_FULLSCREEN); + setContentView(R.layout.activity_awesomedesign); + + setTitle("SimpleChartDemo"); + + ViewPager pager = findViewById(R.id.pager); + pager.setOffscreenPageLimit(3); + + PageAdapter a = new PageAdapter(getSupportFragmentManager()); + pager.setAdapter(a); + + + AlertDialog.Builder b = new AlertDialog.Builder(this); + b.setTitle("This is a ViewPager."); + b.setMessage("Swipe left and right for more awesome design examples!"); + b.setPositiveButton("OK", new OnClickListener() { + + @Override + public void onClick(DialogInterface dialog, int which) { + dialog.dismiss(); + } + }); + b.show(); + } + + private class PageAdapter extends FragmentPagerAdapter { + + PageAdapter(FragmentManager fm) { + super(fm); + } + + @Override + public Fragment getItem(int pos) { + Fragment f = null; + + switch(pos) { + case 0: + f = SineCosineFragment.newInstance(); + break; + case 1: + f = ComplexityFragment.newInstance(); + break; + case 2: + f = BarChartFrag.newInstance(); + break; + case 3: + f = ScatterChartFrag.newInstance(); + break; + case 4: + f = PieChartFrag.newInstance(); + break; + } + + return f; + } + + @Override + public int getCount() { + return 5; + } + } + + @Override + public boolean onCreateOptionsMenu(Menu menu) { + getMenuInflater().inflate(R.menu.only_github, menu); + return true; + } + + @Override + public boolean onOptionsItemSelected(MenuItem item) { + + switch (item.getItemId()) { + case R.id.viewGithub: { + Intent i = new Intent(Intent.ACTION_VIEW); + i.setData(Uri.parse("https://github.com/PhilJay/MPAndroidChart/blob/master/MPChartExample/src/com/xxmassdeveloper/mpchartexample/fragments/SimpleChartDemo.java")); + startActivity(i); + break; + } + } + + return true; + } + + @Override + public void saveToGallery() { /* Intentionally left empty */ } +} diff --git a/MPChartExample/src/main/java/com/xxmassdeveloper/mpchartexample/fragments/SimpleFragment.java b/MPChartExample/src/main/java/com/xxmassdeveloper/mpchartexample/fragments/SimpleFragment.java new file mode 100644 index 00000000..ab70041e --- /dev/null +++ b/MPChartExample/src/main/java/com/xxmassdeveloper/mpchartexample/fragments/SimpleFragment.java @@ -0,0 +1,199 @@ +package com.xxmassdeveloper.mpchartexample.fragments; + +import android.content.Context; +import android.graphics.Color; +import android.graphics.Typeface; +import android.os.Bundle; +import androidx.annotation.NonNull; +import androidx.fragment.app.Fragment; +import android.view.LayoutInflater; +import android.view.View; +import android.view.ViewGroup; + +import com.github.mikephil.charting.charts.ScatterChart; +import com.github.mikephil.charting.data.BarData; +import com.github.mikephil.charting.data.BarDataSet; +import com.github.mikephil.charting.data.BarEntry; +import com.github.mikephil.charting.data.Entry; +import com.github.mikephil.charting.data.LineData; +import com.github.mikephil.charting.data.LineDataSet; +import com.github.mikephil.charting.data.PieData; +import com.github.mikephil.charting.data.PieDataSet; +import com.github.mikephil.charting.data.PieEntry; +import com.github.mikephil.charting.data.ScatterData; +import com.github.mikephil.charting.data.ScatterDataSet; +import com.github.mikephil.charting.interfaces.datasets.IBarDataSet; +import com.github.mikephil.charting.interfaces.datasets.ILineDataSet; +import com.github.mikephil.charting.interfaces.datasets.IScatterDataSet; +import com.github.mikephil.charting.utils.ColorTemplate; +import com.github.mikephil.charting.utils.FileUtils; + +import java.util.ArrayList; + +@SuppressWarnings({"SameParameterValue", "WeakerAccess"}) +public abstract class SimpleFragment extends Fragment { + + private Typeface tf; + protected Context context; + + @Override + public void onAttach(Context context) { + super.onAttach(context); + this.context = context; + } + + public SimpleFragment() { + + } + + @Override + public View onCreateView(@NonNull LayoutInflater inflater, ViewGroup container, Bundle savedInstanceState) { + tf = Typeface.createFromAsset(context.getAssets(), "OpenSans-Regular.ttf"); + return super.onCreateView(inflater, container, savedInstanceState); + } + + protected BarData generateBarData(int dataSets, float range, int count) { + + ArrayList<IBarDataSet> sets = new ArrayList<>(); + + for(int i = 0; i < dataSets; i++) { + + ArrayList<BarEntry> entries = new ArrayList<>(); + + for(int j = 0; j < count; j++) { + entries.add(new BarEntry(j, (float) (Math.random() * range) + range / 4)); + } + + BarDataSet ds = new BarDataSet(entries, getLabel(i)); + ds.setColors(ColorTemplate.VORDIPLOM_COLORS); + sets.add(ds); + } + + BarData d = new BarData(sets); + d.setValueTypeface(tf); + return d; + } + + protected ScatterData generateScatterData(int dataSets, float range, int count) { + + ArrayList<IScatterDataSet> sets = new ArrayList<>(); + + ScatterChart.ScatterShape[] shapes = ScatterChart.ScatterShape.getAllDefaultShapes(); + + for(int i = 0; i < dataSets; i++) { + + ArrayList<Entry> entries = new ArrayList<>(); + + for(int j = 0; j < count; j++) { + entries.add(new Entry(j, (float) (Math.random() * range) + range / 4)); + } + + ScatterDataSet ds = new ScatterDataSet(entries, getLabel(i)); + ds.setScatterShapeSize(12f); + ds.setScatterShape(shapes[i % shapes.length]); + ds.setColors(ColorTemplate.COLORFUL_COLORS); + ds.setScatterShapeSize(9f); + sets.add(ds); + } + + ScatterData d = new ScatterData(sets); + d.setValueTypeface(tf); + return d; + } + + /** + * generates less data (1 DataSet, 4 values) + * @return PieData + */ + protected PieData generatePieData() { + + int count = 4; + + ArrayList<PieEntry> entries1 = new ArrayList<>(); + + for(int i = 0; i < count; i++) { + entries1.add(new PieEntry((float) ((Math.random() * 60) + 40), "Quarter " + (i+1))); + } + + PieDataSet ds1 = new PieDataSet(entries1, "Quarterly Revenues 2015"); + ds1.setColors(ColorTemplate.VORDIPLOM_COLORS); + ds1.setSliceSpace(2f); + ds1.setValueTextColor(Color.WHITE); + ds1.setValueTextSize(12f); + + PieData d = new PieData(ds1); + d.setValueTypeface(tf); + + return d; + } + + protected LineData generateLineData() { + + ArrayList<ILineDataSet> sets = new ArrayList<>(); + LineDataSet ds1 = new LineDataSet(FileUtils.loadEntriesFromAssets(context.getAssets(), "sine.txt"), "Sine function"); + LineDataSet ds2 = new LineDataSet(FileUtils.loadEntriesFromAssets(context.getAssets(), "cosine.txt"), "Cosine function"); + + ds1.setLineWidth(2f); + ds2.setLineWidth(2f); + + ds1.setDrawCircles(false); + ds2.setDrawCircles(false); + + ds1.setColor(ColorTemplate.VORDIPLOM_COLORS[0]); + ds2.setColor(ColorTemplate.VORDIPLOM_COLORS[1]); + + // load DataSets from files in assets folder + sets.add(ds1); + sets.add(ds2); + + LineData d = new LineData(sets); + d.setValueTypeface(tf); + return d; + } + + protected LineData getComplexity() { + + ArrayList<ILineDataSet> sets = new ArrayList<>(); + + LineDataSet ds1 = new LineDataSet(FileUtils.loadEntriesFromAssets(context.getAssets(), "n.txt"), "O(n)"); + LineDataSet ds2 = new LineDataSet(FileUtils.loadEntriesFromAssets(context.getAssets(), "nlogn.txt"), "O(nlogn)"); + LineDataSet ds3 = new LineDataSet(FileUtils.loadEntriesFromAssets(context.getAssets(), "square.txt"), "O(n\u00B2)"); + LineDataSet ds4 = new LineDataSet(FileUtils.loadEntriesFromAssets(context.getAssets(), "three.txt"), "O(n\u00B3)"); + + ds1.setColor(ColorTemplate.VORDIPLOM_COLORS[0]); + ds2.setColor(ColorTemplate.VORDIPLOM_COLORS[1]); + ds3.setColor(ColorTemplate.VORDIPLOM_COLORS[2]); + ds4.setColor(ColorTemplate.VORDIPLOM_COLORS[3]); + + ds1.setCircleColor(ColorTemplate.VORDIPLOM_COLORS[0]); + ds2.setCircleColor(ColorTemplate.VORDIPLOM_COLORS[1]); + ds3.setCircleColor(ColorTemplate.VORDIPLOM_COLORS[2]); + ds4.setCircleColor(ColorTemplate.VORDIPLOM_COLORS[3]); + + ds1.setLineWidth(2.5f); + ds1.setCircleRadius(3f); + ds2.setLineWidth(2.5f); + ds2.setCircleRadius(3f); + ds3.setLineWidth(2.5f); + ds3.setCircleRadius(3f); + ds4.setLineWidth(2.5f); + ds4.setCircleRadius(3f); + + + // load DataSets from files in assets folder + sets.add(ds1); + sets.add(ds2); + sets.add(ds3); + sets.add(ds4); + + LineData d = new LineData(sets); + d.setValueTypeface(tf); + return d; + } + + private final String[] mLabels = new String[] { "Company A", "Company B", "Company C", "Company D", "Company E", "Company F" }; + + private String getLabel(int i) { + return mLabels[i]; + } +} diff --git a/MPChartExample/src/main/java/com/xxmassdeveloper/mpchartexample/fragments/SineCosineFragment.java b/MPChartExample/src/main/java/com/xxmassdeveloper/mpchartexample/fragments/SineCosineFragment.java new file mode 100644 index 00000000..05815293 --- /dev/null +++ b/MPChartExample/src/main/java/com/xxmassdeveloper/mpchartexample/fragments/SineCosineFragment.java @@ -0,0 +1,57 @@ +package com.xxmassdeveloper.mpchartexample.fragments; +import android.graphics.Typeface; +import android.os.Bundle; +import androidx.annotation.NonNull; +import androidx.fragment.app.Fragment; +import android.view.LayoutInflater; +import android.view.View; +import android.view.ViewGroup; + +import com.github.mikephil.charting.charts.LineChart; +import com.github.mikephil.charting.components.Legend; +import com.github.mikephil.charting.components.XAxis; +import com.github.mikephil.charting.components.YAxis; +import com.xxmassdeveloper.mpchartexample.R; + + +public class SineCosineFragment extends SimpleFragment { + + @NonNull + public static Fragment newInstance() { + return new SineCosineFragment(); + } + + @SuppressWarnings("FieldCanBeLocal") + private LineChart chart; + + @Override + public View onCreateView(@NonNull LayoutInflater inflater, ViewGroup container, Bundle savedInstanceState) { + View v = inflater.inflate(R.layout.frag_simple_line, container, false); + + chart = v.findViewById(R.id.lineChart1); + + chart.getDescription().setEnabled(false); + + chart.setDrawGridBackground(false); + + chart.setData(generateLineData()); + chart.animateX(3000); + + Typeface tf = Typeface.createFromAsset(context.getAssets(), "OpenSans-Light.ttf"); + + Legend l = chart.getLegend(); + l.setTypeface(tf); + + YAxis leftAxis = chart.getAxisLeft(); + leftAxis.setTypeface(tf); + leftAxis.setAxisMaximum(1.2f); + leftAxis.setAxisMinimum(-1.2f); + + chart.getAxisRight().setEnabled(false); + + XAxis xAxis = chart.getXAxis(); + xAxis.setEnabled(false); + + return v; + } +} diff --git a/MPChartExample/src/main/java/com/xxmassdeveloper/mpchartexample/listviewitems/BarChartItem.java b/MPChartExample/src/main/java/com/xxmassdeveloper/mpchartexample/listviewitems/BarChartItem.java new file mode 100644 index 00000000..eeb1791f --- /dev/null +++ b/MPChartExample/src/main/java/com/xxmassdeveloper/mpchartexample/listviewitems/BarChartItem.java @@ -0,0 +1,91 @@ +package com.xxmassdeveloper.mpchartexample.listviewitems; + +import android.annotation.SuppressLint; +import android.content.Context; +import android.graphics.Typeface; +import android.view.LayoutInflater; +import android.view.View; + +import com.github.mikephil.charting.charts.BarChart; +import com.github.mikephil.charting.components.XAxis; +import com.github.mikephil.charting.components.XAxis.XAxisPosition; +import com.github.mikephil.charting.components.YAxis; +import com.github.mikephil.charting.data.BarData; +import com.github.mikephil.charting.data.ChartData; +import com.xxmassdeveloper.mpchartexample.R; + +public class BarChartItem extends ChartItem { + + private final Typeface mTf; + + public BarChartItem(ChartData<?> cd, Context c) { + super(cd); + + mTf = Typeface.createFromAsset(c.getAssets(), "OpenSans-Regular.ttf"); + } + + @Override + public int getItemType() { + return TYPE_BARCHART; + } + + @SuppressLint("InflateParams") + @Override + public View getView(int position, View convertView, Context c) { + + ViewHolder holder; + + if (convertView == null) { + + holder = new ViewHolder(); + + convertView = LayoutInflater.from(c).inflate( + R.layout.list_item_barchart, null); + holder.chart = convertView.findViewById(R.id.chart); + + convertView.setTag(holder); + + } else { + holder = (ViewHolder) convertView.getTag(); + } + + // apply styling + holder.chart.getDescription().setEnabled(false); + holder.chart.setDrawGridBackground(false); + holder.chart.setDrawBarShadow(false); + + XAxis xAxis = holder.chart.getXAxis(); + xAxis.setPosition(XAxisPosition.BOTTOM); + xAxis.setTypeface(mTf); + xAxis.setDrawGridLines(false); + xAxis.setDrawAxisLine(true); + + YAxis leftAxis = holder.chart.getAxisLeft(); + leftAxis.setTypeface(mTf); + leftAxis.setLabelCount(5, false); + leftAxis.setSpaceTop(20f); + leftAxis.setAxisMinimum(0f); // this replaces setStartAtZero(true) + + YAxis rightAxis = holder.chart.getAxisRight(); + rightAxis.setTypeface(mTf); + rightAxis.setLabelCount(5, false); + rightAxis.setSpaceTop(20f); + rightAxis.setAxisMinimum(0f); // this replaces setStartAtZero(true) + + mChartData.setValueTypeface(mTf); + + // set data + holder.chart.setData((BarData) mChartData); + holder.chart.setFitBars(true); + + // do not forget to refresh the chart +// holder.chart.invalidate(); + holder.chart.animateY(700); + + return convertView; + } + + private static class ViewHolder { + BarChart chart; + } +} diff --git a/MPChartExample/src/main/java/com/xxmassdeveloper/mpchartexample/listviewitems/ChartItem.java b/MPChartExample/src/main/java/com/xxmassdeveloper/mpchartexample/listviewitems/ChartItem.java new file mode 100644 index 00000000..2a8ed056 --- /dev/null +++ b/MPChartExample/src/main/java/com/xxmassdeveloper/mpchartexample/listviewitems/ChartItem.java @@ -0,0 +1,29 @@ +package com.xxmassdeveloper.mpchartexample.listviewitems; + +import android.content.Context; +import android.view.View; + +import com.github.mikephil.charting.data.ChartData; + +/** + * Base class of the Chart ListView items + * @author philipp + * + */ +@SuppressWarnings("unused") +public abstract class ChartItem { + + static final int TYPE_BARCHART = 0; + static final int TYPE_LINECHART = 1; + static final int TYPE_PIECHART = 2; + + ChartData<?> mChartData; + + ChartItem(ChartData<?> cd) { + this.mChartData = cd; + } + + public abstract int getItemType(); + + public abstract View getView(int position, View convertView, Context c); +} diff --git a/MPChartExample/src/main/java/com/xxmassdeveloper/mpchartexample/listviewitems/LineChartItem.java b/MPChartExample/src/main/java/com/xxmassdeveloper/mpchartexample/listviewitems/LineChartItem.java new file mode 100644 index 00000000..d69b0103 --- /dev/null +++ b/MPChartExample/src/main/java/com/xxmassdeveloper/mpchartexample/listviewitems/LineChartItem.java @@ -0,0 +1,88 @@ + +package com.xxmassdeveloper.mpchartexample.listviewitems; + +import android.annotation.SuppressLint; +import android.content.Context; +import android.graphics.Typeface; +import android.view.LayoutInflater; +import android.view.View; + +import com.github.mikephil.charting.charts.LineChart; +import com.github.mikephil.charting.components.XAxis; +import com.github.mikephil.charting.components.XAxis.XAxisPosition; +import com.github.mikephil.charting.components.YAxis; +import com.github.mikephil.charting.data.ChartData; +import com.github.mikephil.charting.data.LineData; +import com.xxmassdeveloper.mpchartexample.R; + +public class LineChartItem extends ChartItem { + + private final Typeface mTf; + + public LineChartItem(ChartData<?> cd, Context c) { + super(cd); + + mTf = Typeface.createFromAsset(c.getAssets(), "OpenSans-Regular.ttf"); + } + + @Override + public int getItemType() { + return TYPE_LINECHART; + } + + @SuppressLint("InflateParams") + @Override + public View getView(int position, View convertView, Context c) { + + ViewHolder holder; + + if (convertView == null) { + + holder = new ViewHolder(); + + convertView = LayoutInflater.from(c).inflate( + R.layout.list_item_linechart, null); + holder.chart = convertView.findViewById(R.id.chart); + + convertView.setTag(holder); + + } else { + holder = (ViewHolder) convertView.getTag(); + } + + // apply styling + // holder.chart.setValueTypeface(mTf); + holder.chart.getDescription().setEnabled(false); + holder.chart.setDrawGridBackground(false); + + XAxis xAxis = holder.chart.getXAxis(); + xAxis.setPosition(XAxisPosition.BOTTOM); + xAxis.setTypeface(mTf); + xAxis.setDrawGridLines(false); + xAxis.setDrawAxisLine(true); + + YAxis leftAxis = holder.chart.getAxisLeft(); + leftAxis.setTypeface(mTf); + leftAxis.setLabelCount(5, false); + leftAxis.setAxisMinimum(0f); // this replaces setStartAtZero(true) + + YAxis rightAxis = holder.chart.getAxisRight(); + rightAxis.setTypeface(mTf); + rightAxis.setLabelCount(5, false); + rightAxis.setDrawGridLines(false); + rightAxis.setAxisMinimum(0f); // this replaces setStartAtZero(true) + + // set data + holder.chart.setData((LineData) mChartData); + + // do not forget to refresh the chart + // holder.chart.invalidate(); + holder.chart.animateX(750); + + return convertView; + } + + private static class ViewHolder { + LineChart chart; + } +} diff --git a/MPChartExample/src/main/java/com/xxmassdeveloper/mpchartexample/listviewitems/PieChartItem.java b/MPChartExample/src/main/java/com/xxmassdeveloper/mpchartexample/listviewitems/PieChartItem.java new file mode 100644 index 00000000..916f8dc5 --- /dev/null +++ b/MPChartExample/src/main/java/com/xxmassdeveloper/mpchartexample/listviewitems/PieChartItem.java @@ -0,0 +1,105 @@ + +package com.xxmassdeveloper.mpchartexample.listviewitems; + +import android.annotation.SuppressLint; +import android.content.Context; +import android.graphics.Color; +import android.graphics.Typeface; +import android.text.SpannableString; +import android.text.style.ForegroundColorSpan; +import android.text.style.RelativeSizeSpan; +import android.view.LayoutInflater; +import android.view.View; + +import com.github.mikephil.charting.charts.PieChart; +import com.github.mikephil.charting.components.Legend; +import com.github.mikephil.charting.data.ChartData; +import com.github.mikephil.charting.data.PieData; +import com.github.mikephil.charting.formatter.PercentFormatter; +import com.github.mikephil.charting.utils.ColorTemplate; +import com.xxmassdeveloper.mpchartexample.R; + +public class PieChartItem extends ChartItem { + + private final Typeface mTf; + private final SpannableString mCenterText; + + public PieChartItem(ChartData<?> cd, Context c) { + super(cd); + + mTf = Typeface.createFromAsset(c.getAssets(), "OpenSans-Regular.ttf"); + mCenterText = generateCenterText(); + } + + @Override + public int getItemType() { + return TYPE_PIECHART; + } + + @SuppressLint("InflateParams") + @Override + public View getView(int position, View convertView, Context c) { + + ViewHolder holder; + + if (convertView == null) { + + holder = new ViewHolder(); + + convertView = LayoutInflater.from(c).inflate( + R.layout.list_item_piechart, null); + holder.chart = convertView.findViewById(R.id.chart); + + convertView.setTag(holder); + + } else { + holder = (ViewHolder) convertView.getTag(); + } + + // apply styling + holder.chart.getDescription().setEnabled(false); + holder.chart.setHoleRadius(52f); + holder.chart.setTransparentCircleRadius(57f); + holder.chart.setCenterText(mCenterText); + holder.chart.setCenterTextTypeface(mTf); + holder.chart.setCenterTextSize(9f); + holder.chart.setUsePercentValues(true); + holder.chart.setExtraOffsets(5, 10, 50, 10); + + mChartData.setValueFormatter(new PercentFormatter()); + mChartData.setValueTypeface(mTf); + mChartData.setValueTextSize(11f); + mChartData.setValueTextColor(Color.WHITE); + // set data + holder.chart.setData((PieData) mChartData); + + Legend l = holder.chart.getLegend(); + l.setVerticalAlignment(Legend.LegendVerticalAlignment.TOP); + l.setHorizontalAlignment(Legend.LegendHorizontalAlignment.RIGHT); + l.setOrientation(Legend.LegendOrientation.VERTICAL); + l.setDrawInside(false); + l.setYEntrySpace(0f); + l.setYOffset(0f); + + // do not forget to refresh the chart + // holder.chart.invalidate(); + holder.chart.animateY(900); + + return convertView; + } + + private SpannableString generateCenterText() { + SpannableString s = new SpannableString("MPAndroidChart\ncreated by\nPhilipp Jahoda"); + s.setSpan(new RelativeSizeSpan(1.6f), 0, 14, 0); + s.setSpan(new ForegroundColorSpan(ColorTemplate.VORDIPLOM_COLORS[0]), 0, 14, 0); + s.setSpan(new RelativeSizeSpan(.9f), 14, 25, 0); + s.setSpan(new ForegroundColorSpan(Color.GRAY), 14, 25, 0); + s.setSpan(new RelativeSizeSpan(1.4f), 25, s.length(), 0); + s.setSpan(new ForegroundColorSpan(ColorTemplate.getHoloBlue()), 25, s.length(), 0); + return s; + } + + private static class ViewHolder { + PieChart chart; + } +} diff --git a/MPChartExample/src/main/java/com/xxmassdeveloper/mpchartexample/notimportant/ContentItem.java b/MPChartExample/src/main/java/com/xxmassdeveloper/mpchartexample/notimportant/ContentItem.java new file mode 100644 index 00000000..f322090d --- /dev/null +++ b/MPChartExample/src/main/java/com/xxmassdeveloper/mpchartexample/notimportant/ContentItem.java @@ -0,0 +1,22 @@ +package com.xxmassdeveloper.mpchartexample.notimportant; + +/** + * Created by Philipp Jahoda on 07/12/15. + */ +class ContentItem { + + final String name; + final String desc; + boolean isSection = false; + + ContentItem(String n) { + name = n; + desc = ""; + isSection = true; + } + + ContentItem(String n, String d) { + name = n; + desc = d; + } +} diff --git a/MPChartExample/src/main/java/com/xxmassdeveloper/mpchartexample/notimportant/DemoBase.java b/MPChartExample/src/main/java/com/xxmassdeveloper/mpchartexample/notimportant/DemoBase.java new file mode 100644 index 00000000..a963609a --- /dev/null +++ b/MPChartExample/src/main/java/com/xxmassdeveloper/mpchartexample/notimportant/DemoBase.java @@ -0,0 +1,99 @@ + +package com.xxmassdeveloper.mpchartexample.notimportant; + +import android.Manifest; +import android.content.pm.PackageManager; +import android.graphics.Typeface; +import android.os.Bundle; +import androidx.annotation.NonNull; +import androidx.annotation.Nullable; +import com.google.android.material.snackbar.Snackbar; + +import androidx.appcompat.app.AppCompatActivity; +import androidx.core.app.ActivityCompat; +import android.view.View; +import android.widget.Toast; + +import com.github.mikephil.charting.charts.Chart; +import com.xxmassdeveloper.mpchartexample.R; + +/** + * Base class of all Activities of the Demo Application. + * + * @author Philipp Jahoda + */ +public abstract class DemoBase extends AppCompatActivity implements ActivityCompat.OnRequestPermissionsResultCallback { + + protected final String[] months = new String[] { + "Jan", "Feb", "Mar", "Apr", "May", "Jun", "Jul", "Aug", "Sep", "Okt", "Nov", "Dec" + }; + + protected final String[] parties = new String[] { + "Party A", "Party B", "Party C", "Party D", "Party E", "Party F", "Party G", "Party H", + "Party I", "Party J", "Party K", "Party L", "Party M", "Party N", "Party O", "Party P", + "Party Q", "Party R", "Party S", "Party T", "Party U", "Party V", "Party W", "Party X", + "Party Y", "Party Z" + }; + + private static final int PERMISSION_STORAGE = 0; + + protected Typeface tfRegular; + protected Typeface tfLight; + + @Override + protected void onCreate(@Nullable Bundle savedInstanceState) { + super.onCreate(savedInstanceState); + + tfRegular = Typeface.createFromAsset(getAssets(), "OpenSans-Regular.ttf"); + tfLight = Typeface.createFromAsset(getAssets(), "OpenSans-Light.ttf"); + } + + protected float getRandom(float range, float start) { + return (float) (Math.random() * range) + start; + } + + @Override + public void onBackPressed() { + super.onBackPressed(); + overridePendingTransition(R.anim.move_left_in_activity, R.anim.move_right_out_activity); + } + + @Override + public void onRequestPermissionsResult(int requestCode, @NonNull String[] permissions, @NonNull int[] grantResults) { + if (requestCode == PERMISSION_STORAGE) { + if (grantResults.length == 1 && grantResults[0] == PackageManager.PERMISSION_GRANTED) { + saveToGallery(); + } else { + Toast.makeText(getApplicationContext(), "Saving FAILED!", Toast.LENGTH_SHORT) + .show(); + } + } + } + + protected void requestStoragePermission(View view) { + if (ActivityCompat.shouldShowRequestPermissionRationale(this, Manifest.permission.WRITE_EXTERNAL_STORAGE)) { + Snackbar.make(view, "Write permission is required to save image to gallery", Snackbar.LENGTH_INDEFINITE) + .setAction(android.R.string.ok, new View.OnClickListener() { + @Override + public void onClick(View v) { + ActivityCompat.requestPermissions(DemoBase.this, new String[]{Manifest.permission.WRITE_EXTERNAL_STORAGE}, PERMISSION_STORAGE); + } + }).show(); + } else { + Toast.makeText(getApplicationContext(), "Permission Required!", Toast.LENGTH_SHORT) + .show(); + ActivityCompat.requestPermissions(DemoBase.this, new String[]{Manifest.permission.WRITE_EXTERNAL_STORAGE}, PERMISSION_STORAGE); + } + } + + protected void saveToGallery(Chart chart, String name) { + if (chart.saveToGallery(name + "_" + System.currentTimeMillis(), 70)) + Toast.makeText(getApplicationContext(), "Saving SUCCESSFUL!", + Toast.LENGTH_SHORT).show(); + else + Toast.makeText(getApplicationContext(), "Saving FAILED!", Toast.LENGTH_SHORT) + .show(); + } + + protected abstract void saveToGallery(); +} diff --git a/MPChartExample/src/main/java/com/xxmassdeveloper/mpchartexample/notimportant/MainActivity.java b/MPChartExample/src/main/java/com/xxmassdeveloper/mpchartexample/notimportant/MainActivity.java new file mode 100644 index 00000000..88e5dc8d --- /dev/null +++ b/MPChartExample/src/main/java/com/xxmassdeveloper/mpchartexample/notimportant/MainActivity.java @@ -0,0 +1,280 @@ + +package com.xxmassdeveloper.mpchartexample.notimportant; + +import android.content.Intent; +import android.net.Uri; +import android.os.Bundle; +import android.view.Menu; +import android.view.MenuItem; +import android.view.View; +import android.view.WindowManager; +import android.widget.AdapterView; +import android.widget.AdapterView.OnItemClickListener; +import android.widget.ListView; + +import com.github.mikephil.charting.utils.Utils; +import com.xxmassdeveloper.mpchartexample.AnotherBarActivity; +import com.xxmassdeveloper.mpchartexample.BarChartActivity; +import com.xxmassdeveloper.mpchartexample.BarChartActivityMultiDataset; +import com.xxmassdeveloper.mpchartexample.BarChartActivitySinus; +import com.xxmassdeveloper.mpchartexample.BarChartPositiveNegative; +import com.xxmassdeveloper.mpchartexample.BubbleChartActivity; +import com.xxmassdeveloper.mpchartexample.CandleStickChartActivity; +import com.xxmassdeveloper.mpchartexample.CombinedChartActivity; +import com.xxmassdeveloper.mpchartexample.CubicLineChartActivity; +import com.xxmassdeveloper.mpchartexample.DynamicalAddingActivity; +import com.xxmassdeveloper.mpchartexample.FilledLineActivity; +import com.xxmassdeveloper.mpchartexample.HalfPieChartActivity; +import com.xxmassdeveloper.mpchartexample.HorizontalBarChartActivity; +import com.xxmassdeveloper.mpchartexample.HorizontalBarNegativeChartActivity; +import com.xxmassdeveloper.mpchartexample.InvertedLineChartActivity; +import com.xxmassdeveloper.mpchartexample.LineChartActivity1; +import com.xxmassdeveloper.mpchartexample.LineChartActivity2; +import com.xxmassdeveloper.mpchartexample.LineChartActivityColored; +import com.xxmassdeveloper.mpchartexample.LineChartTime; +import com.xxmassdeveloper.mpchartexample.ListViewBarChartActivity; +import com.xxmassdeveloper.mpchartexample.ListViewMultiChartActivity; +import com.xxmassdeveloper.mpchartexample.MultiLineChartActivity; +import com.xxmassdeveloper.mpchartexample.PerformanceLineChart; +import com.xxmassdeveloper.mpchartexample.PieChartActivity; +import com.xxmassdeveloper.mpchartexample.PiePolylineChartActivity; +import com.xxmassdeveloper.mpchartexample.R; +import com.xxmassdeveloper.mpchartexample.RadarChartActivity; +import com.xxmassdeveloper.mpchartexample.RealtimeLineChartActivity; +import com.xxmassdeveloper.mpchartexample.ScatterChartActivity; +import com.xxmassdeveloper.mpchartexample.ScrollViewActivity; +import com.xxmassdeveloper.mpchartexample.StackedBarActivity; +import com.xxmassdeveloper.mpchartexample.StackedBarActivityNegative; +import com.xxmassdeveloper.mpchartexample.fragments.SimpleChartDemo; + +import java.util.ArrayList; + +import androidx.appcompat.app.AppCompatActivity; + +public class MainActivity extends AppCompatActivity implements OnItemClickListener { + + @Override + protected void onCreate(Bundle savedInstanceState) { + super.onCreate(savedInstanceState); + getWindow().setFlags(WindowManager.LayoutParams.FLAG_FULLSCREEN, + WindowManager.LayoutParams.FLAG_FULLSCREEN); + setContentView(R.layout.activity_main); + + setTitle("MPAndroidChart Example"); + + // initialize the utilities + Utils.init(this); + + ArrayList<ContentItem> objects = new ArrayList<>(); + + //// + objects.add(0, new ContentItem("Line Charts")); + + objects.add(1, new ContentItem("Basic", "Simple line chart.")); + objects.add(2, new ContentItem("Multiple", "Show multiple data sets.")); + objects.add(3, new ContentItem("Dual Axis", "Line chart with dual y-axes.")); + objects.add(4, new ContentItem("Inverted Axis", "Inverted y-axis.")); + objects.add(5, new ContentItem("Cubic", "Line chart with a cubic line shape.")); + objects.add(6, new ContentItem("Colorful", "Colorful line chart.")); + objects.add(7, new ContentItem("Performance", "Render 30.000 data points smoothly.")); + objects.add(8, new ContentItem("Filled", "Colored area between two lines.")); + + //// + objects.add(9, new ContentItem("Bar Charts")); + + objects.add(10, new ContentItem("Basic", "Simple bar chart.")); + objects.add(11, new ContentItem("Basic 2", "Variation of the simple bar chart.")); + objects.add(12, new ContentItem("Multiple", "Show multiple data sets.")); + objects.add(13, new ContentItem("Horizontal", "Render bar chart horizontally.")); + objects.add(14, new ContentItem("Stacked", "Stacked bar chart.")); + objects.add(15, new ContentItem("Negative", "Positive and negative values with unique colors.")); + objects.add(16, new ContentItem("Negative Horizontal", "demonstrates how to create a HorizontalBarChart with positive and negative values.")); + objects.add(17, new ContentItem("Stacked 2", "Stacked bar chart with negative values.")); + objects.add(18, new ContentItem("Sine", "Sine function in bar chart format.")); + + //// + objects.add(19, new ContentItem("Pie Charts")); + + objects.add(20, new ContentItem("Basic", "Simple pie chart.")); + objects.add(21, new ContentItem("Value Lines", "Stylish lines drawn outward from slices.")); + objects.add(22, new ContentItem("Half Pie", "180° (half) pie chart.")); + + //// + objects.add(23, new ContentItem("Other Charts")); + + objects.add(24, new ContentItem("Combined Chart", "Bar and line chart together.")); + objects.add(25, new ContentItem("Scatter Plot", "Simple scatter plot.")); + objects.add(26, new ContentItem("Bubble Chart", "Simple bubble chart.")); + objects.add(27, new ContentItem("Candlestick", "Simple financial chart.")); + objects.add(28, new ContentItem("Radar Chart", "Simple web chart.")); + + //// + objects.add(29, new ContentItem("Scrolling Charts")); + + objects.add(30, new ContentItem("Multiple", "Various types of charts as fragments.")); + objects.add(31, new ContentItem("View Pager", "Swipe through different charts.")); + objects.add(32, new ContentItem("Tall Bar Chart", "Bars bigger than your screen!")); + objects.add(33, new ContentItem("Many Bar Charts", "More bars than your screen can handle!")); + + //// + objects.add(34, new ContentItem("Even More Line Charts")); + + objects.add(35, new ContentItem("Dynamic", "Build a line chart by adding points and sets.")); + objects.add(36, new ContentItem("Realtime", "Add data points in realtime.")); + objects.add(37, new ContentItem("Hourly", "Uses the current time to add a data point for each hour.")); + //objects.add(38, new ContentItem("Realm.io Examples", "See more examples that use Realm.io mobile database.")); + + MyAdapter adapter = new MyAdapter(this, objects); + + ListView lv = findViewById(R.id.listView1); + lv.setAdapter(adapter); + + lv.setOnItemClickListener(this); + } + + @Override + public void onItemClick(AdapterView<?> av, View v, int pos, long arg3) { + + Intent i = null; + + switch (pos) { + case 1: + i = new Intent(this, LineChartActivity1.class); + break; + case 2: + i = new Intent(this, MultiLineChartActivity.class); + break; + case 3: + i = new Intent(this, LineChartActivity2.class); + break; + case 4: + i = new Intent(this, InvertedLineChartActivity.class); + break; + case 5: + i = new Intent(this, CubicLineChartActivity.class); + break; + case 6: + i = new Intent(this, LineChartActivityColored.class); + break; + case 7: + i = new Intent(this, PerformanceLineChart.class); + break; + case 8: + i = new Intent(this, FilledLineActivity.class); + break; + case 10: + i = new Intent(this, BarChartActivity.class); + break; + case 11: + i = new Intent(this, AnotherBarActivity.class); + break; + case 12: + i = new Intent(this, BarChartActivityMultiDataset.class); + break; + case 13: + i = new Intent(this, HorizontalBarChartActivity.class); + break; + case 14: + i = new Intent(this, StackedBarActivity.class); + break; + case 15: + i = new Intent(this, BarChartPositiveNegative.class); + break; + case 16: + i = new Intent(this, HorizontalBarNegativeChartActivity.class); + break; + case 17: + i = new Intent(this, StackedBarActivityNegative.class); + break; + case 18: + i = new Intent(this, BarChartActivitySinus.class); + break; + case 20: + i = new Intent(this, PieChartActivity.class); + break; + case 21: + i = new Intent(this, PiePolylineChartActivity.class); + break; + case 22: + i = new Intent(this, HalfPieChartActivity.class); + break; + case 24: + i = new Intent(this, CombinedChartActivity.class); + break; + case 25: + i = new Intent(this, ScatterChartActivity.class); + break; + case 26: + i = new Intent(this, BubbleChartActivity.class); + break; + case 27: + i = new Intent(this, CandleStickChartActivity.class); + break; + case 28: + i = new Intent(this, RadarChartActivity.class); + break; + case 30: + i = new Intent(this, ListViewMultiChartActivity.class); + break; + case 31: + i = new Intent(this, SimpleChartDemo.class); + break; + case 32: + i = new Intent(this, ScrollViewActivity.class); + break; + case 33: + i = new Intent(this, ListViewBarChartActivity.class); + break; + case 35: + i = new Intent(this, DynamicalAddingActivity.class); + break; + case 36: + i = new Intent(this, RealtimeLineChartActivity.class); + break; + case 37: + i = new Intent(this, LineChartTime.class); + break; + /*case 38: + i = new Intent(this, RealmMainActivity.class); + break;*/ + } + + if (i != null) startActivity(i); + + overridePendingTransition(R.anim.move_right_in_activity, R.anim.move_left_out_activity); + } + + @Override + public boolean onCreateOptionsMenu(Menu menu) { + getMenuInflater().inflate(R.menu.main, menu); + return true; + } + + @Override + public boolean onOptionsItemSelected(MenuItem item) { + + Intent i; + + switch (item.getItemId()) { + case R.id.viewGithub: + i = new Intent(Intent.ACTION_VIEW); + i.setData(Uri.parse("https://github.com/PhilJay/MPAndroidChart")); + startActivity(i); + break; + case R.id.report: + i = new Intent(Intent.ACTION_SENDTO, Uri.fromParts( + "mailto", "philjay.librarysup@gmail.com", null)); + i.putExtra(Intent.EXTRA_SUBJECT, "MPAndroidChart Issue"); + i.putExtra(Intent.EXTRA_TEXT, "Your error report here..."); + startActivity(Intent.createChooser(i, "Report Problem")); + break; + case R.id.website: + i = new Intent(Intent.ACTION_VIEW); + i.setData(Uri.parse("http://at.linkedin.com/in/philippjahoda")); + startActivity(i); + break; + } + + return true; + } +} diff --git a/MPChartExample/src/main/java/com/xxmassdeveloper/mpchartexample/notimportant/MyAdapter.java b/MPChartExample/src/main/java/com/xxmassdeveloper/mpchartexample/notimportant/MyAdapter.java new file mode 100644 index 00000000..9a22b51c --- /dev/null +++ b/MPChartExample/src/main/java/com/xxmassdeveloper/mpchartexample/notimportant/MyAdapter.java @@ -0,0 +1,71 @@ +package com.xxmassdeveloper.mpchartexample.notimportant; + +import android.annotation.SuppressLint; +import android.content.Context; +import android.graphics.Typeface; +import androidx.annotation.NonNull; + +import android.view.LayoutInflater; +import android.view.View; +import android.view.ViewGroup; +import android.widget.ArrayAdapter; +import android.widget.TextView; + +import com.xxmassdeveloper.mpchartexample.R; + +import java.util.List; + +/** + * Created by Philipp Jahoda on 07/12/15. + */ +class MyAdapter extends ArrayAdapter<ContentItem> { + + private final Typeface mTypeFaceLight; + private final Typeface mTypeFaceRegular; + + MyAdapter(Context context, List<ContentItem> objects) { + super(context, 0, objects); + + mTypeFaceLight = Typeface.createFromAsset(context.getAssets(), "OpenSans-Light.ttf"); + mTypeFaceRegular = Typeface.createFromAsset(context.getAssets(), "OpenSans-Regular.ttf"); + } + + @SuppressLint("InflateParams") + @NonNull + @Override + public View getView(int position, View convertView, @NonNull ViewGroup parent) { + + ContentItem c = getItem(position); + + ViewHolder holder; + + holder = new ViewHolder(); + + if (c != null && c.isSection) { + convertView = LayoutInflater.from(getContext()).inflate(R.layout.list_item_section, null); + } else { + convertView = LayoutInflater.from(getContext()).inflate(R.layout.list_item, null); + } + + holder.tvName = convertView.findViewById(R.id.tvName); + holder.tvDesc = convertView.findViewById(R.id.tvDesc); + + convertView.setTag(holder); + + if (c != null && c.isSection) + holder.tvName.setTypeface(mTypeFaceRegular); + else + holder.tvName.setTypeface(mTypeFaceLight); + holder.tvDesc.setTypeface(mTypeFaceLight); + + holder.tvName.setText(c != null ? c.name : null); + holder.tvDesc.setText(c != null ? c.desc : null); + + return convertView; + } + + private class ViewHolder { + + TextView tvName, tvDesc; + } +} diff --git a/MPChartExample/src/main/res/anim/move_left_in_activity.xml b/MPChartExample/src/main/res/anim/move_left_in_activity.xml new file mode 100644 index 00000000..086ea122 --- /dev/null +++ b/MPChartExample/src/main/res/anim/move_left_in_activity.xml @@ -0,0 +1,7 @@ +<?xml version="1.0" encoding="utf-8"?> +<translate + xmlns:android="http://schemas.android.com/apk/res/android" + android:duration="300" + android:fromXDelta="-100%p" + android:toXDelta="0%p"> +</translate>
\ No newline at end of file diff --git a/MPChartExample/src/main/res/anim/move_left_out_activity.xml b/MPChartExample/src/main/res/anim/move_left_out_activity.xml new file mode 100644 index 00000000..8ac6d51d --- /dev/null +++ b/MPChartExample/src/main/res/anim/move_left_out_activity.xml @@ -0,0 +1,7 @@ +<?xml version="1.0" encoding="utf-8"?> +<translate + xmlns:android="http://schemas.android.com/apk/res/android" + android:duration="300" + android:fromXDelta="0%p" + android:toXDelta="-100%p"> +</translate>
\ No newline at end of file diff --git a/MPChartExample/src/main/res/anim/move_right_in_activity.xml b/MPChartExample/src/main/res/anim/move_right_in_activity.xml new file mode 100644 index 00000000..d16f775f --- /dev/null +++ b/MPChartExample/src/main/res/anim/move_right_in_activity.xml @@ -0,0 +1,7 @@ +<?xml version="1.0" encoding="utf-8"?> +<translate + xmlns:android="http://schemas.android.com/apk/res/android" + android:duration="300" + android:fromXDelta="100%p" + android:toXDelta="0%p"> +</translate>
\ No newline at end of file diff --git a/MPChartExample/src/main/res/anim/move_right_out_activity.xml b/MPChartExample/src/main/res/anim/move_right_out_activity.xml new file mode 100644 index 00000000..948a4d90 --- /dev/null +++ b/MPChartExample/src/main/res/anim/move_right_out_activity.xml @@ -0,0 +1,7 @@ +<?xml version="1.0" encoding="utf-8"?> +<translate + xmlns:android="http://schemas.android.com/apk/res/android" + android:duration="300" + android:fromXDelta="0%p" + android:toXDelta="100%p"> +</translate>
\ No newline at end of file diff --git a/MPChartExample/src/main/res/drawable-hdpi/ic_launcher.png b/MPChartExample/src/main/res/drawable-hdpi/ic_launcher.png Binary files differnew file mode 100644 index 00000000..5e1dfa00 --- /dev/null +++ b/MPChartExample/src/main/res/drawable-hdpi/ic_launcher.png diff --git a/MPChartExample/src/main/res/drawable-hdpi/star.png b/MPChartExample/src/main/res/drawable-hdpi/star.png Binary files differnew file mode 100644 index 00000000..c7811ef2 --- /dev/null +++ b/MPChartExample/src/main/res/drawable-hdpi/star.png diff --git a/MPChartExample/src/main/res/drawable-mdpi/ic_launcher.png b/MPChartExample/src/main/res/drawable-mdpi/ic_launcher.png Binary files differnew file mode 100644 index 00000000..ebf59fa1 --- /dev/null +++ b/MPChartExample/src/main/res/drawable-mdpi/ic_launcher.png diff --git a/MPChartExample/src/main/res/drawable-nodpi/marker2.png b/MPChartExample/src/main/res/drawable-nodpi/marker2.png Binary files differnew file mode 100644 index 00000000..58054282 --- /dev/null +++ b/MPChartExample/src/main/res/drawable-nodpi/marker2.png diff --git a/MPChartExample/src/main/res/drawable-nodpi/radar_marker.png b/MPChartExample/src/main/res/drawable-nodpi/radar_marker.png Binary files differnew file mode 100644 index 00000000..a84b93b5 --- /dev/null +++ b/MPChartExample/src/main/res/drawable-nodpi/radar_marker.png diff --git a/MPChartExample/src/main/res/drawable-xhdpi/ic_launcher.png b/MPChartExample/src/main/res/drawable-xhdpi/ic_launcher.png Binary files differnew file mode 100644 index 00000000..26227f73 --- /dev/null +++ b/MPChartExample/src/main/res/drawable-xhdpi/ic_launcher.png diff --git a/MPChartExample/src/main/res/drawable-xxhdpi/ic_launcher.png b/MPChartExample/src/main/res/drawable-xxhdpi/ic_launcher.png Binary files differnew file mode 100644 index 00000000..73f55930 --- /dev/null +++ b/MPChartExample/src/main/res/drawable-xxhdpi/ic_launcher.png diff --git a/MPChartExample/src/main/res/drawable/fade_red.xml b/MPChartExample/src/main/res/drawable/fade_red.xml new file mode 100644 index 00000000..54ac10ba --- /dev/null +++ b/MPChartExample/src/main/res/drawable/fade_red.xml @@ -0,0 +1,7 @@ +<?xml version="1.0" encoding="utf-8"?> +<shape xmlns:android="http://schemas.android.com/apk/res/android"> + <gradient + android:angle="90" + android:startColor="#00ff0000" + android:endColor="#ffff0000" /> +</shape>
\ No newline at end of file diff --git a/MPChartExample/src/main/res/layout/activity_age_distribution.xml b/MPChartExample/src/main/res/layout/activity_age_distribution.xml new file mode 100644 index 00000000..574510fa --- /dev/null +++ b/MPChartExample/src/main/res/layout/activity_age_distribution.xml @@ -0,0 +1,12 @@ +<?xml version="1.0" encoding="utf-8"?> +<RelativeLayout xmlns:android="http://schemas.android.com/apk/res/android" + android:layout_width="match_parent" + android:layout_height="match_parent"> + + <com.github.mikephil.charting.charts.HorizontalBarChart + android:id="@+id/chart1" + android:layout_width="match_parent" + android:layout_height="match_parent" + android:background="@android:color/white" /> + +</RelativeLayout> diff --git a/MPChartExample/src/main/res/layout/activity_awesomedesign.xml b/MPChartExample/src/main/res/layout/activity_awesomedesign.xml new file mode 100644 index 00000000..647f0252 --- /dev/null +++ b/MPChartExample/src/main/res/layout/activity_awesomedesign.xml @@ -0,0 +1,13 @@ +<?xml version="1.0" encoding="utf-8"?> +<RelativeLayout xmlns:android="http://schemas.android.com/apk/res/android" + android:layout_width="match_parent" + android:layout_height="match_parent" + android:orientation="vertical"> + + <androidx.viewpager.widget.ViewPager + xmlns:android="http://schemas.android.com/apk/res/android" + android:id="@+id/pager" + android:layout_width="match_parent" + android:layout_height="match_parent" /> + +</RelativeLayout> diff --git a/MPChartExample/src/main/res/layout/activity_barchart.xml b/MPChartExample/src/main/res/layout/activity_barchart.xml new file mode 100644 index 00000000..14b7f3f0 --- /dev/null +++ b/MPChartExample/src/main/res/layout/activity_barchart.xml @@ -0,0 +1,60 @@ +<?xml version="1.0" encoding="utf-8"?> +<RelativeLayout xmlns:android="http://schemas.android.com/apk/res/android" + android:layout_width="match_parent" + android:layout_height="match_parent"> + + <com.github.mikephil.charting.charts.BarChart + android:id="@+id/chart1" + android:layout_width="match_parent" + android:layout_height="match_parent" + android:layout_above="@+id/seekBar1" /> + + <SeekBar + android:id="@+id/seekBar2" + android:layout_width="match_parent" + android:layout_height="wrap_content" + android:layout_alignParentBottom="true" + android:layout_alignParentLeft="true" + android:layout_margin="8dp" + android:layout_toLeftOf="@+id/tvYMax" + android:layout_marginRight="5dp" + android:max="200" + android:paddingBottom="12dp" /> + + <SeekBar + android:id="@+id/seekBar1" + android:layout_width="match_parent" + android:layout_height="wrap_content" + android:layout_above="@+id/seekBar2" + android:layout_margin="8dp" + android:layout_marginBottom="35dp" + android:layout_toLeftOf="@+id/tvXMax" + android:layout_marginRight="5dp" + android:max="1500" + android:paddingBottom="12dp" /> + + <TextView + android:id="@+id/tvXMax" + android:layout_width="60dp" + android:layout_height="wrap_content" + android:layout_alignBottom="@+id/seekBar1" + android:layout_alignParentRight="true" + android:text="@string/dash" + android:layout_marginBottom="15dp" + android:layout_marginRight="10dp" + android:gravity="right" + android:textAppearance="?android:attr/textAppearanceSmall" /> + + <TextView + android:id="@+id/tvYMax" + android:layout_width="60dp" + android:layout_height="wrap_content" + android:layout_alignBottom="@+id/seekBar2" + android:layout_alignParentRight="true" + android:text="@string/dash" + android:layout_marginBottom="15dp" + android:layout_marginRight="10dp" + android:gravity="right" + android:textAppearance="?android:attr/textAppearanceSmall" /> + +</RelativeLayout> diff --git a/MPChartExample/src/main/res/layout/activity_barchart_noseekbar.xml b/MPChartExample/src/main/res/layout/activity_barchart_noseekbar.xml new file mode 100644 index 00000000..90a8c0f5 --- /dev/null +++ b/MPChartExample/src/main/res/layout/activity_barchart_noseekbar.xml @@ -0,0 +1,11 @@ +<?xml version="1.0" encoding="utf-8"?> +<RelativeLayout xmlns:android="http://schemas.android.com/apk/res/android" + android:layout_width="match_parent" + android:layout_height="match_parent"> + + <com.github.mikephil.charting.charts.BarChart + android:id="@+id/chart1" + android:layout_width="match_parent" + android:layout_height="match_parent" /> + +</RelativeLayout> diff --git a/MPChartExample/src/main/res/layout/activity_barchart_sinus.xml b/MPChartExample/src/main/res/layout/activity_barchart_sinus.xml new file mode 100644 index 00000000..f39f2c77 --- /dev/null +++ b/MPChartExample/src/main/res/layout/activity_barchart_sinus.xml @@ -0,0 +1,37 @@ +<?xml version="1.0" encoding="utf-8"?> +<RelativeLayout xmlns:android="http://schemas.android.com/apk/res/android" + android:layout_width="match_parent" + android:layout_height="match_parent"> + + <com.github.mikephil.charting.charts.BarChart + android:id="@+id/chart1" + android:layout_width="match_parent" + android:layout_height="match_parent" + android:layout_above="@+id/seekbarValues" /> + + <SeekBar + android:id="@+id/seekbarValues" + android:layout_width="match_parent" + android:layout_height="wrap_content" + android:layout_alignParentBottom="true" + android:layout_alignParentLeft="true" + android:layout_margin="8dp" + android:layout_marginBottom="35dp" + android:layout_toLeftOf="@+id/tvValueCount" + android:layout_marginRight="5dp" + android:max="8000" + android:paddingBottom="12dp" /> + + <TextView + android:id="@+id/tvValueCount" + android:layout_width="60dp" + android:layout_height="wrap_content" + android:layout_alignBottom="@+id/seekbarValues" + android:layout_alignParentRight="true" + android:text="@string/dash" + android:layout_marginBottom="15dp" + android:layout_marginRight="10dp" + android:gravity="right" + android:textAppearance="?android:attr/textAppearanceMedium" /> + +</RelativeLayout> diff --git a/MPChartExample/src/main/res/layout/activity_bubblechart.xml b/MPChartExample/src/main/res/layout/activity_bubblechart.xml new file mode 100644 index 00000000..d3df042f --- /dev/null +++ b/MPChartExample/src/main/res/layout/activity_bubblechart.xml @@ -0,0 +1,61 @@ +<?xml version="1.0" encoding="utf-8"?> +<RelativeLayout xmlns:android="http://schemas.android.com/apk/res/android" + android:layout_width="match_parent" + android:layout_height="match_parent"> + + <com.github.mikephil.charting.charts.BubbleChart + android:id="@+id/chart1" + android:layout_width="match_parent" + android:layout_height="match_parent" + android:background="@android:color/white" + android:layout_above="@+id/seekBar1" /> + + <SeekBar + android:id="@+id/seekBar2" + android:layout_width="match_parent" + android:layout_height="wrap_content" + android:layout_alignParentBottom="true" + android:layout_alignParentLeft="true" + android:layout_margin="8dp" + android:layout_toLeftOf="@+id/tvYMax" + android:layout_marginRight="5dp" + android:max="200" + android:paddingBottom="12dp" /> + + <SeekBar + android:id="@+id/seekBar1" + android:layout_width="match_parent" + android:layout_height="wrap_content" + android:layout_above="@+id/seekBar2" + android:layout_margin="8dp" + android:layout_marginBottom="35dp" + android:layout_toLeftOf="@+id/tvXMax" + android:layout_marginRight="5dp" + android:max="100" + android:paddingBottom="12dp" /> + + <TextView + android:id="@+id/tvXMax" + android:layout_width="50dp" + android:layout_height="wrap_content" + android:layout_alignBottom="@+id/seekBar1" + android:layout_alignParentRight="true" + android:text="@string/dash" + android:layout_marginBottom="15dp" + android:layout_marginRight="10dp" + android:gravity="right" + android:textAppearance="?android:attr/textAppearanceMedium" /> + + <TextView + android:id="@+id/tvYMax" + android:layout_width="50dp" + android:layout_height="wrap_content" + android:layout_alignBottom="@+id/seekBar2" + android:layout_alignParentRight="true" + android:text="@string/dash" + android:layout_marginBottom="15dp" + android:layout_marginRight="10dp" + android:gravity="right" + android:textAppearance="?android:attr/textAppearanceMedium" /> + +</RelativeLayout> diff --git a/MPChartExample/src/main/res/layout/activity_candlechart.xml b/MPChartExample/src/main/res/layout/activity_candlechart.xml new file mode 100644 index 00000000..39df4c81 --- /dev/null +++ b/MPChartExample/src/main/res/layout/activity_candlechart.xml @@ -0,0 +1,60 @@ +<?xml version="1.0" encoding="utf-8"?> +<RelativeLayout xmlns:android="http://schemas.android.com/apk/res/android" + android:layout_width="match_parent" + android:layout_height="match_parent"> + + <com.github.mikephil.charting.charts.CandleStickChart + android:id="@+id/chart1" + android:layout_width="match_parent" + android:layout_height="match_parent" + android:layout_above="@+id/seekBar1" /> + + <SeekBar + android:id="@+id/seekBar2" + android:layout_width="match_parent" + android:layout_height="wrap_content" + android:layout_alignParentBottom="true" + android:layout_alignParentLeft="true" + android:layout_margin="8dp" + android:layout_toLeftOf="@+id/tvYMax" + android:layout_marginRight="5dp" + android:max="200" + android:paddingBottom="12dp" /> + + <SeekBar + android:id="@+id/seekBar1" + android:layout_width="match_parent" + android:layout_height="wrap_content" + android:layout_above="@+id/seekBar2" + android:layout_margin="8dp" + android:layout_marginBottom="35dp" + android:layout_toLeftOf="@+id/tvXMax" + android:layout_marginRight="5dp" + android:max="3000" + android:paddingBottom="12dp" /> + + <TextView + android:id="@+id/tvXMax" + android:layout_width="50dp" + android:layout_height="wrap_content" + android:layout_alignBottom="@+id/seekBar1" + android:layout_alignParentRight="true" + android:text="@string/dash" + android:layout_marginBottom="15dp" + android:layout_marginRight="10dp" + android:gravity="right" + android:textAppearance="?android:attr/textAppearanceMedium" /> + + <TextView + android:id="@+id/tvYMax" + android:layout_width="50dp" + android:layout_height="wrap_content" + android:layout_alignBottom="@+id/seekBar2" + android:layout_alignParentRight="true" + android:text="@string/dash" + android:layout_marginBottom="15dp" + android:layout_marginRight="10dp" + android:gravity="right" + android:textAppearance="?android:attr/textAppearanceMedium" /> + +</RelativeLayout> diff --git a/MPChartExample/src/main/res/layout/activity_colored_lines.xml b/MPChartExample/src/main/res/layout/activity_colored_lines.xml new file mode 100644 index 00000000..f6b61cfc --- /dev/null +++ b/MPChartExample/src/main/res/layout/activity_colored_lines.xml @@ -0,0 +1,27 @@ +<?xml version="1.0" encoding="utf-8"?> +<LinearLayout xmlns:android="http://schemas.android.com/apk/res/android" + android:layout_width="match_parent" + android:layout_height="match_parent" + android:orientation="vertical"> + + <com.github.mikephil.charting.charts.LineChart + android:id="@+id/chart1" + android:layout_weight="1" + android:layout_width="match_parent" + android:layout_height="match_parent"/> + <com.github.mikephil.charting.charts.LineChart + android:id="@+id/chart2" + android:layout_weight="1" + android:layout_width="match_parent" + android:layout_height="match_parent"/> + <com.github.mikephil.charting.charts.LineChart + android:id="@+id/chart3" + android:layout_weight="1" + android:layout_width="match_parent" + android:layout_height="match_parent"/> + <com.github.mikephil.charting.charts.LineChart + android:id="@+id/chart4" + android:layout_weight="1" + android:layout_width="match_parent" + android:layout_height="match_parent"/> +</LinearLayout> diff --git a/MPChartExample/src/main/res/layout/activity_combined.xml b/MPChartExample/src/main/res/layout/activity_combined.xml new file mode 100644 index 00000000..e9b37240 --- /dev/null +++ b/MPChartExample/src/main/res/layout/activity_combined.xml @@ -0,0 +1,11 @@ +<?xml version="1.0" encoding="utf-8"?> +<RelativeLayout xmlns:android="http://schemas.android.com/apk/res/android" + android:layout_width="match_parent" + android:layout_height="match_parent"> + + <com.github.mikephil.charting.charts.CombinedChart + android:id="@+id/chart1" + android:layout_width="match_parent" + android:layout_height="match_parent"/> + +</RelativeLayout> diff --git a/MPChartExample/src/main/res/layout/activity_draw_chart.xml b/MPChartExample/src/main/res/layout/activity_draw_chart.xml new file mode 100644 index 00000000..5e2f1a21 --- /dev/null +++ b/MPChartExample/src/main/res/layout/activity_draw_chart.xml @@ -0,0 +1,11 @@ +<?xml version="1.0" encoding="utf-8"?> +<RelativeLayout xmlns:android="http://schemas.android.com/apk/res/android" + android:layout_width="match_parent" + android:layout_height="match_parent"> + + <com.github.mikephil.charting.charts.LineChart + android:id="@+id/chart1" + android:layout_width="match_parent" + android:layout_height="match_parent" /> + +</RelativeLayout> diff --git a/MPChartExample/src/main/res/layout/activity_horizontalbarchart.xml b/MPChartExample/src/main/res/layout/activity_horizontalbarchart.xml new file mode 100644 index 00000000..ee6023c7 --- /dev/null +++ b/MPChartExample/src/main/res/layout/activity_horizontalbarchart.xml @@ -0,0 +1,61 @@ +<?xml version="1.0" encoding="utf-8"?> +<RelativeLayout xmlns:android="http://schemas.android.com/apk/res/android" + android:layout_width="match_parent" + android:layout_height="match_parent"> + + <com.github.mikephil.charting.charts.HorizontalBarChart + android:id="@+id/chart1" + android:layout_width="match_parent" + android:layout_height="match_parent" + android:background="@android:color/white" + android:layout_above="@+id/seekBar1" /> + + <SeekBar + android:id="@+id/seekBar2" + android:layout_width="match_parent" + android:layout_height="wrap_content" + android:layout_alignParentBottom="true" + android:layout_alignParentLeft="true" + android:layout_margin="8dp" + android:layout_toLeftOf="@+id/tvYMax" + android:layout_marginRight="5dp" + android:max="200" + android:paddingBottom="12dp" /> + + <SeekBar + android:id="@+id/seekBar1" + android:layout_width="match_parent" + android:layout_height="wrap_content" + android:layout_above="@+id/seekBar2" + android:layout_margin="8dp" + android:layout_marginBottom="35dp" + android:layout_toLeftOf="@+id/tvXMax" + android:layout_marginRight="5dp" + android:max="500" + android:paddingBottom="12dp" /> + + <TextView + android:id="@+id/tvXMax" + android:layout_width="50dp" + android:layout_height="wrap_content" + android:layout_alignBottom="@+id/seekBar1" + android:layout_alignParentRight="true" + android:text="@string/dash" + android:layout_marginBottom="15dp" + android:layout_marginRight="10dp" + android:gravity="right" + android:textAppearance="?android:attr/textAppearanceMedium" /> + + <TextView + android:id="@+id/tvYMax" + android:layout_width="50dp" + android:layout_height="wrap_content" + android:layout_alignBottom="@+id/seekBar2" + android:layout_alignParentRight="true" + android:text="@string/dash" + android:layout_marginBottom="15dp" + android:layout_marginRight="10dp" + android:gravity="right" + android:textAppearance="?android:attr/textAppearanceMedium" /> + +</RelativeLayout> diff --git a/MPChartExample/src/main/res/layout/activity_linechart.xml b/MPChartExample/src/main/res/layout/activity_linechart.xml new file mode 100644 index 00000000..d7cd3a1e --- /dev/null +++ b/MPChartExample/src/main/res/layout/activity_linechart.xml @@ -0,0 +1,61 @@ +<?xml version="1.0" encoding="utf-8"?> +<RelativeLayout + xmlns:android="http://schemas.android.com/apk/res/android" + android:layout_width="match_parent" + android:layout_height="match_parent"> + + <com.github.mikephil.charting.charts.LineChart + android:id="@+id/chart1" + android:layout_width="match_parent" + android:layout_height="match_parent" + android:layout_above="@+id/seekBar1" /> + + <SeekBar + android:id="@+id/seekBar2" + android:layout_width="match_parent" + android:layout_height="wrap_content" + android:layout_alignParentBottom="true" + android:layout_alignParentLeft="true" + android:layout_margin="8dp" + android:layout_toLeftOf="@+id/tvYMax" + android:layout_marginRight="5dp" + android:max="150" + android:paddingBottom="12dp" /> + + <SeekBar + android:id="@+id/seekBar1" + android:layout_width="match_parent" + android:layout_height="wrap_content" + android:layout_above="@+id/seekBar2" + android:layout_margin="8dp" + android:layout_marginBottom="35dp" + android:layout_toLeftOf="@+id/tvXMax" + android:layout_marginRight="5dp" + android:max="500" + android:paddingBottom="12dp" /> + + <TextView + android:id="@+id/tvXMax" + android:layout_width="50dp" + android:layout_height="wrap_content" + android:layout_alignBottom="@+id/seekBar1" + android:layout_alignParentRight="true" + android:text="@string/dash" + android:layout_marginBottom="15dp" + android:layout_marginRight="10dp" + android:gravity="right" + android:textAppearance="?android:attr/textAppearanceMedium" /> + + <TextView + android:id="@+id/tvYMax" + android:layout_width="50dp" + android:layout_height="wrap_content" + android:layout_alignBottom="@+id/seekBar2" + android:layout_alignParentRight="true" + android:text="@string/dash" + android:layout_marginBottom="15dp" + android:layout_marginRight="10dp" + android:gravity="right" + android:textAppearance="?android:attr/textAppearanceMedium" /> + +</RelativeLayout> diff --git a/MPChartExample/src/main/res/layout/activity_linechart_noseekbar.xml b/MPChartExample/src/main/res/layout/activity_linechart_noseekbar.xml new file mode 100644 index 00000000..5e2f1a21 --- /dev/null +++ b/MPChartExample/src/main/res/layout/activity_linechart_noseekbar.xml @@ -0,0 +1,11 @@ +<?xml version="1.0" encoding="utf-8"?> +<RelativeLayout xmlns:android="http://schemas.android.com/apk/res/android" + android:layout_width="match_parent" + android:layout_height="match_parent"> + + <com.github.mikephil.charting.charts.LineChart + android:id="@+id/chart1" + android:layout_width="match_parent" + android:layout_height="match_parent" /> + +</RelativeLayout> diff --git a/MPChartExample/src/main/res/layout/activity_linechart_time.xml b/MPChartExample/src/main/res/layout/activity_linechart_time.xml new file mode 100644 index 00000000..c63d3e6f --- /dev/null +++ b/MPChartExample/src/main/res/layout/activity_linechart_time.xml @@ -0,0 +1,35 @@ +<?xml version="1.0" encoding="utf-8"?> +<RelativeLayout xmlns:android="http://schemas.android.com/apk/res/android" + android:layout_width="match_parent" + android:layout_height="match_parent"> + + <com.github.mikephil.charting.charts.LineChart + android:id="@+id/chart1" + android:layout_width="match_parent" + android:layout_height="match_parent" + android:layout_above="@+id/seekBar1" /> + + <SeekBar + android:id="@+id/seekBar1" + android:layout_width="match_parent" + android:layout_height="wrap_content" + android:layout_marginBottom="8dp" + android:max="1500" + android:layout_alignParentBottom="true" + android:layout_marginLeft="8dp" + android:layout_marginTop="8dp" + android:layout_toLeftOf="@+id/tvXMax"/> + + <TextView + android:id="@+id/tvXMax" + android:layout_width="50dp" + android:layout_height="wrap_content" + android:layout_alignParentRight="true" + android:text="@string/dash" + android:layout_marginBottom="15dp" + android:layout_marginRight="10dp" + android:gravity="right" + android:layout_alignParentBottom="true" + android:textAppearance="?android:attr/textAppearanceMedium" /> + +</RelativeLayout> diff --git a/MPChartExample/src/main/res/layout/activity_listview_chart.xml b/MPChartExample/src/main/res/layout/activity_listview_chart.xml new file mode 100644 index 00000000..12aa2f85 --- /dev/null +++ b/MPChartExample/src/main/res/layout/activity_listview_chart.xml @@ -0,0 +1,13 @@ +<?xml version="1.0" encoding="utf-8"?> +<LinearLayout xmlns:android="http://schemas.android.com/apk/res/android" + android:layout_width="match_parent" + android:layout_height="match_parent" + android:orientation="vertical"> + + <ListView + android:id="@+id/listView1" + android:layout_width="match_parent" + android:layout_height="match_parent" > + </ListView> + +</LinearLayout> diff --git a/MPChartExample/src/main/res/layout/activity_main.xml b/MPChartExample/src/main/res/layout/activity_main.xml new file mode 100644 index 00000000..6ff7d6b7 --- /dev/null +++ b/MPChartExample/src/main/res/layout/activity_main.xml @@ -0,0 +1,8 @@ +<?xml version="1.0" encoding="utf-8"?> +<ListView xmlns:android="http://schemas.android.com/apk/res/android" + android:id="@+id/listView1" + android:layout_width="fill_parent" + android:layout_height="fill_parent" + android:scrollbarFadeDuration="0"> + +</ListView> diff --git a/MPChartExample/src/main/res/layout/activity_performance_linechart.xml b/MPChartExample/src/main/res/layout/activity_performance_linechart.xml new file mode 100644 index 00000000..515321e1 --- /dev/null +++ b/MPChartExample/src/main/res/layout/activity_performance_linechart.xml @@ -0,0 +1,37 @@ +<?xml version="1.0" encoding="utf-8"?> +<RelativeLayout xmlns:android="http://schemas.android.com/apk/res/android" + android:layout_width="match_parent" + android:layout_height="match_parent"> + + <com.github.mikephil.charting.charts.LineChart + android:id="@+id/chart1" + android:layout_width="match_parent" + android:layout_height="match_parent" + android:layout_above="@+id/seekbarValues" /> + + <SeekBar + android:id="@+id/seekbarValues" + android:layout_width="match_parent" + android:layout_height="wrap_content" + android:layout_alignParentBottom="true" + android:layout_alignParentLeft="true" + android:layout_margin="8dp" + android:layout_marginBottom="35dp" + android:layout_toLeftOf="@+id/tvValueCount" + android:layout_marginRight="5dp" + android:max="29000" + android:paddingBottom="12dp" /> + + <TextView + android:id="@+id/tvValueCount" + android:layout_width="60dp" + android:layout_height="wrap_content" + android:layout_alignBottom="@+id/seekbarValues" + android:layout_alignParentRight="true" + android:text="@string/dash" + android:layout_marginBottom="15dp" + android:layout_marginRight="10dp" + android:gravity="right" + android:textAppearance="?android:attr/textAppearanceMedium" /> + +</RelativeLayout> diff --git a/MPChartExample/src/main/res/layout/activity_piechart.xml b/MPChartExample/src/main/res/layout/activity_piechart.xml new file mode 100644 index 00000000..cac0b4a4 --- /dev/null +++ b/MPChartExample/src/main/res/layout/activity_piechart.xml @@ -0,0 +1,60 @@ +<?xml version="1.0" encoding="utf-8"?> +<RelativeLayout xmlns:android="http://schemas.android.com/apk/res/android" + android:layout_width="match_parent" + android:layout_height="match_parent"> + + <com.github.mikephil.charting.charts.PieChart + android:id="@+id/chart1" + android:layout_width="match_parent" + android:layout_height="match_parent" + android:layout_above="@+id/seekBar1" /> + + <SeekBar + android:id="@+id/seekBar2" + android:layout_width="match_parent" + android:layout_height="wrap_content" + android:layout_alignParentBottom="true" + android:layout_alignParentLeft="true" + android:layout_margin="8dp" + android:layout_toLeftOf="@+id/tvYMax" + android:layout_marginRight="5dp" + android:max="200" + android:paddingBottom="12dp" /> + + <SeekBar + android:id="@+id/seekBar1" + android:layout_width="match_parent" + android:layout_height="wrap_content" + android:layout_above="@+id/seekBar2" + android:layout_margin="8dp" + android:layout_marginBottom="35dp" + android:layout_toLeftOf="@+id/tvXMax" + android:layout_marginRight="5dp" + android:max="25" + android:paddingBottom="12dp" /> + + <TextView + android:id="@+id/tvXMax" + android:layout_width="50dp" + android:layout_height="wrap_content" + android:layout_alignBottom="@+id/seekBar1" + android:layout_alignParentRight="true" + android:text="@string/dash" + android:layout_marginBottom="15dp" + android:layout_marginRight="10dp" + android:gravity="right" + android:textAppearance="?android:attr/textAppearanceMedium" /> + + <TextView + android:id="@+id/tvYMax" + android:layout_width="50dp" + android:layout_height="wrap_content" + android:layout_alignBottom="@+id/seekBar2" + android:layout_alignParentRight="true" + android:text="@string/dash" + android:layout_marginBottom="15dp" + android:layout_marginRight="10dp" + android:gravity="right" + android:textAppearance="?android:attr/textAppearanceMedium" /> + +</RelativeLayout> diff --git a/MPChartExample/src/main/res/layout/activity_piechart_half.xml b/MPChartExample/src/main/res/layout/activity_piechart_half.xml new file mode 100644 index 00000000..a92eec3c --- /dev/null +++ b/MPChartExample/src/main/res/layout/activity_piechart_half.xml @@ -0,0 +1,11 @@ +<?xml version="1.0" encoding="utf-8"?> +<RelativeLayout xmlns:android="http://schemas.android.com/apk/res/android" + android:layout_width="match_parent" + android:layout_height="match_parent"> + + <com.github.mikephil.charting.charts.PieChart + android:id="@+id/chart1" + android:layout_width="match_parent" + android:layout_height="match_parent" /> + +</RelativeLayout> diff --git a/MPChartExample/src/main/res/layout/activity_radarchart.xml b/MPChartExample/src/main/res/layout/activity_radarchart.xml new file mode 100644 index 00000000..aff98010 --- /dev/null +++ b/MPChartExample/src/main/res/layout/activity_radarchart.xml @@ -0,0 +1,11 @@ +<?xml version="1.0" encoding="utf-8"?> +<RelativeLayout xmlns:android="http://schemas.android.com/apk/res/android" + android:layout_width="match_parent" + android:layout_height="match_parent"> + + <com.github.mikephil.charting.charts.RadarChart + android:id="@+id/chart1" + android:layout_width="match_parent" + android:layout_height="match_parent" /> + +</RelativeLayout> diff --git a/MPChartExample/src/main/res/layout/activity_realtime_linechart.xml b/MPChartExample/src/main/res/layout/activity_realtime_linechart.xml new file mode 100644 index 00000000..9ee392a8 --- /dev/null +++ b/MPChartExample/src/main/res/layout/activity_realtime_linechart.xml @@ -0,0 +1,11 @@ +<?xml version="1.0" encoding="utf-8"?> +<RelativeLayout xmlns:android="http://schemas.android.com/apk/res/android" + android:layout_width="match_parent" + android:layout_height="match_parent"> + + <com.github.mikephil.charting.charts.LineChart + android:id="@+id/chart1" + android:layout_width="match_parent" + android:layout_height="match_parent"/> + +</RelativeLayout> diff --git a/MPChartExample/src/main/res/layout/activity_scatterchart.xml b/MPChartExample/src/main/res/layout/activity_scatterchart.xml new file mode 100644 index 00000000..41df167e --- /dev/null +++ b/MPChartExample/src/main/res/layout/activity_scatterchart.xml @@ -0,0 +1,60 @@ +<?xml version="1.0" encoding="utf-8"?> +<RelativeLayout xmlns:android="http://schemas.android.com/apk/res/android" + android:layout_width="match_parent" + android:layout_height="match_parent"> + + <com.github.mikephil.charting.charts.ScatterChart + android:id="@+id/chart1" + android:layout_width="match_parent" + android:layout_height="match_parent" + android:layout_above="@+id/seekBar1" /> + + <SeekBar + android:id="@+id/seekBar2" + android:layout_width="match_parent" + android:layout_height="wrap_content" + android:layout_alignParentBottom="true" + android:layout_alignParentLeft="true" + android:layout_margin="8dp" + android:layout_toLeftOf="@+id/tvYMax" + android:layout_marginRight="5dp" + android:max="200" + android:paddingBottom="12dp" /> + + <SeekBar + android:id="@+id/seekBar1" + android:layout_width="match_parent" + android:layout_height="wrap_content" + android:layout_above="@+id/seekBar2" + android:layout_margin="8dp" + android:layout_marginBottom="35dp" + android:layout_toLeftOf="@+id/tvXMax" + android:layout_marginRight="5dp" + android:max="500" + android:paddingBottom="12dp" /> + + <TextView + android:id="@+id/tvXMax" + android:layout_width="50dp" + android:layout_height="wrap_content" + android:layout_alignBottom="@+id/seekBar1" + android:layout_alignParentRight="true" + android:text="@string/dash" + android:layout_marginBottom="15dp" + android:layout_marginRight="10dp" + android:gravity="right" + android:textAppearance="?android:attr/textAppearanceMedium" /> + + <TextView + android:id="@+id/tvYMax" + android:layout_width="50dp" + android:layout_height="wrap_content" + android:layout_alignBottom="@+id/seekBar2" + android:layout_alignParentRight="true" + android:text="@string/dash" + android:layout_marginBottom="15dp" + android:layout_marginRight="10dp" + android:gravity="right" + android:textAppearance="?android:attr/textAppearanceMedium" /> + +</RelativeLayout> diff --git a/MPChartExample/src/main/res/layout/activity_scrollview.xml b/MPChartExample/src/main/res/layout/activity_scrollview.xml new file mode 100644 index 00000000..f4865426 --- /dev/null +++ b/MPChartExample/src/main/res/layout/activity_scrollview.xml @@ -0,0 +1,42 @@ +<?xml version="1.0" encoding="utf-8"?> +<ScrollView xmlns:android="http://schemas.android.com/apk/res/android" + android:layout_width="match_parent" + android:layout_height="wrap_content"> + + <LinearLayout + android:layout_width="match_parent" + android:layout_height="wrap_content" + android:orientation="vertical" > + + <TextView + android:layout_width="match_parent" + android:layout_height="30dp" + android:gravity="center" + android:text="@string/scrollViewStart" /> + + <!-- THIS IS JUST A PLACEHOLDER --> + + <View + android:layout_width="match_parent" + android:layout_height="350dp" /> + + <com.github.mikephil.charting.charts.BarChart + android:id="@+id/chart1" + android:layout_width="match_parent" + android:layout_height="450dp" /> + + <!-- THIS IS JUST A PLACEHOLDER --> + + <View + android:layout_width="match_parent" + android:layout_height="700dp" /> + + <TextView + android:layout_width="match_parent" + android:layout_height="30dp" + android:gravity="center" + android:text="@string/scrollViewEnd" /> + + </LinearLayout> + +</ScrollView> diff --git a/MPChartExample/src/main/res/layout/custom_marker_view.xml b/MPChartExample/src/main/res/layout/custom_marker_view.xml new file mode 100644 index 00000000..f8444bf8 --- /dev/null +++ b/MPChartExample/src/main/res/layout/custom_marker_view.xml @@ -0,0 +1,24 @@ +<?xml version="1.0" encoding="utf-8"?> +<RelativeLayout xmlns:android="http://schemas.android.com/apk/res/android" + xmlns:tools="http://schemas.android.com/tools" + android:layout_width="wrap_content" + android:layout_height="40dp" + android:background="@drawable/marker2" + tools:ignore="Overdraw"> + + <TextView + android:id="@+id/tvContent" + android:layout_width="wrap_content" + android:layout_height="wrap_content" + android:layout_centerHorizontal="true" + android:layout_marginTop="7dp" + android:layout_marginLeft="5dp" + android:layout_marginRight="5dp" + android:text="" + android:textSize="12sp" + android:textColor="@android:color/white" + android:ellipsize="end" + android:singleLine="true" + android:textAppearance="?android:attr/textAppearanceSmall" /> + +</RelativeLayout> diff --git a/MPChartExample/src/main/res/layout/frag_simple_bar.xml b/MPChartExample/src/main/res/layout/frag_simple_bar.xml new file mode 100644 index 00000000..d24c05bf --- /dev/null +++ b/MPChartExample/src/main/res/layout/frag_simple_bar.xml @@ -0,0 +1,10 @@ +<?xml version="1.0" encoding="utf-8"?> +<FrameLayout xmlns:android="http://schemas.android.com/apk/res/android" + android:id="@+id/parentLayout" + android:layout_width="match_parent" + android:layout_height="match_parent" + android:orientation="vertical" > + + <!-- We add the chart programmatically here. See BarChartFrag.java --> + +</FrameLayout> diff --git a/MPChartExample/src/main/res/layout/frag_simple_line.xml b/MPChartExample/src/main/res/layout/frag_simple_line.xml new file mode 100644 index 00000000..7a275747 --- /dev/null +++ b/MPChartExample/src/main/res/layout/frag_simple_line.xml @@ -0,0 +1,12 @@ +<?xml version="1.0" encoding="utf-8"?> +<FrameLayout xmlns:android="http://schemas.android.com/apk/res/android" + android:layout_width="match_parent" + android:layout_height="match_parent" + android:orientation="vertical" > + + <com.github.mikephil.charting.charts.LineChart + android:id="@+id/lineChart1" + android:layout_width="match_parent" + android:layout_height="match_parent" /> + +</FrameLayout> diff --git a/MPChartExample/src/main/res/layout/frag_simple_pie.xml b/MPChartExample/src/main/res/layout/frag_simple_pie.xml new file mode 100644 index 00000000..ed490ddb --- /dev/null +++ b/MPChartExample/src/main/res/layout/frag_simple_pie.xml @@ -0,0 +1,12 @@ +<?xml version="1.0" encoding="utf-8"?> +<LinearLayout xmlns:android="http://schemas.android.com/apk/res/android" + android:layout_width="match_parent" + android:layout_height="match_parent" + android:orientation="vertical" > + + <com.github.mikephil.charting.charts.PieChart + android:id="@+id/pieChart1" + android:layout_width="match_parent" + android:layout_height="match_parent" /> + +</LinearLayout> diff --git a/MPChartExample/src/main/res/layout/frag_simple_scatter.xml b/MPChartExample/src/main/res/layout/frag_simple_scatter.xml new file mode 100644 index 00000000..2e42332d --- /dev/null +++ b/MPChartExample/src/main/res/layout/frag_simple_scatter.xml @@ -0,0 +1,12 @@ +<?xml version="1.0" encoding="utf-8"?> +<LinearLayout xmlns:android="http://schemas.android.com/apk/res/android" + android:layout_width="match_parent" + android:layout_height="match_parent" + android:orientation="vertical" > + + <com.github.mikephil.charting.charts.ScatterChart + android:id="@+id/scatterChart1" + android:layout_width="match_parent" + android:layout_height="match_parent" /> + +</LinearLayout> diff --git a/MPChartExample/src/main/res/layout/list_item.xml b/MPChartExample/src/main/res/layout/list_item.xml new file mode 100644 index 00000000..420add11 --- /dev/null +++ b/MPChartExample/src/main/res/layout/list_item.xml @@ -0,0 +1,29 @@ +<?xml version="1.0" encoding="utf-8"?> +<RelativeLayout xmlns:android="http://schemas.android.com/apk/res/android" + android:layout_width="match_parent" + android:layout_height="wrap_content" + android:padding="8dp" > + + <TextView + android:id="@+id/tvName" + android:layout_width="wrap_content" + android:layout_height="wrap_content" + android:layout_alignParentLeft="true" + android:layout_alignParentTop="true" + android:layout_marginLeft="4dp" + android:text="Medium Text" + android:textColor="@android:color/black" + android:textSize="16sp"/> + + <TextView + android:id="@+id/tvDesc" + android:layout_width="wrap_content" + android:layout_height="wrap_content" + android:layout_alignLeft="@+id/tvName" + android:layout_below="@+id/tvName" + android:layout_marginTop="3dp" + android:text="Small Text" + android:textSize="12sp" + android:layout_marginRight="10dp" /> + +</RelativeLayout> diff --git a/MPChartExample/src/main/res/layout/list_item_barchart.xml b/MPChartExample/src/main/res/layout/list_item_barchart.xml new file mode 100644 index 00000000..81dbb27b --- /dev/null +++ b/MPChartExample/src/main/res/layout/list_item_barchart.xml @@ -0,0 +1,12 @@ +<?xml version="1.0" encoding="utf-8"?> +<LinearLayout xmlns:android="http://schemas.android.com/apk/res/android" + android:layout_width="match_parent" + android:layout_height="wrap_content" + android:orientation="vertical" > + + <com.github.mikephil.charting.charts.BarChart + android:id="@+id/chart" + android:layout_width="match_parent" + android:layout_height="200dp" /> + +</LinearLayout> diff --git a/MPChartExample/src/main/res/layout/list_item_linechart.xml b/MPChartExample/src/main/res/layout/list_item_linechart.xml new file mode 100644 index 00000000..984f62ab --- /dev/null +++ b/MPChartExample/src/main/res/layout/list_item_linechart.xml @@ -0,0 +1,12 @@ +<?xml version="1.0" encoding="utf-8"?> +<LinearLayout xmlns:android="http://schemas.android.com/apk/res/android" + android:layout_width="match_parent" + android:layout_height="wrap_content" + android:orientation="vertical" > + + <com.github.mikephil.charting.charts.LineChart + android:id="@+id/chart" + android:layout_width="match_parent" + android:layout_height="200dp" /> + +</LinearLayout> diff --git a/MPChartExample/src/main/res/layout/list_item_piechart.xml b/MPChartExample/src/main/res/layout/list_item_piechart.xml new file mode 100644 index 00000000..9ec823e6 --- /dev/null +++ b/MPChartExample/src/main/res/layout/list_item_piechart.xml @@ -0,0 +1,12 @@ +<?xml version="1.0" encoding="utf-8"?> +<LinearLayout xmlns:android="http://schemas.android.com/apk/res/android" + android:layout_width="match_parent" + android:layout_height="wrap_content" + android:orientation="vertical" > + + <com.github.mikephil.charting.charts.PieChart + android:id="@+id/chart" + android:layout_width="match_parent" + android:layout_height="345dp" /> + +</LinearLayout> diff --git a/MPChartExample/src/main/res/layout/list_item_section.xml b/MPChartExample/src/main/res/layout/list_item_section.xml new file mode 100644 index 00000000..19707f17 --- /dev/null +++ b/MPChartExample/src/main/res/layout/list_item_section.xml @@ -0,0 +1,26 @@ +<?xml version="1.0" encoding="utf-8"?> +<RelativeLayout xmlns:android="http://schemas.android.com/apk/res/android" + android:layout_width="match_parent" + android:layout_height="wrap_content" + android:padding="16dp"> + + <TextView + android:id="@+id/tvName" + android:layout_width="wrap_content" + android:layout_height="wrap_content" + android:layout_alignParentTop="true" + android:layout_centerHorizontal="true" + android:text="Large Text" + android:textSize="21sp" /> + + <TextView + android:id="@+id/tvDesc" + android:layout_width="wrap_content" + android:layout_height="wrap_content" + android:layout_below="@+id/tvName" + android:layout_centerHorizontal="true" + android:text="Small Text" + android:textSize="12sp" + android:visibility="gone" /> + +</RelativeLayout> diff --git a/MPChartExample/src/main/res/layout/radar_markerview.xml b/MPChartExample/src/main/res/layout/radar_markerview.xml new file mode 100644 index 00000000..d94768dd --- /dev/null +++ b/MPChartExample/src/main/res/layout/radar_markerview.xml @@ -0,0 +1,26 @@ +<?xml version="1.0" encoding="utf-8"?> +<RelativeLayout xmlns:android="http://schemas.android.com/apk/res/android" + xmlns:tools="http://schemas.android.com/tools" + android:layout_width="55dp" + android:layout_height="40dp" + android:background="@drawable/radar_marker" + tools:ignore="Overdraw"> + + <TextView + android:id="@+id/tvContent" + android:layout_width="wrap_content" + android:layout_height="wrap_content" + android:layout_alignParentTop="true" + android:layout_centerHorizontal="true" + android:layout_marginTop="3dp" + android:layout_marginLeft="5dp" + android:layout_marginRight="5dp" + android:text="" + android:textSize="10sp" + android:textColor="@android:color/white" + android:ellipsize="end" + android:singleLine="true" + android:textAppearance="?android:attr/textAppearanceSmall" + tools:ignore="SmallSp" /> + +</RelativeLayout> diff --git a/MPChartExample/src/main/res/menu/bar.xml b/MPChartExample/src/main/res/menu/bar.xml new file mode 100644 index 00000000..e05fc597 --- /dev/null +++ b/MPChartExample/src/main/res/menu/bar.xml @@ -0,0 +1,49 @@ +<?xml version="1.0" encoding="utf-8"?> +<menu xmlns:android="http://schemas.android.com/apk/res/android" > + + <item + android:id="@+id/viewGithub" + android:title="@string/viewGithub"> + </item> + <item + android:id="@+id/actionToggleBarBorders" + android:title="@string/actionToggleBarBorders"> + </item> + <item + android:id="@+id/actionToggleValues" + android:title="@string/actionToggleValues"> + </item> + <item + android:id="@+id/actionToggleIcons" + android:title="@string/actionToggleIcons"> + </item> + <item + android:id="@+id/actionToggleHighlight" + android:title="@string/actionToggleHighlight"> + </item> + <item + android:id="@+id/actionTogglePinch" + android:title="@string/actionTogglePinch"> + </item> + <item + android:id="@+id/actionToggleAutoScaleMinMax" + android:title="@string/actionToggleAutoScale"> + </item> + <item + android:id="@+id/animateX" + android:title="@string/animateX"> + </item> + <item + android:id="@+id/animateY" + android:title="@string/animateY"> + </item> + <item + android:id="@+id/animateXY" + android:title="@string/animateXY"> + </item> + <item + android:id="@+id/actionSave" + android:title="@string/actionSave"> + </item> + +</menu> diff --git a/MPChartExample/src/main/res/menu/bubble.xml b/MPChartExample/src/main/res/menu/bubble.xml new file mode 100644 index 00000000..7b9ab5cd --- /dev/null +++ b/MPChartExample/src/main/res/menu/bubble.xml @@ -0,0 +1,45 @@ +<?xml version="1.0" encoding="utf-8"?> +<menu xmlns:android="http://schemas.android.com/apk/res/android" > + + <item + android:id="@+id/viewGithub" + android:title="@string/viewGithub"> + </item> + <item + android:id="@+id/actionToggleValues" + android:title="@string/actionToggleValues"> + </item> + <item + android:id="@+id/actionToggleIcons" + android:title="@string/actionToggleIcons"> + </item> + <item + android:id="@+id/actionToggleHighlight" + android:title="@string/actionToggleHighlight"> + </item> + <item + android:id="@+id/actionTogglePinch" + android:title="@string/actionTogglePinch"> + </item> + <item + android:id="@+id/actionToggleAutoScaleMinMax" + android:title="@string/actionToggleAutoScale"> + </item> + <item + android:id="@+id/animateX" + android:title="@string/animateX"> + </item> + <item + android:id="@+id/animateY" + android:title="@string/animateY"> + </item> + <item + android:id="@+id/animateXY" + android:title="@string/animateXY"> + </item> + <item + android:id="@+id/actionSave" + android:title="@string/actionSave"> + </item> + +</menu> diff --git a/MPChartExample/src/main/res/menu/candle.xml b/MPChartExample/src/main/res/menu/candle.xml new file mode 100644 index 00000000..42a1a7e0 --- /dev/null +++ b/MPChartExample/src/main/res/menu/candle.xml @@ -0,0 +1,49 @@ +<?xml version="1.0" encoding="utf-8"?> +<menu xmlns:android="http://schemas.android.com/apk/res/android" > + + <item + android:id="@+id/viewGithub" + android:title="@string/viewGithub"> + </item> + <item + android:id="@+id/actionToggleValues" + android:title="@string/actionToggleValues"> + </item> + <item + android:id="@+id/actionToggleIcons" + android:title="@string/actionToggleIcons"> + </item> + <item + android:id="@+id/actionToggleHighlight" + android:title="@string/actionToggleHighlight"> + </item> + <item + android:id="@+id/actionToggleMakeShadowSameColorAsCandle" + android:title="@string/actionToggleCandleShadow"> + </item> + <item + android:id="@+id/actionTogglePinch" + android:title="@string/actionTogglePinch"> + </item> + <item + android:id="@+id/actionToggleAutoScaleMinMax" + android:title="@string/actionToggleAutoScale"> + </item> + <item + android:id="@+id/animateX" + android:title="@string/animateX"> + </item> + <item + android:id="@+id/animateY" + android:title="@string/animateY"> + </item> + <item + android:id="@+id/animateXY" + android:title="@string/animateXY"> + </item> + <item + android:id="@+id/actionSave" + android:title="@string/actionSave"> + </item> + +</menu> diff --git a/MPChartExample/src/main/res/menu/combined.xml b/MPChartExample/src/main/res/menu/combined.xml new file mode 100644 index 00000000..c7def250 --- /dev/null +++ b/MPChartExample/src/main/res/menu/combined.xml @@ -0,0 +1,21 @@ +<?xml version="1.0" encoding="utf-8"?> +<menu xmlns:android="http://schemas.android.com/apk/res/android" > + + <item + android:id="@+id/viewGithub" + android:title="@string/viewGithub"> + </item> + <item + android:id="@+id/actionToggleLineValues" + android:title="@string/actionToggleLineValues"> + </item> + <item + android:id="@+id/actionToggleBarValues" + android:title="@string/actionToggleBarValues"> + </item> + <item + android:id="@+id/actionRemoveDataSet" + android:title="@string/actionRemoveDataSet"> + </item> + +</menu> diff --git a/MPChartExample/src/main/res/menu/draw.xml b/MPChartExample/src/main/res/menu/draw.xml new file mode 100644 index 00000000..36383db5 --- /dev/null +++ b/MPChartExample/src/main/res/menu/draw.xml @@ -0,0 +1,32 @@ +<?xml version="1.0" encoding="utf-8"?> +<menu xmlns:android="http://schemas.android.com/apk/res/android" > + + <item + android:id="@+id/actionToggleValues" + android:title="@string/actionToggleValues"> + </item> + <item + android:id="@+id/actionToggleFilled" + android:title="@string/actionToggleFilled"> + </item> + <item + android:id="@+id/actionToggleCircles" + android:title="@string/actionToggleCircles"> + </item> + <item + android:id="@+id/actionToggleHighlight" + android:title="@string/actionToggleHighlight"> + </item> + <item + android:id="@+id/actionTogglePinch" + android:title="@string/actionTogglePinch"> + </item> + <item + android:id="@+id/actionToggleAutoScaleMinMax" + android:title="@string/actionToggleAutoScale"> + </item> + <item + android:id="@+id/actionSave" + android:title="@string/actionSave"> + </item> +</menu> diff --git a/MPChartExample/src/main/res/menu/dynamical.xml b/MPChartExample/src/main/res/menu/dynamical.xml new file mode 100644 index 00000000..68d4fab0 --- /dev/null +++ b/MPChartExample/src/main/res/menu/dynamical.xml @@ -0,0 +1,33 @@ +<?xml version="1.0" encoding="utf-8"?> +<menu xmlns:android="http://schemas.android.com/apk/res/android" > + + <item + android:id="@+id/viewGithub" + android:title="@string/viewGithub"> + </item> + <item + android:id="@+id/actionAddEntry" + android:title="@string/actionAddEntry"> + </item> + <item + android:id="@+id/actionRemoveEntry" + android:title="@string/actionRemoveEntry"> + </item> + <item + android:id="@+id/actionAddDataSet" + android:title="@string/actionAddDataSet"> + </item> + <item + android:id="@+id/actionRemoveDataSet" + android:title="@string/actionRemoveDataSet"> + </item> + <item + android:id="@+id/actionClear" + android:title="@string/actionClearChart"> + </item> + <item + android:id="@+id/actionSave" + android:title="@string/actionSave"> + </item> + +</menu> diff --git a/MPChartExample/src/main/res/menu/line.xml b/MPChartExample/src/main/res/menu/line.xml new file mode 100644 index 00000000..a812b91b --- /dev/null +++ b/MPChartExample/src/main/res/menu/line.xml @@ -0,0 +1,65 @@ +<?xml version="1.0" encoding="utf-8"?> +<menu xmlns:android="http://schemas.android.com/apk/res/android" > + + <item + android:id="@+id/viewGithub" + android:title="@string/viewGithub"> + </item> + <item + android:id="@+id/actionToggleValues" + android:title="@string/actionToggleValues"> + </item> + <item + android:id="@+id/actionToggleIcons" + android:title="@string/actionToggleIcons"> + </item> + <item + android:id="@+id/actionToggleFilled" + android:title="@string/actionToggleFilled"> + </item> + <item + android:id="@+id/actionToggleCircles" + android:title="@string/actionToggleCircles"> + </item> + <item + android:id="@+id/actionToggleCubic" + android:title="@string/actionToggleCubic"> + </item> + <item + android:id="@+id/actionToggleStepped" + android:title="@string/actionToggleStepped"> + </item> + <item + android:id="@+id/actionToggleHorizontalCubic" + android:title="@string/actionToggleHorizontalCubic"> + </item> + <item + android:id="@+id/actionTogglePinch" + android:title="@string/actionTogglePinch"> + </item> + <item + android:id="@+id/actionToggleAutoScaleMinMax" + android:title="@string/actionToggleAutoScale"> + </item> + <item + android:id="@+id/actionToggleHighlight" + android:title="@string/actionToggleHighlight"> + </item> + <item + android:id="@+id/animateX" + android:title="@string/animateX"> + </item> + <item + android:id="@+id/animateY" + android:title="@string/animateY"> + </item> + <item + android:id="@+id/animateXY" + android:title="@string/animateXY"> + </item> + <item + android:id="@+id/actionSave" + android:title="@string/actionSave"> + </item> + +</menu> diff --git a/MPChartExample/src/main/res/menu/main.xml b/MPChartExample/src/main/res/menu/main.xml new file mode 100644 index 00000000..9ac13dbb --- /dev/null +++ b/MPChartExample/src/main/res/menu/main.xml @@ -0,0 +1,17 @@ +<?xml version="1.0" encoding="utf-8"?> +<menu xmlns:android="http://schemas.android.com/apk/res/android" > + + <item + android:id="@+id/viewGithub" + android:title="@string/viewGithub"> + </item> + <item + android:id="@+id/report" + android:title="@string/reportProblem"> + </item> + <item + android:id="@+id/website" + android:title="@string/viewWebsite"> + </item> + +</menu> diff --git a/MPChartExample/src/main/res/menu/only_github.xml b/MPChartExample/src/main/res/menu/only_github.xml new file mode 100644 index 00000000..c0a9b669 --- /dev/null +++ b/MPChartExample/src/main/res/menu/only_github.xml @@ -0,0 +1,7 @@ +<?xml version="1.0" encoding="utf-8"?> +<menu xmlns:android="http://schemas.android.com/apk/res/android"> + <item + android:id="@+id/viewGithub" + android:title="@string/viewGithub"> + </item> +</menu> diff --git a/MPChartExample/src/main/res/menu/pie.xml b/MPChartExample/src/main/res/menu/pie.xml new file mode 100644 index 00000000..09a05a9c --- /dev/null +++ b/MPChartExample/src/main/res/menu/pie.xml @@ -0,0 +1,61 @@ +<?xml version="1.0" encoding="utf-8"?> +<menu xmlns:android="http://schemas.android.com/apk/res/android" > + + <item + android:id="@+id/viewGithub" + android:title="@string/viewGithub"> + </item> + <item + android:id="@+id/actionToggleValues" + android:title="@string/actionToggleYValues"> + </item> + <item + android:id="@+id/actionToggleXValues" + android:title="@string/actionToggleXValues"> + </item> + <item + android:id="@+id/actionToggleIcons" + android:title="@string/actionToggleIcons"> + </item> + <item + android:id="@+id/actionTogglePercent" + android:title="@string/actionTogglePercent"> + </item> + <item + android:id="@+id/actionToggleMinAngles" + android:title="@string/actionToggleMinAngles"> + </item> + <item + android:id="@+id/actionToggleHole" + android:title="@string/actionToggleHole"> + </item> + <item + android:id="@+id/actionToggleCurvedSlices" + android:title="@string/actionToggleCurvedSlices"> + </item> + <item + android:id="@+id/actionDrawCenter" + android:title="@string/actionDrawCenterText"> + </item> + <item + android:id="@+id/actionToggleSpin" + android:title="@string/actionToggleSpin"> + </item> + <item + android:id="@+id/animateX" + android:title="@string/animateX"> + </item> + <item + android:id="@+id/animateY" + android:title="@string/animateY"> + </item> + <item + android:id="@+id/animateXY" + android:title="@string/animateXY"> + </item> + <item + android:id="@+id/actionSave" + android:title="@string/actionSave"> + </item> + +</menu> diff --git a/MPChartExample/src/main/res/menu/radar.xml b/MPChartExample/src/main/res/menu/radar.xml new file mode 100644 index 00000000..2a5c19cf --- /dev/null +++ b/MPChartExample/src/main/res/menu/radar.xml @@ -0,0 +1,62 @@ +<?xml version="1.0" encoding="utf-8"?> +<menu xmlns:android="http://schemas.android.com/apk/res/android" > + + <item + android:id="@+id/viewGithub" + android:title="@string/viewGithub"> + </item> + <item + android:id="@+id/actionToggleValues" + android:title="@string/actionToggleValues"> + </item> + <item + android:id="@+id/actionToggleIcons" + android:title="@string/actionToggleIcons"> + </item> + <item + android:id="@+id/actionToggleFilled" + android:title="@string/actionToggleFilled"> + </item> + <item + android:id="@+id/actionToggleHighlight" + android:title="@string/actionToggleHighlight"> + </item> + <item + android:id="@+id/actionToggleHighlightCircle" + android:title="@string/actionToggleHighlightCircle"> + </item> + <item + android:id="@+id/actionToggleRotate" + android:title="@string/actionToggleRotation"> + </item> + <item + android:id="@+id/actionToggleYLabels" + android:title="@string/actionToggleYValues"> + </item> + <item + android:id="@+id/actionToggleXLabels" + android:title="@string/actionToggleXValues"> + </item> + <item + android:id="@+id/actionToggleSpin" + android:title="@string/actionToggleSpin"> + </item> + <item + android:id="@+id/animateX" + android:title="@string/animateX"> + </item> + <item + android:id="@+id/animateY" + android:title="@string/animateY"> + </item> + <item + android:id="@+id/animateXY" + android:title="@string/animateXY"> + </item> + <item + android:id="@+id/actionSave" + android:title="@string/actionSave"> + </item> + + +</menu> diff --git a/MPChartExample/src/main/res/menu/realtime.xml b/MPChartExample/src/main/res/menu/realtime.xml new file mode 100644 index 00000000..48cc7ccd --- /dev/null +++ b/MPChartExample/src/main/res/menu/realtime.xml @@ -0,0 +1,25 @@ +<?xml version="1.0" encoding="utf-8"?> +<menu xmlns:android="http://schemas.android.com/apk/res/android" > + + <item + android:id="@+id/viewGithub" + android:title="@string/viewGithub"> + </item> + <item + android:id="@+id/actionAdd" + android:title="@string/actionAddEntry"> + </item> + <item + android:id="@+id/actionClear" + android:title="@string/actionClearChart"> + </item> + <item + android:id="@+id/actionFeedMultiple" + android:title="@string/actionFeedMultiple"> + </item> + <item + android:id="@+id/actionSave" + android:title="@string/actionSave"> + </item> + +</menu> diff --git a/MPChartExample/src/main/res/menu/scatter.xml b/MPChartExample/src/main/res/menu/scatter.xml new file mode 100644 index 00000000..eb8e0efa --- /dev/null +++ b/MPChartExample/src/main/res/menu/scatter.xml @@ -0,0 +1,45 @@ +<?xml version="1.0" encoding="utf-8"?> +<menu xmlns:android="http://schemas.android.com/apk/res/android" > + + <item + android:id="@+id/viewGithub" + android:title="@string/viewGithub"> + </item> + <item + android:id="@+id/actionToggleValues" + android:title="@string/actionToggleValues"> + </item> + <item + android:id="@+id/actionToggleIcons" + android:title="@string/actionToggleIcons"> + </item> + <item + android:id="@+id/actionToggleHighlight" + android:title="@string/actionToggleHighlight"> + </item> + <item + android:id="@+id/animateX" + android:title="@string/animateX"> + </item> + <item + android:id="@+id/animateY" + android:title="@string/animateY"> + </item> + <item + android:id="@+id/animateXY" + android:title="@string/animateXY"> + </item> + <item + android:id="@+id/actionTogglePinch" + android:title="@string/actionTogglePinch"> + </item> + <item + android:id="@+id/actionToggleAutoScaleMinMax" + android:title="@string/actionToggleAutoScale"> + </item> + <item + android:id="@+id/actionSave" + android:title="@string/actionSave"> + </item> + +</menu> diff --git a/MPChartExample/src/main/res/values/strings.xml b/MPChartExample/src/main/res/values/strings.xml new file mode 100644 index 00000000..91a25bb8 --- /dev/null +++ b/MPChartExample/src/main/res/values/strings.xml @@ -0,0 +1,55 @@ +<?xml version="1.0" encoding="utf-8"?> +<resources> + + <string name="app_name">MPAndroidChart Example</string> + + <string name="viewGithub">View on GitHub</string> + <string name="reportProblem">Problem Report</string> + <string name="viewWebsite">Developer Website</string> + <string name="actionSave">Save to Gallery</string> + + <string name="animateX">Animate X</string> + <string name="animateY">Animate Y</string> + <string name="animateXY">Animate XY</string> + + <string name="actionToggleValues">Toggle Values</string> + <string name="actionToggleYValues">Toggle Y-Values</string> + <string name="actionToggleXValues">Toggle X-Values</string> + + <string name="actionToggleIcons">Toggle Icons</string> + <string name="actionToggleHighlight">Toggle Highlight</string> + <string name="actionTogglePinch">Toggle PinchZoom</string> + <string name="actionToggleAutoScale">Toggle Auto Scale</string> + + <string name="actionToggleLineValues">Toggle Line Values</string> + <string name="actionToggleBarValues">Toggle Bar Values</string> + <string name="actionToggleBarBorders">Toggle Bar Borders</string> + <string name="actionToggleFilled">Toggle Filled</string> + <string name="actionToggleCircles">Toggle Circles</string> + <string name="actionToggleCandleShadow">Toggle Shadow Color</string> + + <string name="actionToggleCubic">Toggle Cubic</string> + <string name="actionToggleStepped">Toggle Stepped</string> + <string name="actionToggleHorizontalCubic">Toggle Horizontal Cubic</string> + + <string name="actionAddEntry">Add Entry</string> + <string name="actionFeedMultiple">Add Multiple</string> + <string name="actionRemoveEntry">Remove Entry</string> + <string name="actionAddDataSet">Add Data Set</string> + <string name="actionRemoveDataSet">Remove Data Set</string> + <string name="actionClearChart">Clear chart</string> + + <string name="actionTogglePercent">Toggle Percent</string> + <string name="actionToggleMinAngles">Toggle Minimum Angles</string> + <string name="actionToggleHole">Toggle Hole</string> + <string name="actionToggleCurvedSlices">Toggle Curved Slices</string> + <string name="actionDrawCenterText">Draw Center Text</string> + <string name="actionToggleHighlightCircle">Toggle Highlight Circle</string> + <string name="actionToggleRotation">Toggle Rotation</string> + <string name="actionToggleSpin">Spin Animation</string> + + <string name="dash">-</string> + <string name="scrollViewStart">START OF SCROLLVIEW</string> + <string name="scrollViewEnd">END OF SCROLLVIEW</string> + +</resources> diff --git a/MPChartExample/src/main/res/values/styles.xml b/MPChartExample/src/main/res/values/styles.xml new file mode 100644 index 00000000..9d5b53bd --- /dev/null +++ b/MPChartExample/src/main/res/values/styles.xml @@ -0,0 +1,8 @@ +<resources> + + <!-- Application theme. --> + <style name="AppTheme" parent="Theme.AppCompat.Light.DarkActionBar"> + <!-- All customizations that are NOT specific to a particular API-level can go here. --> + </style> + +</resources> diff --git a/MPChartLib/.gitignore b/MPChartLib/.gitignore new file mode 100644 index 00000000..796b96d1 --- /dev/null +++ b/MPChartLib/.gitignore @@ -0,0 +1 @@ +/build diff --git a/MPChartLib/build.gradle b/MPChartLib/build.gradle new file mode 100644 index 00000000..0fb6dc70 --- /dev/null +++ b/MPChartLib/build.gradle @@ -0,0 +1,51 @@ +apply plugin: 'com.android.library' +apply plugin: 'com.github.dcendents.android-maven' + +group='com.github.philjay' + +android { + compileSdkVersion 28 + buildToolsVersion '28.0.3' + defaultConfig { + minSdkVersion 14 + targetSdkVersion 28 + versionCode 3 + versionName '3.1.0' + } + buildTypes { + release { + minifyEnabled false + proguardFiles getDefaultProguardFile('proguard-android.txt'), 'proguard-rules.pro' + } + } + testOptions { + unitTests.returnDefaultValues = true // this prevents "not mocked" error + } +} + +dependencies { + implementation 'androidx.annotation:annotation:1.0.0' + testImplementation 'junit:junit:4.12' +} + +task sourcesJar(type: Jar) { + from android.sourceSets.main.java.srcDirs + classifier = 'sources' +} + +task javadoc(type: Javadoc) { + options.charSet = 'UTF-8' + failOnError false + source = android.sourceSets.main.java.sourceFiles + classpath += project.files(android.getBootClasspath().join(File.pathSeparator)) +} + +task javadocJar(type: Jar, dependsOn: javadoc) { + classifier = 'javadoc' + from javadoc.destinationDir +} + +artifacts { + archives sourcesJar + archives javadocJar +} diff --git a/MPChartLib/ic_launcher-web.png b/MPChartLib/ic_launcher-web.png Binary files differnew file mode 100644 index 00000000..ef559220 --- /dev/null +++ b/MPChartLib/ic_launcher-web.png diff --git a/MPChartLib/pom.xml b/MPChartLib/pom.xml new file mode 100644 index 00000000..24675aa2 --- /dev/null +++ b/MPChartLib/pom.xml @@ -0,0 +1,89 @@ +<?xml version="1.0" encoding="UTF-8"?> +<!-- + Copyright (c) 2014 Philipp Jahoda <philjay.librarysup@gmail.com> + + Licensed under the Apache License, Version 2.0 (the "License"); + you may not use this file except in compliance with the License. + You may obtain a copy of the License at + + http://www.apache.org/licenses/LICENSE-2.0 + + Unless required by applicable law or agreed to in writing, software + distributed under the License is distributed on an "AS IS" BASIS, + WITHOUT WARRANTIES OR CONDITIONS OF ANY KIND, either express or implied. + See the License for the specific language governing permissions and + limitations under the License. +--> + +<project xmlns="http://maven.apache.org/POM/4.0.0" xmlns:xsi="http://www.w3.org/2001/XMLSchema-instance" xsi:schemaLocation="http://maven.apache.org/POM/4.0.0 http://maven.apache.org/maven-v4_0_0.xsd"> + <modelVersion>4.0.0</modelVersion> + <version>1.4.2-SNAPSHOT</version> + <groupId>com.github.mikephil</groupId> + <artifactId>MPAndroidChart</artifactId> + <name>MPAndroidChart</name> + <description>A simple Android chart view/graph view library, supporting line- bar- and piecharts as well as scaling, dragging and animations</description> + <url>https://github.com/PhilJay/MPAndroidChart</url> + <packaging>apklib</packaging> + <!--<packaging>aar</packaging>--> + + <properties> + <project.build.sourceEncoding>UTF-8</project.build.sourceEncoding> + </properties> + + <build> + <sourceDirectory>src</sourceDirectory> + <plugins> + <plugin> + <groupId>com.jayway.maven.plugins.android.generation2</groupId> + <artifactId>android-maven-plugin</artifactId> + <version>3.9.0-rc.2</version> + <extensions>true</extensions> + <configuration> + <!--<sdk>--> + <!--<path>${env.ANDROID_HOME}</path>--> + <!--<platform>16</platform>--> + <!--</sdk>--> + <undeployBeforeDeploy>true</undeployBeforeDeploy> + </configuration> + </plugin> + </plugins> + </build> + + <dependencies> + <dependency> + <groupId>com.google.android</groupId> + <artifactId>android</artifactId> + <scope>provided</scope> + <version>4.1.1.4</version> + </dependency> + </dependencies> + + + <issueManagement> + <url>https://github.com/PhilJay/MPAndroidChart/issues</url> + <system>GitHub Issues</system> + </issueManagement> + + <licenses> + <license> + <name>Apache License Version 2.0</name> + <url>http://www.apache.org/licenses/LICENSE-2.0.html</url> + <distribution>repo</distribution> + </license> + </licenses> + + <scm> + <url>https://github.com/PhilJay/MPAndroidChart</url> + <connection>scm:git:git://github.com/PhilJay/MPAndroidChart.git</connection> + <developerConnection>scm:git:git@github.com:PhilJay/MPAndroidChart.git</developerConnection> + </scm> + + <developers> + <developer> + <name>Philipp Jahoda</name> + <email>philjay.librarysup@gmail.com</email> + <url>http://stackoverflow.com/users/1590502/philipp-jahoda</url> + <id>PhilJay</id> + </developer> + </developers> +</project> diff --git a/MPChartLib/src/main/AndroidManifest.xml b/MPChartLib/src/main/AndroidManifest.xml new file mode 100644 index 00000000..d75f87c7 --- /dev/null +++ b/MPChartLib/src/main/AndroidManifest.xml @@ -0,0 +1,13 @@ +<?xml version="1.0" encoding="utf-8"?> +<manifest package="com.github.mikephil.charting"> + + <!-- <uses-permission android:name="android.permission.WRITE_EXTERNAL_STORAGE" /> + + <application + android:allowBackup="true" + android:icon="@drawable/ic_launcher" + android:label="@string/app_name" + android:theme="@style/AppTheme" > + </application> --> + +</manifest>
\ No newline at end of file diff --git a/MPChartLib/src/main/java/com/github/mikephil/charting/animation/ChartAnimator.java b/MPChartLib/src/main/java/com/github/mikephil/charting/animation/ChartAnimator.java new file mode 100644 index 00000000..e5b82db0 --- /dev/null +++ b/MPChartLib/src/main/java/com/github/mikephil/charting/animation/ChartAnimator.java @@ -0,0 +1,207 @@ +package com.github.mikephil.charting.animation; + +import android.animation.ObjectAnimator; +import android.animation.ValueAnimator.AnimatorUpdateListener; +import androidx.annotation.RequiresApi; + +import com.github.mikephil.charting.animation.Easing.EasingFunction; + +/** + * Object responsible for all animations in the Chart. Animations require API level 11. + * + * @author Philipp Jahoda + * @author Mick Ashton + */ +public class ChartAnimator { + + /** object that is updated upon animation update */ + private AnimatorUpdateListener mListener; + + /** The phase of drawn values on the y-axis. 0 - 1 */ + @SuppressWarnings("WeakerAccess") + protected float mPhaseY = 1f; + + /** The phase of drawn values on the x-axis. 0 - 1 */ + @SuppressWarnings("WeakerAccess") + protected float mPhaseX = 1f; + + public ChartAnimator() { } + + @RequiresApi(11) + public ChartAnimator(AnimatorUpdateListener listener) { + mListener = listener; + } + + @RequiresApi(11) + private ObjectAnimator xAnimator(int duration, EasingFunction easing) { + + ObjectAnimator animatorX = ObjectAnimator.ofFloat(this, "phaseX", 0f, 1f); + animatorX.setInterpolator(easing); + animatorX.setDuration(duration); + + return animatorX; + } + + @RequiresApi(11) + private ObjectAnimator yAnimator(int duration, EasingFunction easing) { + + ObjectAnimator animatorY = ObjectAnimator.ofFloat(this, "phaseY", 0f, 1f); + animatorY.setInterpolator(easing); + animatorY.setDuration(duration); + + return animatorY; + } + + /** + * Animates values along the X axis, in a linear fashion. + * + * @param durationMillis animation duration + */ + @RequiresApi(11) + public void animateX(int durationMillis) { + animateX(durationMillis, Easing.Linear); + } + + /** + * Animates values along the X axis. + * + * @param durationMillis animation duration + * @param easing EasingFunction + */ + @RequiresApi(11) + public void animateX(int durationMillis, EasingFunction easing) { + + ObjectAnimator animatorX = xAnimator(durationMillis, easing); + animatorX.addUpdateListener(mListener); + animatorX.start(); + } + + /** + * Animates values along both the X and Y axes, in a linear fashion. + * + * @param durationMillisX animation duration along the X axis + * @param durationMillisY animation duration along the Y axis + */ + @RequiresApi(11) + public void animateXY(int durationMillisX, int durationMillisY) { + animateXY(durationMillisX, durationMillisY, Easing.Linear, Easing.Linear); + } + + /** + * Animates values along both the X and Y axes. + * + * @param durationMillisX animation duration along the X axis + * @param durationMillisY animation duration along the Y axis + * @param easing EasingFunction for both axes + */ + @RequiresApi(11) + public void animateXY(int durationMillisX, int durationMillisY, EasingFunction easing) { + + ObjectAnimator xAnimator = xAnimator(durationMillisX, easing); + ObjectAnimator yAnimator = yAnimator(durationMillisY, easing); + + if (durationMillisX > durationMillisY) { + xAnimator.addUpdateListener(mListener); + } else { + yAnimator.addUpdateListener(mListener); + } + + xAnimator.start(); + yAnimator.start(); + } + + /** + * Animates values along both the X and Y axes. + * + * @param durationMillisX animation duration along the X axis + * @param durationMillisY animation duration along the Y axis + * @param easingX EasingFunction for the X axis + * @param easingY EasingFunction for the Y axis + */ + @RequiresApi(11) + public void animateXY(int durationMillisX, int durationMillisY, EasingFunction easingX, + EasingFunction easingY) { + + ObjectAnimator xAnimator = xAnimator(durationMillisX, easingX); + ObjectAnimator yAnimator = yAnimator(durationMillisY, easingY); + + if (durationMillisX > durationMillisY) { + xAnimator.addUpdateListener(mListener); + } else { + yAnimator.addUpdateListener(mListener); + } + + xAnimator.start(); + yAnimator.start(); + } + + /** + * Animates values along the Y axis, in a linear fashion. + * + * @param durationMillis animation duration + */ + @RequiresApi(11) + public void animateY(int durationMillis) { + animateY(durationMillis, Easing.Linear); + } + + /** + * Animates values along the Y axis. + * + * @param durationMillis animation duration + * @param easing EasingFunction + */ + @RequiresApi(11) + public void animateY(int durationMillis, EasingFunction easing) { + + ObjectAnimator animatorY = yAnimator(durationMillis, easing); + animatorY.addUpdateListener(mListener); + animatorY.start(); + } + + /** + * Gets the Y axis phase of the animation. + * + * @return float value of {@link #mPhaseY} + */ + public float getPhaseY() { + return mPhaseY; + } + + /** + * Sets the Y axis phase of the animation. + * + * @param phase float value between 0 - 1 + */ + public void setPhaseY(float phase) { + if (phase > 1f) { + phase = 1f; + } else if (phase < 0f) { + phase = 0f; + } + mPhaseY = phase; + } + + /** + * Gets the X axis phase of the animation. + * + * @return float value of {@link #mPhaseX} + */ + public float getPhaseX() { + return mPhaseX; + } + + /** + * Sets the X axis phase of the animation. + * + * @param phase float value between 0 - 1 + */ + public void setPhaseX(float phase) { + if (phase > 1f) { + phase = 1f; + } else if (phase < 0f) { + phase = 0f; + } + mPhaseX = phase; + } +} diff --git a/MPChartLib/src/main/java/com/github/mikephil/charting/animation/Easing.java b/MPChartLib/src/main/java/com/github/mikephil/charting/animation/Easing.java new file mode 100644 index 00000000..acb7dcc9 --- /dev/null +++ b/MPChartLib/src/main/java/com/github/mikephil/charting/animation/Easing.java @@ -0,0 +1,309 @@ +package com.github.mikephil.charting.animation; + +import android.animation.TimeInterpolator; +import androidx.annotation.RequiresApi; + +/** + * Easing options. + * + * @author Daniel Cohen Gindi + * @author Mick Ashton + */ +@SuppressWarnings("WeakerAccess") +@RequiresApi(11) +public class Easing { + + public interface EasingFunction extends TimeInterpolator { + @Override + float getInterpolation(float input); + } + + private static final float DOUBLE_PI = 2f * (float) Math.PI; + + @SuppressWarnings("unused") + public static final EasingFunction Linear = new EasingFunction() { + public float getInterpolation(float input) { + return input; + } + }; + + @SuppressWarnings("unused") + public static final EasingFunction EaseInQuad = new EasingFunction() { + public float getInterpolation(float input) { + return input * input; + } + }; + + @SuppressWarnings("unused") + public static final EasingFunction EaseOutQuad = new EasingFunction() { + public float getInterpolation(float input) { + return -input * (input - 2f); + } + }; + + @SuppressWarnings("unused") + public static final EasingFunction EaseInOutQuad = new EasingFunction() { + public float getInterpolation(float input) { + input *= 2f; + + if (input < 1f) { + return 0.5f * input * input; + } + + return -0.5f * ((--input) * (input - 2f) - 1f); + } + }; + + @SuppressWarnings("unused") + public static final EasingFunction EaseInCubic = new EasingFunction() { + public float getInterpolation(float input) { + return (float) Math.pow(input, 3); + } + }; + + @SuppressWarnings("unused") + public static final EasingFunction EaseOutCubic = new EasingFunction() { + public float getInterpolation(float input) { + input--; + return (float) Math.pow(input, 3) + 1f; + } + }; + + @SuppressWarnings("unused") + public static final EasingFunction EaseInOutCubic = new EasingFunction() { + public float getInterpolation(float input) { + input *= 2f; + if (input < 1f) { + return 0.5f * (float) Math.pow(input, 3); + } + input -= 2f; + return 0.5f * ((float) Math.pow(input, 3) + 2f); + } + }; + + @SuppressWarnings("unused") + public static final EasingFunction EaseInQuart = new EasingFunction() { + + public float getInterpolation(float input) { + return (float) Math.pow(input, 4); + } + }; + + @SuppressWarnings("unused") + public static final EasingFunction EaseOutQuart = new EasingFunction() { + public float getInterpolation(float input) { + input--; + return -((float) Math.pow(input, 4) - 1f); + } + }; + + @SuppressWarnings("unused") + public static final EasingFunction EaseInOutQuart = new EasingFunction() { + public float getInterpolation(float input) { + input *= 2f; + if (input < 1f) { + return 0.5f * (float) Math.pow(input, 4); + } + input -= 2f; + return -0.5f * ((float) Math.pow(input, 4) - 2f); + } + }; + + @SuppressWarnings("unused") + public static final EasingFunction EaseInSine = new EasingFunction() { + public float getInterpolation(float input) { + return -(float) Math.cos(input * (Math.PI / 2f)) + 1f; + } + }; + + @SuppressWarnings("unused") + public static final EasingFunction EaseOutSine = new EasingFunction() { + public float getInterpolation(float input) { + return (float) Math.sin(input * (Math.PI / 2f)); + } + }; + + @SuppressWarnings("unused") + public static final EasingFunction EaseInOutSine = new EasingFunction() { + public float getInterpolation(float input) { + return -0.5f * ((float) Math.cos(Math.PI * input) - 1f); + } + }; + + @SuppressWarnings("unused") + public static final EasingFunction EaseInExpo = new EasingFunction() { + public float getInterpolation(float input) { + return (input == 0) ? 0f : (float) Math.pow(2f, 10f * (input - 1f)); + } + }; + + @SuppressWarnings("unused") + public static final EasingFunction EaseOutExpo = new EasingFunction() { + public float getInterpolation(float input) { + return (input == 1f) ? 1f : (-(float) Math.pow(2f, -10f * (input + 1f))); + } + }; + + @SuppressWarnings("unused") + public static final EasingFunction EaseInOutExpo = new EasingFunction() { + public float getInterpolation(float input) { + if (input == 0) { + return 0f; + } else if (input == 1f) { + return 1f; + } + + input *= 2f; + if (input < 1f) { + return 0.5f * (float) Math.pow(2f, 10f * (input - 1f)); + } + return 0.5f * (-(float) Math.pow(2f, -10f * --input) + 2f); + } + }; + + @SuppressWarnings("unused") + public static final EasingFunction EaseInCirc = new EasingFunction() { + public float getInterpolation(float input) { + return -((float) Math.sqrt(1f - input * input) - 1f); + } + }; + + @SuppressWarnings("unused") + public static final EasingFunction EaseOutCirc = new EasingFunction() { + public float getInterpolation(float input) { + input--; + return (float) Math.sqrt(1f - input * input); + } + }; + + @SuppressWarnings("unused") + public static final EasingFunction EaseInOutCirc = new EasingFunction() { + public float getInterpolation(float input) { + input *= 2f; + if (input < 1f) { + return -0.5f * ((float) Math.sqrt(1f - input * input) - 1f); + } + return 0.5f * ((float) Math.sqrt(1f - (input -= 2f) * input) + 1f); + } + }; + + @SuppressWarnings("unused") + public static final EasingFunction EaseInElastic = new EasingFunction() { + public float getInterpolation(float input) { + if (input == 0) { + return 0f; + } else if (input == 1) { + return 1f; + } + + float p = 0.3f; + float s = p / DOUBLE_PI * (float) Math.asin(1f); + return -((float) Math.pow(2f, 10f * (input -= 1f)) + *(float) Math.sin((input - s) * DOUBLE_PI / p)); + } + }; + + @SuppressWarnings("unused") + public static final EasingFunction EaseOutElastic = new EasingFunction() { + public float getInterpolation(float input) { + if (input == 0) { + return 0f; + } else if (input == 1) { + return 1f; + } + + float p = 0.3f; + float s = p / DOUBLE_PI * (float) Math.asin(1f); + return 1f + + (float) Math.pow(2f, -10f * input) + * (float) Math.sin((input - s) * DOUBLE_PI / p); + } + }; + + @SuppressWarnings("unused") + public static final EasingFunction EaseInOutElastic = new EasingFunction() { + public float getInterpolation(float input) { + if (input == 0) { + return 0f; + } + + input *= 2f; + if (input == 2) { + return 1f; + } + + float p = 1f / 0.45f; + float s = 0.45f / DOUBLE_PI * (float) Math.asin(1f); + if (input < 1f) { + return -0.5f + * ((float) Math.pow(2f, 10f * (input -= 1f)) + * (float) Math.sin((input * 1f - s) * DOUBLE_PI * p)); + } + return 1f + 0.5f + * (float) Math.pow(2f, -10f * (input -= 1f)) + * (float) Math.sin((input * 1f - s) * DOUBLE_PI * p); + } + }; + + @SuppressWarnings("unused") + public static final EasingFunction EaseInBack = new EasingFunction() { + public float getInterpolation(float input) { + final float s = 1.70158f; + return input * input * ((s + 1f) * input - s); + } + }; + + @SuppressWarnings("unused") + public static final EasingFunction EaseOutBack = new EasingFunction() { + public float getInterpolation(float input) { + final float s = 1.70158f; + input--; + return (input * input * ((s + 1f) * input + s) + 1f); + } + }; + + @SuppressWarnings("unused") + public static final EasingFunction EaseInOutBack = new EasingFunction() { + public float getInterpolation(float input) { + float s = 1.70158f; + input *= 2f; + if (input < 1f) { + return 0.5f * (input * input * (((s *= (1.525f)) + 1f) * input - s)); + } + return 0.5f * ((input -= 2f) * input * (((s *= (1.525f)) + 1f) * input + s) + 2f); + } + }; + + @SuppressWarnings("unused") + public static final EasingFunction EaseInBounce = new EasingFunction() { + public float getInterpolation(float input) { + return 1f - EaseOutBounce.getInterpolation(1f - input); + } + }; + + @SuppressWarnings("unused") + public static final EasingFunction EaseOutBounce = new EasingFunction() { + public float getInterpolation(float input) { + float s = 7.5625f; + if (input < (1f / 2.75f)) { + return s * input * input; + } else if (input < (2f / 2.75f)) { + return s * (input -= (1.5f / 2.75f)) * input + 0.75f; + } else if (input < (2.5f / 2.75f)) { + return s * (input -= (2.25f / 2.75f)) * input + 0.9375f; + } + return s * (input -= (2.625f / 2.75f)) * input + 0.984375f; + } + }; + + @SuppressWarnings("unused") + public static final EasingFunction EaseInOutBounce = new EasingFunction() { + public float getInterpolation(float input) { + if (input < 0.5f) { + return EaseInBounce.getInterpolation(input * 2f) * 0.5f; + } + return EaseOutBounce.getInterpolation(input * 2f - 1f) * 0.5f + 0.5f; + } + }; + +} diff --git a/MPChartLib/src/main/java/com/github/mikephil/charting/buffer/AbstractBuffer.java b/MPChartLib/src/main/java/com/github/mikephil/charting/buffer/AbstractBuffer.java new file mode 100644 index 00000000..958d12af --- /dev/null +++ b/MPChartLib/src/main/java/com/github/mikephil/charting/buffer/AbstractBuffer.java @@ -0,0 +1,91 @@ + +package com.github.mikephil.charting.buffer; + +import java.util.List; + +/** + * Buffer class to boost performance while drawing. Concept: Replace instead of + * recreate. + * + * @author Philipp Jahoda + * @param <T> The data the buffer accepts to be fed with. + */ +public abstract class AbstractBuffer<T> { + + /** index in the buffer */ + protected int index = 0; + + /** float-buffer that holds the data points to draw, order: x,y,x,y,... */ + public final float[] buffer; + + /** animation phase x-axis */ + protected float phaseX = 1f; + + /** animation phase y-axis */ + protected float phaseY = 1f; + + /** indicates from which x-index the visible data begins */ + protected int mFrom = 0; + + /** indicates to which x-index the visible data ranges */ + protected int mTo = 0; + + /** + * Initialization with buffer-size. + * + * @param size + */ + public AbstractBuffer(int size) { + index = 0; + buffer = new float[size]; + } + + /** limits the drawing on the x-axis */ + public void limitFrom(int from) { + if (from < 0) + from = 0; + mFrom = from; + } + + /** limits the drawing on the x-axis */ + public void limitTo(int to) { + if (to < 0) + to = 0; + mTo = to; + } + + /** + * Resets the buffer index to 0 and makes the buffer reusable. + */ + public void reset() { + index = 0; + } + + /** + * Returns the size (length) of the buffer array. + * + * @return + */ + public int size() { + return buffer.length; + } + + /** + * Set the phases used for animations. + * + * @param phaseX + * @param phaseY + */ + public void setPhases(float phaseX, float phaseY) { + this.phaseX = phaseX; + this.phaseY = phaseY; + } + + /** + * Builds up the buffer with the provided data and resets the buffer-index + * after feed-completion. This needs to run FAST. + * + * @param data + */ + public abstract void feed(T data); +} diff --git a/MPChartLib/src/main/java/com/github/mikephil/charting/buffer/BarBuffer.java b/MPChartLib/src/main/java/com/github/mikephil/charting/buffer/BarBuffer.java new file mode 100644 index 00000000..136a2314 --- /dev/null +++ b/MPChartLib/src/main/java/com/github/mikephil/charting/buffer/BarBuffer.java @@ -0,0 +1,130 @@ + +package com.github.mikephil.charting.buffer; + +import com.github.mikephil.charting.data.BarEntry; +import com.github.mikephil.charting.interfaces.datasets.IBarDataSet; + +public class BarBuffer extends AbstractBuffer<IBarDataSet> { + + protected int mDataSetIndex = 0; + protected int mDataSetCount = 1; + protected boolean mContainsStacks = false; + protected boolean mInverted = false; + + /** width of the bar on the x-axis, in values (not pixels) */ + protected float mBarWidth = 1f; + + public BarBuffer(int size, int dataSetCount, boolean containsStacks) { + super(size); + this.mDataSetCount = dataSetCount; + this.mContainsStacks = containsStacks; + } + + public void setBarWidth(float barWidth) { + this.mBarWidth = barWidth; + } + + public void setDataSet(int index) { + this.mDataSetIndex = index; + } + + public void setInverted(boolean inverted) { + this.mInverted = inverted; + } + + protected void addBar(float left, float top, float right, float bottom) { + + buffer[index++] = left; + buffer[index++] = top; + buffer[index++] = right; + buffer[index++] = bottom; + } + + @Override + public void feed(IBarDataSet data) { + + float size = data.getEntryCount() * phaseX; + float barWidthHalf = mBarWidth / 2f; + + for (int i = 0; i < size; i++) { + + BarEntry e = data.getEntryForIndex(i); + + if(e == null) + continue; + + float x = e.getX(); + float y = e.getY(); + float[] vals = e.getYVals(); + + if (!mContainsStacks || vals == null) { + + float left = x - barWidthHalf; + float right = x + barWidthHalf; + float bottom, top; + + if (mInverted) { + bottom = y >= 0 ? y : 0; + top = y <= 0 ? y : 0; + } else { + top = y >= 0 ? y : 0; + bottom = y <= 0 ? y : 0; + } + + // multiply the height of the rect with the phase + if (top > 0) + top *= phaseY; + else + bottom *= phaseY; + + addBar(left, top, right, bottom); + + } else { + + float posY = 0f; + float negY = -e.getNegativeSum(); + float yStart = 0f; + + // fill the stack + for (int k = 0; k < vals.length; k++) { + + float value = vals[k]; + + if (value == 0.0f && (posY == 0.0f || negY == 0.0f)) { + // Take care of the situation of a 0.0 value, which overlaps a non-zero bar + y = value; + yStart = y; + } else if (value >= 0.0f) { + y = posY; + yStart = posY + value; + posY = yStart; + } else { + y = negY; + yStart = negY + Math.abs(value); + negY += Math.abs(value); + } + + float left = x - barWidthHalf; + float right = x + barWidthHalf; + float bottom, top; + + if (mInverted) { + bottom = y >= yStart ? y : yStart; + top = y <= yStart ? y : yStart; + } else { + top = y >= yStart ? y : yStart; + bottom = y <= yStart ? y : yStart; + } + + // multiply the height of the rect with the phase + top *= phaseY; + bottom *= phaseY; + + addBar(left, top, right, bottom); + } + } + } + + reset(); + } +} diff --git a/MPChartLib/src/main/java/com/github/mikephil/charting/buffer/HorizontalBarBuffer.java b/MPChartLib/src/main/java/com/github/mikephil/charting/buffer/HorizontalBarBuffer.java new file mode 100644 index 00000000..6b63bc30 --- /dev/null +++ b/MPChartLib/src/main/java/com/github/mikephil/charting/buffer/HorizontalBarBuffer.java @@ -0,0 +1,94 @@ + +package com.github.mikephil.charting.buffer; + +import com.github.mikephil.charting.data.BarEntry; +import com.github.mikephil.charting.interfaces.datasets.IBarDataSet; + +public class HorizontalBarBuffer extends BarBuffer { + + public HorizontalBarBuffer(int size, int dataSetCount, boolean containsStacks) { + super(size, dataSetCount, containsStacks); + } + + @Override + public void feed(IBarDataSet data) { + + float size = data.getEntryCount() * phaseX; + float barWidthHalf = mBarWidth / 2f; + + for (int i = 0; i < size; i++) { + + BarEntry e = data.getEntryForIndex(i); + + if(e == null) + continue; + + float x = e.getX(); + float y = e.getY(); + float[] vals = e.getYVals(); + + if (!mContainsStacks || vals == null) { + + float bottom = x - barWidthHalf; + float top = x + barWidthHalf; + float left, right; + if (mInverted) { + left = y >= 0 ? y : 0; + right = y <= 0 ? y : 0; + } else { + right = y >= 0 ? y : 0; + left = y <= 0 ? y : 0; + } + + // multiply the height of the rect with the phase + if (right > 0) + right *= phaseY; + else + left *= phaseY; + + addBar(left, top, right, bottom); + + } else { + + float posY = 0f; + float negY = -e.getNegativeSum(); + float yStart = 0f; + + // fill the stack + for (int k = 0; k < vals.length; k++) { + + float value = vals[k]; + + if (value >= 0f) { + y = posY; + yStart = posY + value; + posY = yStart; + } else { + y = negY; + yStart = negY + Math.abs(value); + negY += Math.abs(value); + } + + float bottom = x - barWidthHalf; + float top = x + barWidthHalf; + float left, right; + if (mInverted) { + left = y >= yStart ? y : yStart; + right = y <= yStart ? y : yStart; + } else { + right = y >= yStart ? y : yStart; + left = y <= yStart ? y : yStart; + } + + // multiply the height of the rect with the phase + right *= phaseY; + left *= phaseY; + + addBar(left, top, right, bottom); + } + } + } + + reset(); + } +} diff --git a/MPChartLib/src/main/java/com/github/mikephil/charting/charts/BarChart.java b/MPChartLib/src/main/java/com/github/mikephil/charting/charts/BarChart.java new file mode 100644 index 00000000..2ba15c91 --- /dev/null +++ b/MPChartLib/src/main/java/com/github/mikephil/charting/charts/BarChart.java @@ -0,0 +1,258 @@ +package com.github.mikephil.charting.charts; + +import android.content.Context; +import android.graphics.RectF; +import android.util.AttributeSet; +import android.util.Log; + +import com.github.mikephil.charting.components.YAxis; +import com.github.mikephil.charting.data.BarData; +import com.github.mikephil.charting.data.BarEntry; +import com.github.mikephil.charting.highlight.BarHighlighter; +import com.github.mikephil.charting.highlight.Highlight; +import com.github.mikephil.charting.interfaces.dataprovider.BarDataProvider; +import com.github.mikephil.charting.interfaces.datasets.IBarDataSet; +import com.github.mikephil.charting.renderer.BarChartRenderer; + +/** + * Chart that draws bars. + * + * @author Philipp Jahoda + */ +public class BarChart extends BarLineChartBase<BarData> implements BarDataProvider { + + /** + * flag that indicates whether the highlight should be full-bar oriented, or single-value? + */ + protected boolean mHighlightFullBarEnabled = false; + + /** + * if set to true, all values are drawn above their bars, instead of below their top + */ + private boolean mDrawValueAboveBar = true; + + /** + * if set to true, a grey area is drawn behind each bar that indicates the maximum value + */ + private boolean mDrawBarShadow = false; + + private boolean mFitBars = false; + + public BarChart(Context context) { + super(context); + } + + public BarChart(Context context, AttributeSet attrs) { + super(context, attrs); + } + + public BarChart(Context context, AttributeSet attrs, int defStyle) { + super(context, attrs, defStyle); + } + + @Override + protected void init() { + super.init(); + + mRenderer = new BarChartRenderer(this, mAnimator, mViewPortHandler); + + setHighlighter(new BarHighlighter(this)); + + getXAxis().setSpaceMin(0.5f); + getXAxis().setSpaceMax(0.5f); + } + + @Override + protected void calcMinMax() { + + if (mFitBars) { + mXAxis.calculate(mData.getXMin() - mData.getBarWidth() / 2f, mData.getXMax() + mData.getBarWidth() / 2f); + } else { + mXAxis.calculate(mData.getXMin(), mData.getXMax()); + } + + // calculate axis range (min / max) according to provided data + mAxisLeft.calculate(mData.getYMin(YAxis.AxisDependency.LEFT), mData.getYMax(YAxis.AxisDependency.LEFT)); + mAxisRight.calculate(mData.getYMin(YAxis.AxisDependency.RIGHT), mData.getYMax(YAxis.AxisDependency + .RIGHT)); + } + + /** + * Returns the Highlight object (contains x-index and DataSet index) of the selected value at the given touch + * point + * inside the BarChart. + * + * @param x + * @param y + * @return + */ + @Override + public Highlight getHighlightByTouchPoint(float x, float y) { + + if (mData == null) { + Log.e(LOG_TAG, "Can't select by touch. No data set."); + return null; + } else { + Highlight h = getHighlighter().getHighlight(x, y); + if (h == null || !isHighlightFullBarEnabled()) return h; + + // For isHighlightFullBarEnabled, remove stackIndex + return new Highlight(h.getX(), h.getY(), + h.getXPx(), h.getYPx(), + h.getDataSetIndex(), -1, h.getAxis()); + } + } + + /** + * Returns the bounding box of the specified Entry in the specified DataSet. Returns null if the Entry could not be + * found in the charts data. Performance-intensive code should use void getBarBounds(BarEntry, RectF) instead. + * + * @param e + * @return + */ + public RectF getBarBounds(BarEntry e) { + + RectF bounds = new RectF(); + getBarBounds(e, bounds); + + return bounds; + } + + /** + * The passed outputRect will be assigned the values of the bounding box of the specified Entry in the specified DataSet. + * The rect will be assigned Float.MIN_VALUE in all locations if the Entry could not be found in the charts data. + * + * @param e + * @return + */ + public void getBarBounds(BarEntry e, RectF outputRect) { + + RectF bounds = outputRect; + + IBarDataSet set = mData.getDataSetForEntry(e); + + if (set == null) { + bounds.set(Float.MIN_VALUE, Float.MIN_VALUE, Float.MIN_VALUE, Float.MIN_VALUE); + return; + } + + float y = e.getY(); + float x = e.getX(); + + float barWidth = mData.getBarWidth(); + + float left = x - barWidth / 2f; + float right = x + barWidth / 2f; + float top = y >= 0 ? y : 0; + float bottom = y <= 0 ? y : 0; + + bounds.set(left, top, right, bottom); + + getTransformer(set.getAxisDependency()).rectValueToPixel(outputRect); + } + + /** + * If set to true, all values are drawn above their bars, instead of below their top. + * + * @param enabled + */ + public void setDrawValueAboveBar(boolean enabled) { + mDrawValueAboveBar = enabled; + } + + /** + * returns true if drawing values above bars is enabled, false if not + * + * @return + */ + public boolean isDrawValueAboveBarEnabled() { + return mDrawValueAboveBar; + } + + /** + * If set to true, a grey area is drawn behind each bar that indicates the maximum value. Enabling his will reduce + * performance by about 50%. + * + * @param enabled + */ + public void setDrawBarShadow(boolean enabled) { + mDrawBarShadow = enabled; + } + + /** + * returns true if drawing shadows (maxvalue) for each bar is enabled, false if not + * + * @return + */ + public boolean isDrawBarShadowEnabled() { + return mDrawBarShadow; + } + + /** + * Set this to true to make the highlight operation full-bar oriented, false to make it highlight single values (relevant + * only for stacked). If enabled, highlighting operations will highlight the whole bar, even if only a single stack entry + * was tapped. + * Default: false + * + * @param enabled + */ + public void setHighlightFullBarEnabled(boolean enabled) { + mHighlightFullBarEnabled = enabled; + } + + /** + * @return true the highlight operation is be full-bar oriented, false if single-value + */ + @Override + public boolean isHighlightFullBarEnabled() { + return mHighlightFullBarEnabled; + } + + /** + * Highlights the value at the given x-value in the given DataSet. Provide + * -1 as the dataSetIndex to undo all highlighting. + * + * @param x + * @param dataSetIndex + * @param stackIndex the index inside the stack - only relevant for stacked entries + */ + public void highlightValue(float x, int dataSetIndex, int stackIndex) { + highlightValue(new Highlight(x, dataSetIndex, stackIndex), false); + } + + @Override + public BarData getBarData() { + return mData; + } + + /** + * Adds half of the bar width to each side of the x-axis range in order to allow the bars of the barchart to be + * fully displayed. + * Default: false + * + * @param enabled + */ + public void setFitBars(boolean enabled) { + mFitBars = enabled; + } + + /** + * Groups all BarDataSet objects this data object holds together by modifying the x-value of their entries. + * Previously set x-values of entries will be overwritten. Leaves space between bars and groups as specified + * by the parameters. + * Calls notifyDataSetChanged() afterwards. + * + * @param fromX the starting point on the x-axis where the grouping should begin + * @param groupSpace the space between groups of bars in values (not pixels) e.g. 0.8f for bar width 1f + * @param barSpace the space between individual bars in values (not pixels) e.g. 0.1f for bar width 1f + */ + public void groupBars(float fromX, float groupSpace, float barSpace) { + + if (getBarData() == null) { + throw new RuntimeException("You need to set data for the chart before grouping bars."); + } else { + getBarData().groupBars(fromX, groupSpace, barSpace); + notifyDataSetChanged(); + } + } +} diff --git a/MPChartLib/src/main/java/com/github/mikephil/charting/charts/BarLineChartBase.java b/MPChartLib/src/main/java/com/github/mikephil/charting/charts/BarLineChartBase.java new file mode 100644 index 00000000..0926dff2 --- /dev/null +++ b/MPChartLib/src/main/java/com/github/mikephil/charting/charts/BarLineChartBase.java @@ -0,0 +1,1674 @@ + +package com.github.mikephil.charting.charts; + +import android.annotation.SuppressLint; +import android.annotation.TargetApi; +import android.content.Context; +import android.graphics.Canvas; +import android.graphics.Color; +import android.graphics.Matrix; +import android.graphics.Paint; +import android.graphics.Paint.Style; +import android.graphics.RectF; +import android.util.AttributeSet; +import android.util.Log; +import android.view.MotionEvent; + +import com.github.mikephil.charting.components.XAxis.XAxisPosition; +import com.github.mikephil.charting.components.YAxis; +import com.github.mikephil.charting.components.YAxis.AxisDependency; +import com.github.mikephil.charting.data.BarLineScatterCandleBubbleData; +import com.github.mikephil.charting.data.Entry; +import com.github.mikephil.charting.highlight.ChartHighlighter; +import com.github.mikephil.charting.highlight.Highlight; +import com.github.mikephil.charting.interfaces.dataprovider.BarLineScatterCandleBubbleDataProvider; +import com.github.mikephil.charting.interfaces.datasets.IBarLineScatterCandleBubbleDataSet; +import com.github.mikephil.charting.jobs.AnimatedMoveViewJob; +import com.github.mikephil.charting.jobs.AnimatedZoomJob; +import com.github.mikephil.charting.jobs.MoveViewJob; +import com.github.mikephil.charting.jobs.ZoomJob; +import com.github.mikephil.charting.listener.BarLineChartTouchListener; +import com.github.mikephil.charting.listener.OnDrawListener; +import com.github.mikephil.charting.renderer.XAxisRenderer; +import com.github.mikephil.charting.renderer.YAxisRenderer; +import com.github.mikephil.charting.utils.MPPointD; +import com.github.mikephil.charting.utils.MPPointF; +import com.github.mikephil.charting.utils.Transformer; +import com.github.mikephil.charting.utils.Utils; + +/** + * Base-class of LineChart, BarChart, ScatterChart and CandleStickChart. + * + * @author Philipp Jahoda + */ +@SuppressLint("RtlHardcoded") +public abstract class BarLineChartBase<T extends BarLineScatterCandleBubbleData<? extends + IBarLineScatterCandleBubbleDataSet<? extends Entry>>> + extends Chart<T> implements BarLineScatterCandleBubbleDataProvider { + + /** + * the maximum number of entries to which values will be drawn + * (entry numbers greater than this value will cause value-labels to disappear) + */ + protected int mMaxVisibleCount = 100; + + /** + * flag that indicates if auto scaling on the y axis is enabled + */ + protected boolean mAutoScaleMinMaxEnabled = false; + + /** + * flag that indicates if pinch-zoom is enabled. if true, both x and y axis + * can be scaled with 2 fingers, if false, x and y axis can be scaled + * separately + */ + protected boolean mPinchZoomEnabled = false; + + /** + * flag that indicates if double tap zoom is enabled or not + */ + protected boolean mDoubleTapToZoomEnabled = true; + + /** + * flag that indicates if highlighting per dragging over a fully zoomed out + * chart is enabled + */ + protected boolean mHighlightPerDragEnabled = true; + + /** + * if true, dragging is enabled for the chart + */ + private boolean mDragXEnabled = true; + private boolean mDragYEnabled = true; + + private boolean mScaleXEnabled = true; + private boolean mScaleYEnabled = true; + + /** + * paint object for the (by default) lightgrey background of the grid + */ + protected Paint mGridBackgroundPaint; + + protected Paint mBorderPaint; + + /** + * flag indicating if the grid background should be drawn or not + */ + protected boolean mDrawGridBackground = false; + + protected boolean mDrawBorders = false; + + protected boolean mClipValuesToContent = false; + + protected boolean mClipDataToContent = true; + + /** + * Sets the minimum offset (padding) around the chart, defaults to 15 + */ + protected float mMinOffset = 15.f; + + /** + * flag indicating if the chart should stay at the same position after a rotation. Default is false. + */ + protected boolean mKeepPositionOnRotation = false; + + /** + * the listener for user drawing on the chart + */ + protected OnDrawListener mDrawListener; + + /** + * the object representing the labels on the left y-axis + */ + protected YAxis mAxisLeft; + + /** + * the object representing the labels on the right y-axis + */ + protected YAxis mAxisRight; + + protected YAxisRenderer mAxisRendererLeft; + protected YAxisRenderer mAxisRendererRight; + + protected Transformer mLeftAxisTransformer; + protected Transformer mRightAxisTransformer; + + protected XAxisRenderer mXAxisRenderer; + + // /** the approximator object used for data filtering */ + // private Approximator mApproximator; + + public BarLineChartBase(Context context, AttributeSet attrs, int defStyle) { + super(context, attrs, defStyle); + } + + public BarLineChartBase(Context context, AttributeSet attrs) { + super(context, attrs); + } + + public BarLineChartBase(Context context) { + super(context); + } + + @Override + protected void init() { + super.init(); + + mAxisLeft = new YAxis(AxisDependency.LEFT); + mAxisRight = new YAxis(AxisDependency.RIGHT); + + mLeftAxisTransformer = new Transformer(mViewPortHandler); + mRightAxisTransformer = new Transformer(mViewPortHandler); + + mAxisRendererLeft = new YAxisRenderer(mViewPortHandler, mAxisLeft, mLeftAxisTransformer); + mAxisRendererRight = new YAxisRenderer(mViewPortHandler, mAxisRight, mRightAxisTransformer); + + mXAxisRenderer = new XAxisRenderer(mViewPortHandler, mXAxis, mLeftAxisTransformer); + + setHighlighter(new ChartHighlighter(this)); + + mChartTouchListener = new BarLineChartTouchListener(this, mViewPortHandler.getMatrixTouch(), 3f); + + mGridBackgroundPaint = new Paint(); + mGridBackgroundPaint.setStyle(Style.FILL); + // mGridBackgroundPaint.setColor(Color.WHITE); + mGridBackgroundPaint.setColor(Color.rgb(240, 240, 240)); // light + // grey + + mBorderPaint = new Paint(); + mBorderPaint.setStyle(Style.STROKE); + mBorderPaint.setColor(Color.BLACK); + mBorderPaint.setStrokeWidth(Utils.convertDpToPixel(1f)); + } + + // for performance tracking + private long totalTime = 0; + private long drawCycles = 0; + + @Override + protected void onDraw(Canvas canvas) { + super.onDraw(canvas); + + if (mData == null) + return; + + long starttime = System.currentTimeMillis(); + + // execute all drawing commands + drawGridBackground(canvas); + + if (mAutoScaleMinMaxEnabled) { + autoScale(); + } + + if (mAxisLeft.isEnabled()) + mAxisRendererLeft.computeAxis(mAxisLeft.mAxisMinimum, mAxisLeft.mAxisMaximum, mAxisLeft.isInverted()); + + if (mAxisRight.isEnabled()) + mAxisRendererRight.computeAxis(mAxisRight.mAxisMinimum, mAxisRight.mAxisMaximum, mAxisRight.isInverted()); + + if (mXAxis.isEnabled()) + mXAxisRenderer.computeAxis(mXAxis.mAxisMinimum, mXAxis.mAxisMaximum, false); + + mXAxisRenderer.renderAxisLine(canvas); + mAxisRendererLeft.renderAxisLine(canvas); + mAxisRendererRight.renderAxisLine(canvas); + + if (mXAxis.isDrawGridLinesBehindDataEnabled()) + mXAxisRenderer.renderGridLines(canvas); + + if (mAxisLeft.isDrawGridLinesBehindDataEnabled()) + mAxisRendererLeft.renderGridLines(canvas); + + if (mAxisRight.isDrawGridLinesBehindDataEnabled()) + mAxisRendererRight.renderGridLines(canvas); + + if (mXAxis.isEnabled() && mXAxis.isDrawLimitLinesBehindDataEnabled()) + mXAxisRenderer.renderLimitLines(canvas); + + if (mAxisLeft.isEnabled() && mAxisLeft.isDrawLimitLinesBehindDataEnabled()) + mAxisRendererLeft.renderLimitLines(canvas); + + if (mAxisRight.isEnabled() && mAxisRight.isDrawLimitLinesBehindDataEnabled()) + mAxisRendererRight.renderLimitLines(canvas); + + int clipRestoreCount = canvas.save(); + + if (isClipDataToContentEnabled()) { + // make sure the data cannot be drawn outside the content-rect + canvas.clipRect(mViewPortHandler.getContentRect()); + } + + mRenderer.drawData(canvas); + + if (!mXAxis.isDrawGridLinesBehindDataEnabled()) + mXAxisRenderer.renderGridLines(canvas); + + if (!mAxisLeft.isDrawGridLinesBehindDataEnabled()) + mAxisRendererLeft.renderGridLines(canvas); + + if (!mAxisRight.isDrawGridLinesBehindDataEnabled()) + mAxisRendererRight.renderGridLines(canvas); + + // if highlighting is enabled + if (valuesToHighlight()) + mRenderer.drawHighlighted(canvas, mIndicesToHighlight); + + // Removes clipping rectangle + canvas.restoreToCount(clipRestoreCount); + + mRenderer.drawExtras(canvas); + + if (mXAxis.isEnabled() && !mXAxis.isDrawLimitLinesBehindDataEnabled()) + mXAxisRenderer.renderLimitLines(canvas); + + if (mAxisLeft.isEnabled() && !mAxisLeft.isDrawLimitLinesBehindDataEnabled()) + mAxisRendererLeft.renderLimitLines(canvas); + + if (mAxisRight.isEnabled() && !mAxisRight.isDrawLimitLinesBehindDataEnabled()) + mAxisRendererRight.renderLimitLines(canvas); + + mXAxisRenderer.renderAxisLabels(canvas); + mAxisRendererLeft.renderAxisLabels(canvas); + mAxisRendererRight.renderAxisLabels(canvas); + + if (isClipValuesToContentEnabled()) { + clipRestoreCount = canvas.save(); + canvas.clipRect(mViewPortHandler.getContentRect()); + + mRenderer.drawValues(canvas); + + canvas.restoreToCount(clipRestoreCount); + } else { + mRenderer.drawValues(canvas); + } + + mLegendRenderer.renderLegend(canvas); + + drawDescription(canvas); + + drawMarkers(canvas); + + if (mLogEnabled) { + long drawtime = (System.currentTimeMillis() - starttime); + totalTime += drawtime; + drawCycles += 1; + long average = totalTime / drawCycles; + Log.i(LOG_TAG, "Drawtime: " + drawtime + " ms, average: " + average + " ms, cycles: " + + drawCycles); + } + } + + /** + * RESET PERFORMANCE TRACKING FIELDS + */ + public void resetTracking() { + totalTime = 0; + drawCycles = 0; + } + + protected void prepareValuePxMatrix() { + + if (mLogEnabled) + Log.i(LOG_TAG, "Preparing Value-Px Matrix, xmin: " + mXAxis.mAxisMinimum + ", xmax: " + + mXAxis.mAxisMaximum + ", xdelta: " + mXAxis.mAxisRange); + + mRightAxisTransformer.prepareMatrixValuePx(mXAxis.mAxisMinimum, + mXAxis.mAxisRange, + mAxisRight.mAxisRange, + mAxisRight.mAxisMinimum); + mLeftAxisTransformer.prepareMatrixValuePx(mXAxis.mAxisMinimum, + mXAxis.mAxisRange, + mAxisLeft.mAxisRange, + mAxisLeft.mAxisMinimum); + } + + protected void prepareOffsetMatrix() { + + mRightAxisTransformer.prepareMatrixOffset(mAxisRight.isInverted()); + mLeftAxisTransformer.prepareMatrixOffset(mAxisLeft.isInverted()); + } + + @Override + public void notifyDataSetChanged() { + + if (mData == null) { + if (mLogEnabled) + Log.i(LOG_TAG, "Preparing... DATA NOT SET."); + return; + } else { + if (mLogEnabled) + Log.i(LOG_TAG, "Preparing..."); + } + + if (mRenderer != null) + mRenderer.initBuffers(); + + calcMinMax(); + + mAxisRendererLeft.computeAxis(mAxisLeft.mAxisMinimum, mAxisLeft.mAxisMaximum, mAxisLeft.isInverted()); + mAxisRendererRight.computeAxis(mAxisRight.mAxisMinimum, mAxisRight.mAxisMaximum, mAxisRight.isInverted()); + mXAxisRenderer.computeAxis(mXAxis.mAxisMinimum, mXAxis.mAxisMaximum, false); + + if (mLegend != null) + mLegendRenderer.computeLegend(mData); + + calculateOffsets(); + } + + /** + * Performs auto scaling of the axis by recalculating the minimum and maximum y-values based on the entries currently in view. + */ + protected void autoScale() { + + final float fromX = getLowestVisibleX(); + final float toX = getHighestVisibleX(); + + mData.calcMinMaxY(fromX, toX); + + mXAxis.calculate(mData.getXMin(), mData.getXMax()); + + // calculate axis range (min / max) according to provided data + + if (mAxisLeft.isEnabled()) + mAxisLeft.calculate(mData.getYMin(AxisDependency.LEFT), + mData.getYMax(AxisDependency.LEFT)); + + if (mAxisRight.isEnabled()) + mAxisRight.calculate(mData.getYMin(AxisDependency.RIGHT), + mData.getYMax(AxisDependency.RIGHT)); + + calculateOffsets(); + } + + @Override + protected void calcMinMax() { + + mXAxis.calculate(mData.getXMin(), mData.getXMax()); + + // calculate axis range (min / max) according to provided data + mAxisLeft.calculate(mData.getYMin(AxisDependency.LEFT), mData.getYMax(AxisDependency.LEFT)); + mAxisRight.calculate(mData.getYMin(AxisDependency.RIGHT), mData.getYMax(AxisDependency + .RIGHT)); + } + + protected void calculateLegendOffsets(RectF offsets) { + + offsets.left = 0.f; + offsets.right = 0.f; + offsets.top = 0.f; + offsets.bottom = 0.f; + + if (mLegend == null || !mLegend.isEnabled() || mLegend.isDrawInsideEnabled()) + return; + + switch (mLegend.getOrientation()) { + case VERTICAL: + + switch (mLegend.getHorizontalAlignment()) { + case LEFT: + offsets.left += Math.min(mLegend.mNeededWidth, + mViewPortHandler.getChartWidth() * mLegend.getMaxSizePercent()) + + mLegend.getXOffset(); + break; + + case RIGHT: + offsets.right += Math.min(mLegend.mNeededWidth, + mViewPortHandler.getChartWidth() * mLegend.getMaxSizePercent()) + + mLegend.getXOffset(); + break; + + case CENTER: + + switch (mLegend.getVerticalAlignment()) { + case TOP: + offsets.top += Math.min(mLegend.mNeededHeight, + mViewPortHandler.getChartHeight() * mLegend.getMaxSizePercent()) + + mLegend.getYOffset(); + break; + + case BOTTOM: + offsets.bottom += Math.min(mLegend.mNeededHeight, + mViewPortHandler.getChartHeight() * mLegend.getMaxSizePercent()) + + mLegend.getYOffset(); + break; + + default: + break; + } + } + + break; + + case HORIZONTAL: + + switch (mLegend.getVerticalAlignment()) { + case TOP: + offsets.top += Math.min(mLegend.mNeededHeight, + mViewPortHandler.getChartHeight() * mLegend.getMaxSizePercent()) + + mLegend.getYOffset(); + + + break; + + case BOTTOM: + offsets.bottom += Math.min(mLegend.mNeededHeight, + mViewPortHandler.getChartHeight() * mLegend.getMaxSizePercent()) + + mLegend.getYOffset(); + + + break; + + default: + break; + } + break; + } + } + + private RectF mOffsetsBuffer = new RectF(); + + @Override + public void calculateOffsets() { + + if (!mCustomViewPortEnabled) { + + float offsetLeft = 0f, offsetRight = 0f, offsetTop = 0f, offsetBottom = 0f; + + calculateLegendOffsets(mOffsetsBuffer); + + offsetLeft += mOffsetsBuffer.left; + offsetTop += mOffsetsBuffer.top; + offsetRight += mOffsetsBuffer.right; + offsetBottom += mOffsetsBuffer.bottom; + + // offsets for y-labels + if (mAxisLeft.needsOffset()) { + offsetLeft += mAxisLeft.getRequiredWidthSpace(mAxisRendererLeft + .getPaintAxisLabels()); + } + + if (mAxisRight.needsOffset()) { + offsetRight += mAxisRight.getRequiredWidthSpace(mAxisRendererRight + .getPaintAxisLabels()); + } + + if (mXAxis.isEnabled() && mXAxis.isDrawLabelsEnabled()) { + + float xLabelHeight = mXAxis.mLabelRotatedHeight + mXAxis.getYOffset(); + + // offsets for x-labels + if (mXAxis.getPosition() == XAxisPosition.BOTTOM) { + + offsetBottom += xLabelHeight; + + } else if (mXAxis.getPosition() == XAxisPosition.TOP) { + + offsetTop += xLabelHeight; + + } else if (mXAxis.getPosition() == XAxisPosition.BOTH_SIDED) { + + offsetBottom += xLabelHeight; + offsetTop += xLabelHeight; + } + } + + offsetTop += getExtraTopOffset(); + offsetRight += getExtraRightOffset(); + offsetBottom += getExtraBottomOffset(); + offsetLeft += getExtraLeftOffset(); + + float minOffset = Utils.convertDpToPixel(mMinOffset); + + mViewPortHandler.restrainViewPort( + Math.max(minOffset, offsetLeft), + Math.max(minOffset, offsetTop), + Math.max(minOffset, offsetRight), + Math.max(minOffset, offsetBottom)); + + if (mLogEnabled) { + Log.i(LOG_TAG, "offsetLeft: " + offsetLeft + ", offsetTop: " + offsetTop + + ", offsetRight: " + offsetRight + ", offsetBottom: " + offsetBottom); + Log.i(LOG_TAG, "Content: " + mViewPortHandler.getContentRect().toString()); + } + } + + prepareOffsetMatrix(); + prepareValuePxMatrix(); + } + + /** + * draws the grid background + */ + protected void drawGridBackground(Canvas c) { + + if (mDrawGridBackground) { + + // draw the grid background + c.drawRect(mViewPortHandler.getContentRect(), mGridBackgroundPaint); + } + + if (mDrawBorders) { + c.drawRect(mViewPortHandler.getContentRect(), mBorderPaint); + } + } + + /** + * Returns the Transformer class that contains all matrices and is + * responsible for transforming values into pixels on the screen and + * backwards. + * + * @return + */ + public Transformer getTransformer(AxisDependency which) { + if (which == AxisDependency.LEFT) + return mLeftAxisTransformer; + else + return mRightAxisTransformer; + } + + @Override + public boolean onTouchEvent(MotionEvent event) { + super.onTouchEvent(event); + + if (mChartTouchListener == null || mData == null) + return false; + + // check if touch gestures are enabled + if (!mTouchEnabled) + return false; + else + return mChartTouchListener.onTouch(this, event); + } + + @Override + public void computeScroll() { + + if (mChartTouchListener instanceof BarLineChartTouchListener) + ((BarLineChartTouchListener) mChartTouchListener).computeScroll(); + } + + /** + * ################ ################ ################ ################ + */ + /** + * CODE BELOW THIS RELATED TO SCALING AND GESTURES AND MODIFICATION OF THE + * VIEWPORT + */ + + protected Matrix mZoomMatrixBuffer = new Matrix(); + + /** + * Zooms in by 1.4f, into the charts center. + */ + public void zoomIn() { + + MPPointF center = mViewPortHandler.getContentCenter(); + + mViewPortHandler.zoomIn(center.x, -center.y, mZoomMatrixBuffer); + mViewPortHandler.refresh(mZoomMatrixBuffer, this, false); + + MPPointF.recycleInstance(center); + + // Range might have changed, which means that Y-axis labels + // could have changed in size, affecting Y-axis size. + // So we need to recalculate offsets. + calculateOffsets(); + postInvalidate(); + } + + /** + * Zooms out by 0.7f, from the charts center. + */ + public void zoomOut() { + + MPPointF center = mViewPortHandler.getContentCenter(); + + mViewPortHandler.zoomOut(center.x, -center.y, mZoomMatrixBuffer); + mViewPortHandler.refresh(mZoomMatrixBuffer, this, false); + + MPPointF.recycleInstance(center); + + // Range might have changed, which means that Y-axis labels + // could have changed in size, affecting Y-axis size. + // So we need to recalculate offsets. + calculateOffsets(); + postInvalidate(); + } + + /** + * Zooms out to original size. + */ + public void resetZoom() { + + mViewPortHandler.resetZoom(mZoomMatrixBuffer); + mViewPortHandler.refresh(mZoomMatrixBuffer, this, false); + + // Range might have changed, which means that Y-axis labels + // could have changed in size, affecting Y-axis size. + // So we need to recalculate offsets. + calculateOffsets(); + postInvalidate(); + } + + /** + * Zooms in or out by the given scale factor. x and y are the coordinates + * (in pixels) of the zoom center. + * + * @param scaleX if < 1f --> zoom out, if > 1f --> zoom in + * @param scaleY if < 1f --> zoom out, if > 1f --> zoom in + * @param x + * @param y + */ + public void zoom(float scaleX, float scaleY, float x, float y) { + + mViewPortHandler.zoom(scaleX, scaleY, x, -y, mZoomMatrixBuffer); + mViewPortHandler.refresh(mZoomMatrixBuffer, this, false); + + // Range might have changed, which means that Y-axis labels + // could have changed in size, affecting Y-axis size. + // So we need to recalculate offsets. + calculateOffsets(); + postInvalidate(); + } + + /** + * Zooms in or out by the given scale factor. + * x and y are the values (NOT PIXELS) of the zoom center.. + * + * @param scaleX + * @param scaleY + * @param xValue + * @param yValue + * @param axis the axis relative to which the zoom should take place + */ + public void zoom(float scaleX, float scaleY, float xValue, float yValue, AxisDependency axis) { + + Runnable job = ZoomJob.getInstance(mViewPortHandler, scaleX, scaleY, xValue, yValue, getTransformer(axis), axis, this); + addViewportJob(job); + } + + /** + * Zooms to the center of the chart with the given scale factor. + * + * @param scaleX + * @param scaleY + */ + public void zoomToCenter(float scaleX, float scaleY) { + + MPPointF center = getCenterOffsets(); + + Matrix save = mZoomMatrixBuffer; + mViewPortHandler.zoom(scaleX, scaleY, center.x, -center.y, save); + mViewPortHandler.refresh(save, this, false); + } + + /** + * Zooms by the specified scale factor to the specified values on the specified axis. + * + * @param scaleX + * @param scaleY + * @param xValue + * @param yValue + * @param axis + * @param duration + */ + @TargetApi(11) + public void zoomAndCenterAnimated(float scaleX, float scaleY, float xValue, float yValue, AxisDependency axis, + long duration) { + + MPPointD origin = getValuesByTouchPoint(mViewPortHandler.contentLeft(), mViewPortHandler.contentTop(), axis); + + Runnable job = AnimatedZoomJob.getInstance(mViewPortHandler, this, getTransformer(axis), getAxis(axis), mXAxis + .mAxisRange, scaleX, scaleY, mViewPortHandler.getScaleX(), mViewPortHandler.getScaleY(), + xValue, yValue, (float) origin.x, (float) origin.y, duration); + addViewportJob(job); + + MPPointD.recycleInstance(origin); + } + + protected Matrix mFitScreenMatrixBuffer = new Matrix(); + + /** + * Resets all zooming and dragging and makes the chart fit exactly it's + * bounds. + */ + public void fitScreen() { + Matrix save = mFitScreenMatrixBuffer; + mViewPortHandler.fitScreen(save); + mViewPortHandler.refresh(save, this, false); + + calculateOffsets(); + postInvalidate(); + } + + /** + * Sets the minimum scale factor value to which can be zoomed out. 1f = + * fitScreen + * + * @param scaleX + * @param scaleY + */ + public void setScaleMinima(float scaleX, float scaleY) { + mViewPortHandler.setMinimumScaleX(scaleX); + mViewPortHandler.setMinimumScaleY(scaleY); + } + + /** + * Sets the size of the area (range on the x-axis) that should be maximum + * visible at once (no further zooming out allowed). If this is e.g. set to + * 10, no more than a range of 10 on the x-axis can be viewed at once without + * scrolling. + * + * @param maxXRange The maximum visible range of x-values. + */ + public void setVisibleXRangeMaximum(float maxXRange) { + float xScale = mXAxis.mAxisRange / (maxXRange); + mViewPortHandler.setMinimumScaleX(xScale); + } + + /** + * Sets the size of the area (range on the x-axis) that should be minimum + * visible at once (no further zooming in allowed). If this is e.g. set to + * 10, no less than a range of 10 on the x-axis can be viewed at once without + * scrolling. + * + * @param minXRange The minimum visible range of x-values. + */ + public void setVisibleXRangeMinimum(float minXRange) { + float xScale = mXAxis.mAxisRange / (minXRange); + mViewPortHandler.setMaximumScaleX(xScale); + } + + /** + * Limits the maximum and minimum x range that can be visible by pinching and zooming. e.g. minRange=10, maxRange=100 the + * smallest range to be displayed at once is 10, and no more than a range of 100 values can be viewed at once without + * scrolling + * + * @param minXRange + * @param maxXRange + */ + public void setVisibleXRange(float minXRange, float maxXRange) { + float minScale = mXAxis.mAxisRange / minXRange; + float maxScale = mXAxis.mAxisRange / maxXRange; + mViewPortHandler.setMinMaxScaleX(minScale, maxScale); + } + + /** + * Sets the size of the area (range on the y-axis) that should be maximum + * visible at once. + * + * @param maxYRange the maximum visible range on the y-axis + * @param axis the axis for which this limit should apply + */ + public void setVisibleYRangeMaximum(float maxYRange, AxisDependency axis) { + float yScale = getAxisRange(axis) / maxYRange; + mViewPortHandler.setMinimumScaleY(yScale); + } + + /** + * Sets the size of the area (range on the y-axis) that should be minimum visible at once, no further zooming in possible. + * + * @param minYRange + * @param axis the axis for which this limit should apply + */ + public void setVisibleYRangeMinimum(float minYRange, AxisDependency axis) { + float yScale = getAxisRange(axis) / minYRange; + mViewPortHandler.setMaximumScaleY(yScale); + } + + /** + * Limits the maximum and minimum y range that can be visible by pinching and zooming. + * + * @param minYRange + * @param maxYRange + * @param axis + */ + public void setVisibleYRange(float minYRange, float maxYRange, AxisDependency axis) { + float minScale = getAxisRange(axis) / minYRange; + float maxScale = getAxisRange(axis) / maxYRange; + mViewPortHandler.setMinMaxScaleY(minScale, maxScale); + } + + + /** + * Moves the left side of the current viewport to the specified x-position. + * This also refreshes the chart by calling invalidate(). + * + * @param xValue + */ + public void moveViewToX(float xValue) { + + Runnable job = MoveViewJob.getInstance(mViewPortHandler, xValue, 0f, + getTransformer(AxisDependency.LEFT), this); + + addViewportJob(job); + } + + /** + * This will move the left side of the current viewport to the specified + * x-value on the x-axis, and center the viewport to the specified y value on the y-axis. + * This also refreshes the chart by calling invalidate(). + * + * @param xValue + * @param yValue + * @param axis - which axis should be used as a reference for the y-axis + */ + public void moveViewTo(float xValue, float yValue, AxisDependency axis) { + + float yInView = getAxisRange(axis) / mViewPortHandler.getScaleY(); + + Runnable job = MoveViewJob.getInstance(mViewPortHandler, xValue, yValue + yInView / 2f, + getTransformer(axis), this); + + addViewportJob(job); + } + + /** + * This will move the left side of the current viewport to the specified x-value + * and center the viewport to the y value animated. + * This also refreshes the chart by calling invalidate(). + * + * @param xValue + * @param yValue + * @param axis + * @param duration the duration of the animation in milliseconds + */ + @TargetApi(11) + public void moveViewToAnimated(float xValue, float yValue, AxisDependency axis, long duration) { + + MPPointD bounds = getValuesByTouchPoint(mViewPortHandler.contentLeft(), mViewPortHandler.contentTop(), axis); + + float yInView = getAxisRange(axis) / mViewPortHandler.getScaleY(); + + Runnable job = AnimatedMoveViewJob.getInstance(mViewPortHandler, xValue, yValue + yInView / 2f, + getTransformer(axis), this, (float) bounds.x, (float) bounds.y, duration); + + addViewportJob(job); + + MPPointD.recycleInstance(bounds); + } + + /** + * Centers the viewport to the specified y value on the y-axis. + * This also refreshes the chart by calling invalidate(). + * + * @param yValue + * @param axis - which axis should be used as a reference for the y-axis + */ + public void centerViewToY(float yValue, AxisDependency axis) { + + float valsInView = getAxisRange(axis) / mViewPortHandler.getScaleY(); + + Runnable job = MoveViewJob.getInstance(mViewPortHandler, 0f, yValue + valsInView / 2f, + getTransformer(axis), this); + + addViewportJob(job); + } + + /** + * This will move the center of the current viewport to the specified + * x and y value. + * This also refreshes the chart by calling invalidate(). + * + * @param xValue + * @param yValue + * @param axis - which axis should be used as a reference for the y axis + */ + public void centerViewTo(float xValue, float yValue, AxisDependency axis) { + + float yInView = getAxisRange(axis) / mViewPortHandler.getScaleY(); + float xInView = getXAxis().mAxisRange / mViewPortHandler.getScaleX(); + + Runnable job = MoveViewJob.getInstance(mViewPortHandler, + xValue - xInView / 2f, yValue + yInView / 2f, + getTransformer(axis), this); + + addViewportJob(job); + } + + /** + * This will move the center of the current viewport to the specified + * x and y value animated. + * + * @param xValue + * @param yValue + * @param axis + * @param duration the duration of the animation in milliseconds + */ + @TargetApi(11) + public void centerViewToAnimated(float xValue, float yValue, AxisDependency axis, long duration) { + + MPPointD bounds = getValuesByTouchPoint(mViewPortHandler.contentLeft(), mViewPortHandler.contentTop(), axis); + + float yInView = getAxisRange(axis) / mViewPortHandler.getScaleY(); + float xInView = getXAxis().mAxisRange / mViewPortHandler.getScaleX(); + + Runnable job = AnimatedMoveViewJob.getInstance(mViewPortHandler, + xValue - xInView / 2f, yValue + yInView / 2f, + getTransformer(axis), this, (float) bounds.x, (float) bounds.y, duration); + + addViewportJob(job); + + MPPointD.recycleInstance(bounds); + } + + /** + * flag that indicates if a custom viewport offset has been set + */ + private boolean mCustomViewPortEnabled = false; + + /** + * Sets custom offsets for the current ViewPort (the offsets on the sides of + * the actual chart window). Setting this will prevent the chart from + * automatically calculating it's offsets. Use resetViewPortOffsets() to + * undo this. ONLY USE THIS WHEN YOU KNOW WHAT YOU ARE DOING, else use + * setExtraOffsets(...). + * + * @param left + * @param top + * @param right + * @param bottom + */ + public void setViewPortOffsets(final float left, final float top, + final float right, final float bottom) { + + mCustomViewPortEnabled = true; + post(new Runnable() { + + @Override + public void run() { + + mViewPortHandler.restrainViewPort(left, top, right, bottom); + prepareOffsetMatrix(); + prepareValuePxMatrix(); + } + }); + } + + /** + * Resets all custom offsets set via setViewPortOffsets(...) method. Allows + * the chart to again calculate all offsets automatically. + */ + public void resetViewPortOffsets() { + mCustomViewPortEnabled = false; + calculateOffsets(); + } + + /** + * ################ ################ ################ ################ + */ + /** CODE BELOW IS GETTERS AND SETTERS */ + + /** + * Returns the range of the specified axis. + * + * @param axis + * @return + */ + protected float getAxisRange(AxisDependency axis) { + if (axis == AxisDependency.LEFT) + return mAxisLeft.mAxisRange; + else + return mAxisRight.mAxisRange; + } + + /** + * Sets the OnDrawListener + * + * @param drawListener + */ + public void setOnDrawListener(OnDrawListener drawListener) { + this.mDrawListener = drawListener; + } + + /** + * Gets the OnDrawListener. May be null. + * + * @return + */ + public OnDrawListener getDrawListener() { + return mDrawListener; + } + + protected float[] mGetPositionBuffer = new float[2]; + + /** + * Returns a recyclable MPPointF instance. + * Returns the position (in pixels) the provided Entry has inside the chart + * view or null, if the provided Entry is null. + * + * @param e + * @return + */ + public MPPointF getPosition(Entry e, AxisDependency axis) { + + if (e == null) + return null; + + mGetPositionBuffer[0] = e.getX(); + mGetPositionBuffer[1] = e.getY(); + + getTransformer(axis).pointValuesToPixel(mGetPositionBuffer); + + return MPPointF.getInstance(mGetPositionBuffer[0], mGetPositionBuffer[1]); + } + + /** + * sets the number of maximum visible drawn values on the chart only active + * when setDrawValues() is enabled + * + * @param count + */ + public void setMaxVisibleValueCount(int count) { + this.mMaxVisibleCount = count; + } + + public int getMaxVisibleCount() { + return mMaxVisibleCount; + } + + /** + * Set this to true to allow highlighting per dragging over the chart + * surface when it is fully zoomed out. Default: true + * + * @param enabled + */ + public void setHighlightPerDragEnabled(boolean enabled) { + mHighlightPerDragEnabled = enabled; + } + + public boolean isHighlightPerDragEnabled() { + return mHighlightPerDragEnabled; + } + + /** + * Sets the color for the background of the chart-drawing area (everything + * behind the grid lines). + * + * @param color + */ + public void setGridBackgroundColor(int color) { + mGridBackgroundPaint.setColor(color); + } + + /** + * Set this to true to enable dragging (moving the chart with the finger) + * for the chart (this does not effect scaling). + * + * @param enabled + */ + public void setDragEnabled(boolean enabled) { + this.mDragXEnabled = enabled; + this.mDragYEnabled = enabled; + } + + /** + * Returns true if dragging is enabled for the chart, false if not. + * + * @return + */ + public boolean isDragEnabled() { + return mDragXEnabled || mDragYEnabled; + } + + /** + * Set this to true to enable dragging on the X axis + * + * @param enabled + */ + public void setDragXEnabled(boolean enabled) { + this.mDragXEnabled = enabled; + } + + /** + * Returns true if dragging on the X axis is enabled for the chart, false if not. + * + * @return + */ + public boolean isDragXEnabled() { + return mDragXEnabled; + } + + /** + * Set this to true to enable dragging on the Y axis + * + * @param enabled + */ + public void setDragYEnabled(boolean enabled) { + this.mDragYEnabled = enabled; + } + + /** + * Returns true if dragging on the Y axis is enabled for the chart, false if not. + * + * @return + */ + public boolean isDragYEnabled() { + return mDragYEnabled; + } + + /** + * Set this to true to enable scaling (zooming in and out by gesture) for + * the chart (this does not effect dragging) on both X- and Y-Axis. + * + * @param enabled + */ + public void setScaleEnabled(boolean enabled) { + this.mScaleXEnabled = enabled; + this.mScaleYEnabled = enabled; + } + + public void setScaleXEnabled(boolean enabled) { + mScaleXEnabled = enabled; + } + + public void setScaleYEnabled(boolean enabled) { + mScaleYEnabled = enabled; + } + + public boolean isScaleXEnabled() { + return mScaleXEnabled; + } + + public boolean isScaleYEnabled() { + return mScaleYEnabled; + } + + /** + * Set this to true to enable zooming in by double-tap on the chart. + * Default: enabled + * + * @param enabled + */ + public void setDoubleTapToZoomEnabled(boolean enabled) { + mDoubleTapToZoomEnabled = enabled; + } + + /** + * Returns true if zooming via double-tap is enabled false if not. + * + * @return + */ + public boolean isDoubleTapToZoomEnabled() { + return mDoubleTapToZoomEnabled; + } + + /** + * set this to true to draw the grid background, false if not + * + * @param enabled + */ + public void setDrawGridBackground(boolean enabled) { + mDrawGridBackground = enabled; + } + + /** + * When enabled, the borders rectangle will be rendered. + * If this is enabled, there is no point drawing the axis-lines of x- and y-axis. + * + * @param enabled + */ + public void setDrawBorders(boolean enabled) { + mDrawBorders = enabled; + } + + /** + * When enabled, the borders rectangle will be rendered. + * If this is enabled, there is no point drawing the axis-lines of x- and y-axis. + * + * @return + */ + public boolean isDrawBordersEnabled() { + return mDrawBorders; + } + + /** + * When enabled, the values will be clipped to contentRect, + * otherwise they can bleed outside the content rect. + * + * @param enabled + */ + public void setClipValuesToContent(boolean enabled) { + mClipValuesToContent = enabled; + } + + /** + * When disabled, the data and/or highlights will not be clipped to contentRect. Disabling this option can + * be useful, when the data lies fully within the content rect, but is drawn in such a way (such as thick lines) + * that there is unwanted clipping. + * + * @param enabled + */ + public void setClipDataToContent(boolean enabled) { + mClipDataToContent = enabled; + } + + /** + * When enabled, the values will be clipped to contentRect, + * otherwise they can bleed outside the content rect. + * + * @return + */ + public boolean isClipValuesToContentEnabled() { + return mClipValuesToContent; + } + + /** + * When disabled, the data and/or highlights will not be clipped to contentRect. Disabling this option can + * be useful, when the data lies fully within the content rect, but is drawn in such a way (such as thick lines) + * that there is unwanted clipping. + * + * @return + */ + public boolean isClipDataToContentEnabled() { + return mClipDataToContent; + } + + /** + * Sets the width of the border lines in dp. + * + * @param width + */ + public void setBorderWidth(float width) { + mBorderPaint.setStrokeWidth(Utils.convertDpToPixel(width)); + } + + /** + * Sets the color of the chart border lines. + * + * @param color + */ + public void setBorderColor(int color) { + mBorderPaint.setColor(color); + } + + /** + * Gets the minimum offset (padding) around the chart, defaults to 15.f + */ + public float getMinOffset() { + return mMinOffset; + } + + /** + * Sets the minimum offset (padding) around the chart, defaults to 15.f + */ + public void setMinOffset(float minOffset) { + mMinOffset = minOffset; + } + + /** + * Returns true if keeping the position on rotation is enabled and false if not. + */ + public boolean isKeepPositionOnRotation() { + return mKeepPositionOnRotation; + } + + /** + * Sets whether the chart should keep its position (zoom / scroll) after a rotation (orientation change) + */ + public void setKeepPositionOnRotation(boolean keepPositionOnRotation) { + mKeepPositionOnRotation = keepPositionOnRotation; + } + + /** + * Returns a recyclable MPPointD instance + * Returns the x and y values in the chart at the given touch point + * (encapsulated in a MPPointD). This method transforms pixel coordinates to + * coordinates / values in the chart. This is the opposite method to + * getPixelForValues(...). + * + * @param x + * @param y + * @return + */ + public MPPointD getValuesByTouchPoint(float x, float y, AxisDependency axis) { + MPPointD result = MPPointD.getInstance(0, 0); + getValuesByTouchPoint(x, y, axis, result); + return result; + } + + public void getValuesByTouchPoint(float x, float y, AxisDependency axis, MPPointD outputPoint) { + getTransformer(axis).getValuesByTouchPoint(x, y, outputPoint); + } + + /** + * Returns a recyclable MPPointD instance + * Transforms the given chart values into pixels. This is the opposite + * method to getValuesByTouchPoint(...). + * + * @param x + * @param y + * @return + */ + public MPPointD getPixelForValues(float x, float y, AxisDependency axis) { + return getTransformer(axis).getPixelForValues(x, y); + } + + /** + * returns the Entry object displayed at the touched position of the chart + * + * @param x + * @param y + * @return + */ + public Entry getEntryByTouchPoint(float x, float y) { + Highlight h = getHighlightByTouchPoint(x, y); + if (h != null) { + return mData.getEntryForHighlight(h); + } + return null; + } + + /** + * returns the DataSet object displayed at the touched position of the chart + * + * @param x + * @param y + * @return + */ + public IBarLineScatterCandleBubbleDataSet getDataSetByTouchPoint(float x, float y) { + Highlight h = getHighlightByTouchPoint(x, y); + if (h != null) { + return mData.getDataSetByIndex(h.getDataSetIndex()); + } + return null; + } + + /** + * buffer for storing lowest visible x point + */ + protected MPPointD posForGetLowestVisibleX = MPPointD.getInstance(0, 0); + + /** + * Returns the lowest x-index (value on the x-axis) that is still visible on + * the chart. + * + * @return + */ + @Override + public float getLowestVisibleX() { + getTransformer(AxisDependency.LEFT).getValuesByTouchPoint(mViewPortHandler.contentLeft(), + mViewPortHandler.contentBottom(), posForGetLowestVisibleX); + float result = (float) Math.max(mXAxis.mAxisMinimum, posForGetLowestVisibleX.x); + return result; + } + + /** + * buffer for storing highest visible x point + */ + protected MPPointD posForGetHighestVisibleX = MPPointD.getInstance(0, 0); + + /** + * Returns the highest x-index (value on the x-axis) that is still visible + * on the chart. + * + * @return + */ + @Override + public float getHighestVisibleX() { + getTransformer(AxisDependency.LEFT).getValuesByTouchPoint(mViewPortHandler.contentRight(), + mViewPortHandler.contentBottom(), posForGetHighestVisibleX); + float result = (float) Math.min(mXAxis.mAxisMaximum, posForGetHighestVisibleX.x); + return result; + } + + /** + * Returns the range visible on the x-axis. + * + * @return + */ + public float getVisibleXRange() { + return Math.abs(getHighestVisibleX() - getLowestVisibleX()); + } + + /** + * returns the current x-scale factor + */ + public float getScaleX() { + if (mViewPortHandler == null) + return 1f; + else + return mViewPortHandler.getScaleX(); + } + + /** + * returns the current y-scale factor + */ + public float getScaleY() { + if (mViewPortHandler == null) + return 1f; + else + return mViewPortHandler.getScaleY(); + } + + /** + * if the chart is fully zoomed out, return true + * + * @return + */ + public boolean isFullyZoomedOut() { + return mViewPortHandler.isFullyZoomedOut(); + } + + /** + * Returns the left y-axis object. In the horizontal bar-chart, this is the + * top axis. + * + * @return + */ + public YAxis getAxisLeft() { + return mAxisLeft; + } + + /** + * Returns the right y-axis object. In the horizontal bar-chart, this is the + * bottom axis. + * + * @return + */ + public YAxis getAxisRight() { + return mAxisRight; + } + + /** + * Returns the y-axis object to the corresponding AxisDependency. In the + * horizontal bar-chart, LEFT == top, RIGHT == BOTTOM + * + * @param axis + * @return + */ + public YAxis getAxis(AxisDependency axis) { + if (axis == AxisDependency.LEFT) + return mAxisLeft; + else + return mAxisRight; + } + + @Override + public boolean isInverted(AxisDependency axis) { + return getAxis(axis).isInverted(); + } + + /** + * If set to true, both x and y axis can be scaled simultaneously with 2 fingers, if false, + * x and y axis can be scaled separately. default: false + * + * @param enabled + */ + public void setPinchZoom(boolean enabled) { + mPinchZoomEnabled = enabled; + } + + /** + * returns true if pinch-zoom is enabled, false if not + * + * @return + */ + public boolean isPinchZoomEnabled() { + return mPinchZoomEnabled; + } + + /** + * Set an offset in dp that allows the user to drag the chart over it's + * bounds on the x-axis. + * + * @param offset + */ + public void setDragOffsetX(float offset) { + mViewPortHandler.setDragOffsetX(offset); + } + + /** + * Set an offset in dp that allows the user to drag the chart over it's + * bounds on the y-axis. + * + * @param offset + */ + public void setDragOffsetY(float offset) { + mViewPortHandler.setDragOffsetY(offset); + } + + /** + * Returns true if both drag offsets (x and y) are zero or smaller. + * + * @return + */ + public boolean hasNoDragOffset() { + return mViewPortHandler.hasNoDragOffset(); + } + + public XAxisRenderer getRendererXAxis() { + return mXAxisRenderer; + } + + /** + * Sets a custom XAxisRenderer and overrides the existing (default) one. + * + * @param xAxisRenderer + */ + public void setXAxisRenderer(XAxisRenderer xAxisRenderer) { + mXAxisRenderer = xAxisRenderer; + } + + public YAxisRenderer getRendererLeftYAxis() { + return mAxisRendererLeft; + } + + /** + * Sets a custom axis renderer for the left axis and overwrites the existing one. + * + * @param rendererLeftYAxis + */ + public void setRendererLeftYAxis(YAxisRenderer rendererLeftYAxis) { + mAxisRendererLeft = rendererLeftYAxis; + } + + public YAxisRenderer getRendererRightYAxis() { + return mAxisRendererRight; + } + + /** + * Sets a custom axis renderer for the right acis and overwrites the existing one. + * + * @param rendererRightYAxis + */ + public void setRendererRightYAxis(YAxisRenderer rendererRightYAxis) { + mAxisRendererRight = rendererRightYAxis; + } + + @Override + public float getYChartMax() { + return Math.max(mAxisLeft.mAxisMaximum, mAxisRight.mAxisMaximum); + } + + @Override + public float getYChartMin() { + return Math.min(mAxisLeft.mAxisMinimum, mAxisRight.mAxisMinimum); + } + + /** + * Returns true if either the left or the right or both axes are inverted. + * + * @return + */ + public boolean isAnyAxisInverted() { + if (mAxisLeft.isInverted()) + return true; + if (mAxisRight.isInverted()) + return true; + return false; + } + + /** + * Flag that indicates if auto scaling on the y axis is enabled. This is + * especially interesting for charts displaying financial data. + * + * @param enabled the y axis automatically adjusts to the min and max y + * values of the current x axis range whenever the viewport + * changes + */ + public void setAutoScaleMinMaxEnabled(boolean enabled) { + mAutoScaleMinMaxEnabled = enabled; + } + + /** + * @return true if auto scaling on the y axis is enabled. + * @default false + */ + public boolean isAutoScaleMinMaxEnabled() { + return mAutoScaleMinMaxEnabled; + } + + @Override + public void setPaint(Paint p, int which) { + super.setPaint(p, which); + + switch (which) { + case PAINT_GRID_BACKGROUND: + mGridBackgroundPaint = p; + break; + } + } + + @Override + public Paint getPaint(int which) { + Paint p = super.getPaint(which); + if (p != null) + return p; + + switch (which) { + case PAINT_GRID_BACKGROUND: + return mGridBackgroundPaint; + } + + return null; + } + + protected float[] mOnSizeChangedBuffer = new float[2]; + + @Override + protected void onSizeChanged(int w, int h, int oldw, int oldh) { + + // Saving current position of chart. + mOnSizeChangedBuffer[0] = mOnSizeChangedBuffer[1] = 0; + + if (mKeepPositionOnRotation) { + mOnSizeChangedBuffer[0] = mViewPortHandler.contentLeft(); + mOnSizeChangedBuffer[1] = mViewPortHandler.contentTop(); + getTransformer(AxisDependency.LEFT).pixelsToValue(mOnSizeChangedBuffer); + } + + //Superclass transforms chart. + super.onSizeChanged(w, h, oldw, oldh); + + if (mKeepPositionOnRotation) { + + //Restoring old position of chart. + getTransformer(AxisDependency.LEFT).pointValuesToPixel(mOnSizeChangedBuffer); + mViewPortHandler.centerViewPort(mOnSizeChangedBuffer, this); + } else { + mViewPortHandler.refresh(mViewPortHandler.getMatrixTouch(), this, true); + } + } +} diff --git a/MPChartLib/src/main/java/com/github/mikephil/charting/charts/BubbleChart.java b/MPChartLib/src/main/java/com/github/mikephil/charting/charts/BubbleChart.java new file mode 100644 index 00000000..23dac578 --- /dev/null +++ b/MPChartLib/src/main/java/com/github/mikephil/charting/charts/BubbleChart.java @@ -0,0 +1,43 @@ + +package com.github.mikephil.charting.charts; + +import android.content.Context; +import android.util.AttributeSet; + +import com.github.mikephil.charting.data.BubbleData; +import com.github.mikephil.charting.interfaces.dataprovider.BubbleDataProvider; +import com.github.mikephil.charting.renderer.BubbleChartRenderer; + +/** + * The BubbleChart. Draws bubbles. Bubble chart implementation: Copyright 2015 + * Pierre-Marc Airoldi Licensed under Apache License 2.0. In the BubbleChart, it + * is the area of the bubble, not the radius or diameter of the bubble that + * conveys the data. + * + * @author Philipp Jahoda + */ +public class BubbleChart extends BarLineChartBase<BubbleData> implements BubbleDataProvider { + + public BubbleChart(Context context) { + super(context); + } + + public BubbleChart(Context context, AttributeSet attrs) { + super(context, attrs); + } + + public BubbleChart(Context context, AttributeSet attrs, int defStyle) { + super(context, attrs, defStyle); + } + + @Override + protected void init() { + super.init(); + + mRenderer = new BubbleChartRenderer(this, mAnimator, mViewPortHandler); + } + + public BubbleData getBubbleData() { + return mData; + } +} diff --git a/MPChartLib/src/main/java/com/github/mikephil/charting/charts/CandleStickChart.java b/MPChartLib/src/main/java/com/github/mikephil/charting/charts/CandleStickChart.java new file mode 100644 index 00000000..fa36e352 --- /dev/null +++ b/MPChartLib/src/main/java/com/github/mikephil/charting/charts/CandleStickChart.java @@ -0,0 +1,44 @@ + +package com.github.mikephil.charting.charts; + +import android.content.Context; +import android.util.AttributeSet; + +import com.github.mikephil.charting.data.CandleData; +import com.github.mikephil.charting.interfaces.dataprovider.CandleDataProvider; +import com.github.mikephil.charting.renderer.CandleStickChartRenderer; + +/** + * Financial chart type that draws candle-sticks (OHCL chart). + * + * @author Philipp Jahoda + */ +public class CandleStickChart extends BarLineChartBase<CandleData> implements CandleDataProvider { + + public CandleStickChart(Context context) { + super(context); + } + + public CandleStickChart(Context context, AttributeSet attrs) { + super(context, attrs); + } + + public CandleStickChart(Context context, AttributeSet attrs, int defStyle) { + super(context, attrs, defStyle); + } + + @Override + protected void init() { + super.init(); + + mRenderer = new CandleStickChartRenderer(this, mAnimator, mViewPortHandler); + + getXAxis().setSpaceMin(0.5f); + getXAxis().setSpaceMax(0.5f); + } + + @Override + public CandleData getCandleData() { + return mData; + } +} diff --git a/MPChartLib/src/main/java/com/github/mikephil/charting/charts/Chart.java b/MPChartLib/src/main/java/com/github/mikephil/charting/charts/Chart.java new file mode 100644 index 00000000..5cf49ea9 --- /dev/null +++ b/MPChartLib/src/main/java/com/github/mikephil/charting/charts/Chart.java @@ -0,0 +1,1822 @@ + +package com.github.mikephil.charting.charts; + +import android.animation.ValueAnimator; +import android.animation.ValueAnimator.AnimatorUpdateListener; +import android.content.ContentValues; +import android.content.Context; +import android.graphics.Bitmap; +import android.graphics.Bitmap.CompressFormat; +import android.graphics.Canvas; +import android.graphics.Color; +import android.graphics.Paint; +import android.graphics.Paint.Align; +import android.graphics.RectF; +import android.graphics.Typeface; +import android.graphics.drawable.Drawable; +import android.os.Build; +import android.os.Environment; +import android.provider.MediaStore.Images; +import androidx.annotation.RequiresApi; +import android.text.TextUtils; +import android.util.AttributeSet; +import android.util.Log; +import android.view.View; +import android.view.ViewGroup; +import android.view.ViewParent; + +import com.github.mikephil.charting.animation.ChartAnimator; +import com.github.mikephil.charting.animation.Easing; +import com.github.mikephil.charting.animation.Easing.EasingFunction; +import com.github.mikephil.charting.components.Description; +import com.github.mikephil.charting.components.IMarker; +import com.github.mikephil.charting.components.Legend; +import com.github.mikephil.charting.components.XAxis; +import com.github.mikephil.charting.data.ChartData; +import com.github.mikephil.charting.data.Entry; +import com.github.mikephil.charting.formatter.DefaultValueFormatter; +import com.github.mikephil.charting.formatter.IValueFormatter; +import com.github.mikephil.charting.highlight.ChartHighlighter; +import com.github.mikephil.charting.highlight.Highlight; +import com.github.mikephil.charting.highlight.IHighlighter; +import com.github.mikephil.charting.interfaces.dataprovider.ChartInterface; +import com.github.mikephil.charting.interfaces.datasets.IDataSet; +import com.github.mikephil.charting.listener.ChartTouchListener; +import com.github.mikephil.charting.listener.OnChartGestureListener; +import com.github.mikephil.charting.listener.OnChartValueSelectedListener; +import com.github.mikephil.charting.renderer.DataRenderer; +import com.github.mikephil.charting.renderer.LegendRenderer; +import com.github.mikephil.charting.utils.MPPointF; +import com.github.mikephil.charting.utils.Utils; +import com.github.mikephil.charting.utils.ViewPortHandler; + +import java.io.File; +import java.io.FileOutputStream; +import java.io.IOException; +import java.io.OutputStream; +import java.util.ArrayList; + +/** + * Baseclass of all Chart-Views. + * + * @author Philipp Jahoda + */ +public abstract class Chart<T extends ChartData<? extends IDataSet<? extends Entry>>> extends + ViewGroup + implements ChartInterface { + + public static final String LOG_TAG = "MPAndroidChart"; + + /** + * flag that indicates if logging is enabled or not + */ + protected boolean mLogEnabled = false; + + /** + * object that holds all data that was originally set for the chart, before + * it was modified or any filtering algorithms had been applied + */ + protected T mData = null; + + /** + * Flag that indicates if highlighting per tap (touch) is enabled + */ + protected boolean mHighLightPerTapEnabled = true; + + /** + * If set to true, chart continues to scroll after touch up + */ + private boolean mDragDecelerationEnabled = true; + + /** + * Deceleration friction coefficient in [0 ; 1] interval, higher values + * indicate that speed will decrease slowly, for example if it set to 0, it + * will stop immediately. 1 is an invalid value, and will be converted to + * 0.999f automatically. + */ + private float mDragDecelerationFrictionCoef = 0.9f; + + /** + * default value-formatter, number of digits depends on provided chart-data + */ + protected DefaultValueFormatter mDefaultValueFormatter = new DefaultValueFormatter(0); + + /** + * paint object used for drawing the description text in the bottom right + * corner of the chart + */ + protected Paint mDescPaint; + + /** + * paint object for drawing the information text when there are no values in + * the chart + */ + protected Paint mInfoPaint; + + /** + * the object representing the labels on the x-axis + */ + protected XAxis mXAxis; + + /** + * if true, touch gestures are enabled on the chart + */ + protected boolean mTouchEnabled = true; + + /** + * the object responsible for representing the description text + */ + protected Description mDescription; + + /** + * the legend object containing all data associated with the legend + */ + protected Legend mLegend; + + /** + * listener that is called when a value on the chart is selected + */ + protected OnChartValueSelectedListener mSelectionListener; + + protected ChartTouchListener mChartTouchListener; + + /** + * text that is displayed when the chart is empty + */ + private String mNoDataText = "No chart data available."; + + /** + * Gesture listener for custom callbacks when making gestures on the chart. + */ + private OnChartGestureListener mGestureListener; + + protected LegendRenderer mLegendRenderer; + + /** + * object responsible for rendering the data + */ + protected DataRenderer mRenderer; + + protected IHighlighter mHighlighter; + + /** + * object that manages the bounds and drawing constraints of the chart + */ + protected ViewPortHandler mViewPortHandler = new ViewPortHandler(); + + /** + * object responsible for animations + */ + protected ChartAnimator mAnimator; + + /** + * Extra offsets to be appended to the viewport + */ + private float mExtraTopOffset = 0.f, + mExtraRightOffset = 0.f, + mExtraBottomOffset = 0.f, + mExtraLeftOffset = 0.f; + + /** + * default constructor for initialization in code + */ + public Chart(Context context) { + super(context); + init(); + } + + /** + * constructor for initialization in xml + */ + public Chart(Context context, AttributeSet attrs) { + super(context, attrs); + init(); + } + + /** + * even more awesome constructor + */ + public Chart(Context context, AttributeSet attrs, int defStyle) { + super(context, attrs, defStyle); + init(); + } + + /** + * initialize all paints and stuff + */ + protected void init() { + + setWillNotDraw(false); + // setLayerType(View.LAYER_TYPE_HARDWARE, null); + + mAnimator = new ChartAnimator(new AnimatorUpdateListener() { + + @Override + public void onAnimationUpdate(ValueAnimator animation) { + // ViewCompat.postInvalidateOnAnimation(Chart.this); + postInvalidate(); + } + }); + + // initialize the utils + Utils.init(getContext()); + mMaxHighlightDistance = Utils.convertDpToPixel(500f); + + mDescription = new Description(); + mLegend = new Legend(); + + mLegendRenderer = new LegendRenderer(mViewPortHandler, mLegend); + + mXAxis = new XAxis(); + + mDescPaint = new Paint(Paint.ANTI_ALIAS_FLAG); + + mInfoPaint = new Paint(Paint.ANTI_ALIAS_FLAG); + mInfoPaint.setColor(Color.rgb(247, 189, 51)); // orange + mInfoPaint.setTextAlign(Align.CENTER); + mInfoPaint.setTextSize(Utils.convertDpToPixel(12f)); + + if (mLogEnabled) + Log.i("", "Chart.init()"); + } + + // public void initWithDummyData() { + // ColorTemplate template = new ColorTemplate(); + // template.addColorsForDataSets(ColorTemplate.COLORFUL_COLORS, + // getContext()); + // + // setColorTemplate(template); + // setDrawYValues(false); + // + // ArrayList<String> xVals = new ArrayList<String>(); + // Calendar calendar = Calendar.getInstance(); + // for (int i = 0; i < 12; i++) { + // xVals.add(calendar.getDisplayName(Calendar.MONTH, Calendar.SHORT, + // Locale.getDefault())); + // } + // + // ArrayList<DataSet> dataSets = new ArrayList<DataSet>(); + // for (int i = 0; i < 3; i++) { + // + // ArrayList<Entry> yVals = new ArrayList<Entry>(); + // + // for (int j = 0; j < 12; j++) { + // float val = (float) (Math.random() * 100); + // yVals.add(new Entry(val, j)); + // } + // + // DataSet set = new DataSet(yVals, "DataSet " + i); + // dataSets.add(set); // add the datasets + // } + // // create a data object with the datasets + // ChartData data = new ChartData(xVals, dataSets); + // setData(data); + // invalidate(); + // } + + /** + * Sets a new data object for the chart. The data object contains all values + * and information needed for displaying. + * + * @param data + */ + public void setData(T data) { + + mData = data; + mOffsetsCalculated = false; + + if (data == null) { + return; + } + + // calculate how many digits are needed + setupDefaultFormatter(data.getYMin(), data.getYMax()); + + for (IDataSet set : mData.getDataSets()) { + if (set.needsFormatter() || set.getValueFormatter() == mDefaultValueFormatter) + set.setValueFormatter(mDefaultValueFormatter); + } + + // let the chart know there is new data + notifyDataSetChanged(); + + if (mLogEnabled) + Log.i(LOG_TAG, "Data is set."); + } + + /** + * Clears the chart from all data (sets it to null) and refreshes it (by + * calling invalidate()). + */ + public void clear() { + mData = null; + mOffsetsCalculated = false; + mIndicesToHighlight = null; + mChartTouchListener.setLastHighlighted(null); + invalidate(); + } + + /** + * Removes all DataSets (and thereby Entries) from the chart. Does not set the data object to null. Also refreshes the + * chart by calling invalidate(). + */ + public void clearValues() { + mData.clearValues(); + invalidate(); + } + + /** + * Returns true if the chart is empty (meaning it's data object is either + * null or contains no entries). + * + * @return + */ + public boolean isEmpty() { + + if (mData == null) + return true; + else { + + if (mData.getEntryCount() <= 0) + return true; + else + return false; + } + } + + /** + * Lets the chart know its underlying data has changed and performs all + * necessary recalculations. It is crucial that this method is called + * everytime data is changed dynamically. Not calling this method can lead + * to crashes or unexpected behaviour. + */ + public abstract void notifyDataSetChanged(); + + /** + * Calculates the offsets of the chart to the border depending on the + * position of an eventual legend or depending on the length of the y-axis + * and x-axis labels and their position + */ + protected abstract void calculateOffsets(); + + /** + * Calculates the y-min and y-max value and the y-delta and x-delta value + */ + protected abstract void calcMinMax(); + + /** + * Calculates the required number of digits for the values that might be + * drawn in the chart (if enabled), and creates the default-value-formatter + */ + protected void setupDefaultFormatter(float min, float max) { + + float reference = 0f; + + if (mData == null || mData.getEntryCount() < 2) { + + reference = Math.max(Math.abs(min), Math.abs(max)); + } else { + reference = Math.abs(max - min); + } + + int digits = Utils.getDecimals(reference); + + // setup the formatter with a new number of digits + mDefaultValueFormatter.setup(digits); + } + + /** + * flag that indicates if offsets calculation has already been done or not + */ + private boolean mOffsetsCalculated = false; + + @Override + protected void onDraw(Canvas canvas) { + // super.onDraw(canvas); + + if (mData == null) { + + boolean hasText = !TextUtils.isEmpty(mNoDataText); + + if (hasText) { + MPPointF pt = getCenter(); + + switch (mInfoPaint.getTextAlign()) { + case LEFT: + pt.x = 0; + canvas.drawText(mNoDataText, pt.x, pt.y, mInfoPaint); + break; + + case RIGHT: + pt.x *= 2.0; + canvas.drawText(mNoDataText, pt.x, pt.y, mInfoPaint); + break; + + default: + canvas.drawText(mNoDataText, pt.x, pt.y, mInfoPaint); + break; + } + } + + return; + } + + if (!mOffsetsCalculated) { + + calculateOffsets(); + mOffsetsCalculated = true; + } + } + + /** + * Draws the description text in the bottom right corner of the chart (per default) + */ + protected void drawDescription(Canvas c) { + + // check if description should be drawn + if (mDescription != null && mDescription.isEnabled()) { + + MPPointF position = mDescription.getPosition(); + + mDescPaint.setTypeface(mDescription.getTypeface()); + mDescPaint.setTextSize(mDescription.getTextSize()); + mDescPaint.setColor(mDescription.getTextColor()); + mDescPaint.setTextAlign(mDescription.getTextAlign()); + + float x, y; + + // if no position specified, draw on default position + if (position == null) { + x = getWidth() - mViewPortHandler.offsetRight() - mDescription.getXOffset(); + y = getHeight() - mViewPortHandler.offsetBottom() - mDescription.getYOffset(); + } else { + x = position.x; + y = position.y; + } + + c.drawText(mDescription.getText(), x, y, mDescPaint); + } + } + + /** + * ################ ################ ################ ################ + */ + /** BELOW THIS CODE FOR HIGHLIGHTING */ + + /** + * array of Highlight objects that reference the highlighted slices in the + * chart + */ + protected Highlight[] mIndicesToHighlight; + + /** + * The maximum distance in dp away from an entry causing it to highlight. + */ + protected float mMaxHighlightDistance = 0f; + + @Override + public float getMaxHighlightDistance() { + return mMaxHighlightDistance; + } + + /** + * Sets the maximum distance in screen dp a touch can be away from an entry to cause it to get highlighted. + * Default: 500dp + * + * @param distDp + */ + public void setMaxHighlightDistance(float distDp) { + mMaxHighlightDistance = Utils.convertDpToPixel(distDp); + } + + /** + * Returns the array of currently highlighted values. This might a null or + * empty array if nothing is highlighted. + * + * @return + */ + public Highlight[] getHighlighted() { + return mIndicesToHighlight; + } + + /** + * Returns true if values can be highlighted via tap gesture, false if not. + * + * @return + */ + public boolean isHighlightPerTapEnabled() { + return mHighLightPerTapEnabled; + } + + /** + * Set this to false to prevent values from being highlighted by tap gesture. + * Values can still be highlighted via drag or programmatically. Default: true + * + * @param enabled + */ + public void setHighlightPerTapEnabled(boolean enabled) { + mHighLightPerTapEnabled = enabled; + } + + /** + * Returns true if there are values to highlight, false if there are no + * values to highlight. Checks if the highlight array is null, has a length + * of zero or if the first object is null. + * + * @return + */ + public boolean valuesToHighlight() { + return mIndicesToHighlight == null || mIndicesToHighlight.length <= 0 + || mIndicesToHighlight[0] == null ? false + : true; + } + + /** + * Sets the last highlighted value for the touchlistener. + * + * @param highs + */ + protected void setLastHighlighted(Highlight[] highs) { + + if (highs == null || highs.length <= 0 || highs[0] == null) { + mChartTouchListener.setLastHighlighted(null); + } else { + mChartTouchListener.setLastHighlighted(highs[0]); + } + } + + /** + * Highlights the values at the given indices in the given DataSets. Provide + * null or an empty array to undo all highlighting. This should be used to + * programmatically highlight values. + * This method *will not* call the listener. + * + * @param highs + */ + public void highlightValues(Highlight[] highs) { + + // set the indices to highlight + mIndicesToHighlight = highs; + + setLastHighlighted(highs); + + // redraw the chart + invalidate(); + } + + /** + * Highlights any y-value at the given x-value in the given DataSet. + * Provide -1 as the dataSetIndex to undo all highlighting. + * This method will call the listener. + * @param x The x-value to highlight + * @param dataSetIndex The dataset index to search in + * @param dataIndex The data index to search in (only used in CombinedChartView currently) + */ + public void highlightValue(float x, int dataSetIndex, int dataIndex) { + highlightValue(x, dataSetIndex, dataIndex, true); + } + + /** + * Highlights any y-value at the given x-value in the given DataSet. + * Provide -1 as the dataSetIndex to undo all highlighting. + * This method will call the listener. + * @param x The x-value to highlight + * @param dataSetIndex The dataset index to search in + */ + public void highlightValue(float x, int dataSetIndex) { + highlightValue(x, dataSetIndex, -1, true); + } + + /** + * Highlights the value at the given x-value and y-value in the given DataSet. + * Provide -1 as the dataSetIndex to undo all highlighting. + * This method will call the listener. + * @param x The x-value to highlight + * @param y The y-value to highlight. Supply `NaN` for "any" + * @param dataSetIndex The dataset index to search in + * @param dataIndex The data index to search in (only used in CombinedChartView currently) + */ + public void highlightValue(float x, float y, int dataSetIndex, int dataIndex) { + highlightValue(x, y, dataSetIndex, dataIndex, true); + } + + /** + * Highlights the value at the given x-value and y-value in the given DataSet. + * Provide -1 as the dataSetIndex to undo all highlighting. + * This method will call the listener. + * @param x The x-value to highlight + * @param y The y-value to highlight. Supply `NaN` for "any" + * @param dataSetIndex The dataset index to search in + */ + public void highlightValue(float x, float y, int dataSetIndex) { + highlightValue(x, y, dataSetIndex, -1, true); + } + + /** + * Highlights any y-value at the given x-value in the given DataSet. + * Provide -1 as the dataSetIndex to undo all highlighting. + * @param x The x-value to highlight + * @param dataSetIndex The dataset index to search in + * @param dataIndex The data index to search in (only used in CombinedChartView currently) + * @param callListener Should the listener be called for this change + */ + public void highlightValue(float x, int dataSetIndex, int dataIndex, boolean callListener) { + highlightValue(x, Float.NaN, dataSetIndex, dataIndex, callListener); + } + + /** + * Highlights any y-value at the given x-value in the given DataSet. + * Provide -1 as the dataSetIndex to undo all highlighting. + * @param x The x-value to highlight + * @param dataSetIndex The dataset index to search in + * @param callListener Should the listener be called for this change + */ + public void highlightValue(float x, int dataSetIndex, boolean callListener) { + highlightValue(x, Float.NaN, dataSetIndex, -1, callListener); + } + + /** + * Highlights any y-value at the given x-value in the given DataSet. + * Provide -1 as the dataSetIndex to undo all highlighting. + * @param x The x-value to highlight + * @param y The y-value to highlight. Supply `NaN` for "any" + * @param dataSetIndex The dataset index to search in + * @param dataIndex The data index to search in (only used in CombinedChartView currently) + * @param callListener Should the listener be called for this change + */ + public void highlightValue(float x, float y, int dataSetIndex, int dataIndex, boolean callListener) { + + if (dataSetIndex < 0 || dataSetIndex >= mData.getDataSetCount()) { + highlightValue(null, callListener); + } else { + highlightValue(new Highlight(x, y, dataSetIndex, dataIndex), callListener); + } + } + + /** + * Highlights any y-value at the given x-value in the given DataSet. + * Provide -1 as the dataSetIndex to undo all highlighting. + * @param x The x-value to highlight + * @param y The y-value to highlight. Supply `NaN` for "any" + * @param dataSetIndex The dataset index to search in + * @param callListener Should the listener be called for this change + */ + public void highlightValue(float x, float y, int dataSetIndex, boolean callListener) { + highlightValue(x, y, dataSetIndex, -1, callListener); + } + + /** + * Highlights the values represented by the provided Highlight object + * This method *will not* call the listener. + * + * @param highlight contains information about which entry should be highlighted + */ + public void highlightValue(Highlight highlight) { + highlightValue(highlight, false); + } + + /** + * Highlights the value selected by touch gesture. Unlike + * highlightValues(...), this generates a callback to the + * OnChartValueSelectedListener. + * + * @param high - the highlight object + * @param callListener - call the listener + */ + public void highlightValue(Highlight high, boolean callListener) { + + Entry e = null; + + if (high == null) + mIndicesToHighlight = null; + else { + + if (mLogEnabled) + Log.i(LOG_TAG, "Highlighted: " + high.toString()); + + e = mData.getEntryForHighlight(high); + if (e == null) { + mIndicesToHighlight = null; + high = null; + } else { + + // set the indices to highlight + mIndicesToHighlight = new Highlight[]{ + high + }; + } + } + + setLastHighlighted(mIndicesToHighlight); + + if (callListener && mSelectionListener != null) { + + if (!valuesToHighlight()) + mSelectionListener.onNothingSelected(); + else { + // notify the listener + mSelectionListener.onValueSelected(e, high); + } + } + + // redraw the chart + invalidate(); + } + + /** + * Returns the Highlight object (contains x-index and DataSet index) of the + * selected value at the given touch point inside the Line-, Scatter-, or + * CandleStick-Chart. + * + * @param x + * @param y + * @return + */ + public Highlight getHighlightByTouchPoint(float x, float y) { + + if (mData == null) { + Log.e(LOG_TAG, "Can't select by touch. No data set."); + return null; + } else + return getHighlighter().getHighlight(x, y); + } + + /** + * Set a new (e.g. custom) ChartTouchListener NOTE: make sure to + * setTouchEnabled(true); if you need touch gestures on the chart + * + * @param l + */ + public void setOnTouchListener(ChartTouchListener l) { + this.mChartTouchListener = l; + } + + /** + * Returns an instance of the currently active touch listener. + * + * @return + */ + public ChartTouchListener getOnTouchListener() { + return mChartTouchListener; + } + + /** + * ################ ################ ################ ################ + */ + /** BELOW CODE IS FOR THE MARKER VIEW */ + + /** + * if set to true, the marker view is drawn when a value is clicked + */ + protected boolean mDrawMarkers = true; + + /** + * the view that represents the marker + */ + protected IMarker mMarker; + + /** + * draws all MarkerViews on the highlighted positions + */ + protected void drawMarkers(Canvas canvas) { + + // if there is no marker view or drawing marker is disabled + if (mMarker == null || !isDrawMarkersEnabled() || !valuesToHighlight()) + return; + + for (int i = 0; i < mIndicesToHighlight.length; i++) { + + Highlight highlight = mIndicesToHighlight[i]; + + IDataSet set = mData.getDataSetByIndex(highlight.getDataSetIndex()); + + Entry e = mData.getEntryForHighlight(mIndicesToHighlight[i]); + int entryIndex = set.getEntryIndex(e); + + // make sure entry not null + if (e == null || entryIndex > set.getEntryCount() * mAnimator.getPhaseX()) + continue; + + float[] pos = getMarkerPosition(highlight); + + // check bounds + if (!mViewPortHandler.isInBounds(pos[0], pos[1])) + continue; + + // callbacks to update the content + mMarker.refreshContent(e, highlight); + + // draw the marker + mMarker.draw(canvas, pos[0], pos[1]); + } + } + + /** + * Returns the actual position in pixels of the MarkerView for the given + * Highlight object. + * + * @param high + * @return + */ + protected float[] getMarkerPosition(Highlight high) { + return new float[]{high.getDrawX(), high.getDrawY()}; + } + + /** + * ################ ################ ################ ################ + * ANIMATIONS ONLY WORK FOR API LEVEL 11 (Android 3.0.x) AND HIGHER. + */ + /** CODE BELOW THIS RELATED TO ANIMATION */ + + /** + * Returns the animator responsible for animating chart values. + * + * @return + */ + public ChartAnimator getAnimator() { + return mAnimator; + } + + /** + * If set to true, chart continues to scroll after touch up default: true + */ + public boolean isDragDecelerationEnabled() { + return mDragDecelerationEnabled; + } + + /** + * If set to true, chart continues to scroll after touch up. Default: true. + * + * @param enabled + */ + public void setDragDecelerationEnabled(boolean enabled) { + mDragDecelerationEnabled = enabled; + } + + /** + * Returns drag deceleration friction coefficient + * + * @return + */ + public float getDragDecelerationFrictionCoef() { + return mDragDecelerationFrictionCoef; + } + + /** + * Deceleration friction coefficient in [0 ; 1] interval, higher values + * indicate that speed will decrease slowly, for example if it set to 0, it + * will stop immediately. 1 is an invalid value, and will be converted to + * 0.999f automatically. + * + * @param newValue + */ + public void setDragDecelerationFrictionCoef(float newValue) { + + if (newValue < 0.f) + newValue = 0.f; + + if (newValue >= 1f) + newValue = 0.999f; + + mDragDecelerationFrictionCoef = newValue; + } + + /** + * ################ ################ ################ ################ + * ANIMATIONS ONLY WORK FOR API LEVEL 11 (Android 3.0.x) AND HIGHER. + */ + /** CODE BELOW FOR PROVIDING EASING FUNCTIONS */ + + /** + * Animates the drawing / rendering of the chart on both x- and y-axis with + * the specified animation time. If animate(...) is called, no further + * calling of invalidate() is necessary to refresh the chart. ANIMATIONS + * ONLY WORK FOR API LEVEL 11 (Android 3.0.x) AND HIGHER. + * + * @param durationMillisX + * @param durationMillisY + * @param easingX a custom easing function to be used on the animation phase + * @param easingY a custom easing function to be used on the animation phase + */ + @RequiresApi(11) + public void animateXY(int durationMillisX, int durationMillisY, EasingFunction easingX, + EasingFunction easingY) { + mAnimator.animateXY(durationMillisX, durationMillisY, easingX, easingY); + } + + /** + * Animates the drawing / rendering of the chart on both x- and y-axis with + * the specified animation time. If animate(...) is called, no further + * calling of invalidate() is necessary to refresh the chart. ANIMATIONS + * ONLY WORK FOR API LEVEL 11 (Android 3.0.x) AND HIGHER. + * + * @param durationMillisX + * @param durationMillisY + * @param easing a custom easing function to be used on the animation phase + */ + @RequiresApi(11) + public void animateXY(int durationMillisX, int durationMillisY, EasingFunction easing) { + mAnimator.animateXY(durationMillisX, durationMillisY, easing); + } + + /** + * Animates the rendering of the chart on the x-axis with the specified + * animation time. If animate(...) is called, no further calling of + * invalidate() is necessary to refresh the chart. ANIMATIONS ONLY WORK FOR + * API LEVEL 11 (Android 3.0.x) AND HIGHER. + * + * @param durationMillis + * @param easing a custom easing function to be used on the animation phase + */ + @RequiresApi(11) + public void animateX(int durationMillis, EasingFunction easing) { + mAnimator.animateX(durationMillis, easing); + } + + /** + * Animates the rendering of the chart on the y-axis with the specified + * animation time. If animate(...) is called, no further calling of + * invalidate() is necessary to refresh the chart. ANIMATIONS ONLY WORK FOR + * API LEVEL 11 (Android 3.0.x) AND HIGHER. + * + * @param durationMillis + * @param easing a custom easing function to be used on the animation phase + */ + @RequiresApi(11) + public void animateY(int durationMillis, EasingFunction easing) { + mAnimator.animateY(durationMillis, easing); + } + + /** + * ################ ################ ################ ################ + * ANIMATIONS ONLY WORK FOR API LEVEL 11 (Android 3.0.x) AND HIGHER. + */ + /** CODE BELOW FOR PREDEFINED EASING OPTIONS */ + + /** + * ################ ################ ################ ################ + * ANIMATIONS ONLY WORK FOR API LEVEL 11 (Android 3.0.x) AND HIGHER. + */ + /** CODE BELOW FOR ANIMATIONS WITHOUT EASING */ + + /** + * Animates the rendering of the chart on the x-axis with the specified + * animation time. If animate(...) is called, no further calling of + * invalidate() is necessary to refresh the chart. ANIMATIONS ONLY WORK FOR + * API LEVEL 11 (Android 3.0.x) AND HIGHER. + * + * @param durationMillis + */ + @RequiresApi(11) + public void animateX(int durationMillis) { + mAnimator.animateX(durationMillis); + } + + /** + * Animates the rendering of the chart on the y-axis with the specified + * animation time. If animate(...) is called, no further calling of + * invalidate() is necessary to refresh the chart. ANIMATIONS ONLY WORK FOR + * API LEVEL 11 (Android 3.0.x) AND HIGHER. + * + * @param durationMillis + */ + @RequiresApi(11) + public void animateY(int durationMillis) { + mAnimator.animateY(durationMillis); + } + + /** + * Animates the drawing / rendering of the chart on both x- and y-axis with + * the specified animation time. If animate(...) is called, no further + * calling of invalidate() is necessary to refresh the chart. ANIMATIONS + * ONLY WORK FOR API LEVEL 11 (Android 3.0.x) AND HIGHER. + * + * @param durationMillisX + * @param durationMillisY + */ + @RequiresApi(11) + public void animateXY(int durationMillisX, int durationMillisY) { + mAnimator.animateXY(durationMillisX, durationMillisY); + } + + /** + * ################ ################ ################ ################ + */ + /** BELOW THIS ONLY GETTERS AND SETTERS */ + + + /** + * Returns the object representing all x-labels, this method can be used to + * acquire the XAxis object and modify it (e.g. change the position of the + * labels, styling, etc.) + * + * @return + */ + public XAxis getXAxis() { + return mXAxis; + } + + /** + * Returns the default IValueFormatter that has been determined by the chart + * considering the provided minimum and maximum values. + * + * @return + */ + public IValueFormatter getDefaultValueFormatter() { + return mDefaultValueFormatter; + } + + /** + * set a selection listener for the chart + * + * @param l + */ + public void setOnChartValueSelectedListener(OnChartValueSelectedListener l) { + this.mSelectionListener = l; + } + + /** + * Sets a gesture-listener for the chart for custom callbacks when executing + * gestures on the chart surface. + * + * @param l + */ + public void setOnChartGestureListener(OnChartGestureListener l) { + this.mGestureListener = l; + } + + /** + * Returns the custom gesture listener. + * + * @return + */ + public OnChartGestureListener getOnChartGestureListener() { + return mGestureListener; + } + + /** + * returns the current y-max value across all DataSets + * + * @return + */ + public float getYMax() { + return mData.getYMax(); + } + + /** + * returns the current y-min value across all DataSets + * + * @return + */ + public float getYMin() { + return mData.getYMin(); + } + + @Override + public float getXChartMax() { + return mXAxis.mAxisMaximum; + } + + @Override + public float getXChartMin() { + return mXAxis.mAxisMinimum; + } + + @Override + public float getXRange() { + return mXAxis.mAxisRange; + } + + /** + * Returns a recyclable MPPointF instance. + * Returns the center point of the chart (the whole View) in pixels. + * + * @return + */ + public MPPointF getCenter() { + return MPPointF.getInstance(getWidth() / 2f, getHeight() / 2f); + } + + /** + * Returns a recyclable MPPointF instance. + * Returns the center of the chart taking offsets under consideration. + * (returns the center of the content rectangle) + * + * @return + */ + @Override + public MPPointF getCenterOffsets() { + return mViewPortHandler.getContentCenter(); + } + + /** + * Sets extra offsets (around the chart view) to be appended to the + * auto-calculated offsets. + * + * @param left + * @param top + * @param right + * @param bottom + */ + public void setExtraOffsets(float left, float top, float right, float bottom) { + setExtraLeftOffset(left); + setExtraTopOffset(top); + setExtraRightOffset(right); + setExtraBottomOffset(bottom); + } + + /** + * Set an extra offset to be appended to the viewport's top + */ + public void setExtraTopOffset(float offset) { + mExtraTopOffset = Utils.convertDpToPixel(offset); + } + + /** + * @return the extra offset to be appended to the viewport's top + */ + public float getExtraTopOffset() { + return mExtraTopOffset; + } + + /** + * Set an extra offset to be appended to the viewport's right + */ + public void setExtraRightOffset(float offset) { + mExtraRightOffset = Utils.convertDpToPixel(offset); + } + + /** + * @return the extra offset to be appended to the viewport's right + */ + public float getExtraRightOffset() { + return mExtraRightOffset; + } + + /** + * Set an extra offset to be appended to the viewport's bottom + */ + public void setExtraBottomOffset(float offset) { + mExtraBottomOffset = Utils.convertDpToPixel(offset); + } + + /** + * @return the extra offset to be appended to the viewport's bottom + */ + public float getExtraBottomOffset() { + return mExtraBottomOffset; + } + + /** + * Set an extra offset to be appended to the viewport's left + */ + public void setExtraLeftOffset(float offset) { + mExtraLeftOffset = Utils.convertDpToPixel(offset); + } + + /** + * @return the extra offset to be appended to the viewport's left + */ + public float getExtraLeftOffset() { + return mExtraLeftOffset; + } + + /** + * Set this to true to enable logcat outputs for the chart. Beware that + * logcat output decreases rendering performance. Default: disabled. + * + * @param enabled + */ + public void setLogEnabled(boolean enabled) { + mLogEnabled = enabled; + } + + /** + * Returns true if log-output is enabled for the chart, fals if not. + * + * @return + */ + public boolean isLogEnabled() { + return mLogEnabled; + } + + /** + * Sets the text that informs the user that there is no data available with + * which to draw the chart. + * + * @param text + */ + public void setNoDataText(String text) { + mNoDataText = text; + } + + /** + * Sets the color of the no data text. + * + * @param color + */ + public void setNoDataTextColor(int color) { + mInfoPaint.setColor(color); + } + + /** + * Sets the typeface to be used for the no data text. + * + * @param tf + */ + public void setNoDataTextTypeface(Typeface tf) { + mInfoPaint.setTypeface(tf); + } + + /** + * alignment of the no data text + * + * @param align + */ + public void setNoDataTextAlignment(Align align) { + mInfoPaint.setTextAlign(align); + } + + /** + * Set this to false to disable all gestures and touches on the chart, + * default: true + * + * @param enabled + */ + public void setTouchEnabled(boolean enabled) { + this.mTouchEnabled = enabled; + } + + /** + * sets the marker that is displayed when a value is clicked on the chart + * + * @param marker + */ + public void setMarker(IMarker marker) { + mMarker = marker; + } + + /** + * returns the marker that is set as a marker view for the chart + * + * @return + */ + public IMarker getMarker() { + return mMarker; + } + + @Deprecated + public void setMarkerView(IMarker v) { + setMarker(v); + } + + @Deprecated + public IMarker getMarkerView() { + return getMarker(); + } + + /** + * Sets a new Description object for the chart. + * + * @param desc + */ + public void setDescription(Description desc) { + this.mDescription = desc; + } + + /** + * Returns the Description object of the chart that is responsible for holding all information related + * to the description text that is displayed in the bottom right corner of the chart (by default). + * + * @return + */ + public Description getDescription() { + return mDescription; + } + + /** + * Returns the Legend object of the chart. This method can be used to get an + * instance of the legend in order to customize the automatically generated + * Legend. + * + * @return + */ + public Legend getLegend() { + return mLegend; + } + + /** + * Returns the renderer object responsible for rendering / drawing the + * Legend. + * + * @return + */ + public LegendRenderer getLegendRenderer() { + return mLegendRenderer; + } + + /** + * Returns the rectangle that defines the borders of the chart-value surface + * (into which the actual values are drawn). + * + * @return + */ + @Override + public RectF getContentRect() { + return mViewPortHandler.getContentRect(); + } + + /** + * disables intercept touchevents + */ + public void disableScroll() { + ViewParent parent = getParent(); + if (parent != null) + parent.requestDisallowInterceptTouchEvent(true); + } + + /** + * enables intercept touchevents + */ + public void enableScroll() { + ViewParent parent = getParent(); + if (parent != null) + parent.requestDisallowInterceptTouchEvent(false); + } + + /** + * paint for the grid background (only line and barchart) + */ + public static final int PAINT_GRID_BACKGROUND = 4; + + /** + * paint for the info text that is displayed when there are no values in the + * chart + */ + public static final int PAINT_INFO = 7; + + /** + * paint for the description text in the bottom right corner + */ + public static final int PAINT_DESCRIPTION = 11; + + /** + * paint for the hole in the middle of the pie chart + */ + public static final int PAINT_HOLE = 13; + + /** + * paint for the text in the middle of the pie chart + */ + public static final int PAINT_CENTER_TEXT = 14; + + /** + * paint used for the legend + */ + public static final int PAINT_LEGEND_LABEL = 18; + + /** + * set a new paint object for the specified parameter in the chart e.g. + * Chart.PAINT_VALUES + * + * @param p the new paint object + * @param which Chart.PAINT_VALUES, Chart.PAINT_GRID, Chart.PAINT_VALUES, + * ... + */ + public void setPaint(Paint p, int which) { + + switch (which) { + case PAINT_INFO: + mInfoPaint = p; + break; + case PAINT_DESCRIPTION: + mDescPaint = p; + break; + } + } + + /** + * Returns the paint object associated with the provided constant. + * + * @param which e.g. Chart.PAINT_LEGEND_LABEL + * @return + */ + public Paint getPaint(int which) { + switch (which) { + case PAINT_INFO: + return mInfoPaint; + case PAINT_DESCRIPTION: + return mDescPaint; + } + + return null; + } + + @Deprecated + public boolean isDrawMarkerViewsEnabled() { + return isDrawMarkersEnabled(); + } + + @Deprecated + public void setDrawMarkerViews(boolean enabled) { + setDrawMarkers(enabled); + } + + /** + * returns true if drawing the marker is enabled when tapping on values + * (use the setMarker(IMarker marker) method to specify a marker) + * + * @return + */ + public boolean isDrawMarkersEnabled() { + return mDrawMarkers; + } + + /** + * Set this to true to draw a user specified marker when tapping on + * chart values (use the setMarker(IMarker marker) method to specify a + * marker). Default: true + * + * @param enabled + */ + public void setDrawMarkers(boolean enabled) { + mDrawMarkers = enabled; + } + + /** + * Returns the ChartData object that has been set for the chart. + * + * @return + */ + public T getData() { + return mData; + } + + /** + * Returns the ViewPortHandler of the chart that is responsible for the + * content area of the chart and its offsets and dimensions. + * + * @return + */ + public ViewPortHandler getViewPortHandler() { + return mViewPortHandler; + } + + /** + * Returns the Renderer object the chart uses for drawing data. + * + * @return + */ + public DataRenderer getRenderer() { + return mRenderer; + } + + /** + * Sets a new DataRenderer object for the chart. + * + * @param renderer + */ + public void setRenderer(DataRenderer renderer) { + + if (renderer != null) + mRenderer = renderer; + } + + public IHighlighter getHighlighter() { + return mHighlighter; + } + + /** + * Sets a custom highligher object for the chart that handles / processes + * all highlight touch events performed on the chart-view. + * + * @param highlighter + */ + public void setHighlighter(ChartHighlighter highlighter) { + mHighlighter = highlighter; + } + + /** + * Returns a recyclable MPPointF instance. + * + * @return + */ + @Override + public MPPointF getCenterOfView() { + return getCenter(); + } + + /** + * Returns the bitmap that represents the chart. + * + * @return + */ + public Bitmap getChartBitmap() { + // Define a bitmap with the same size as the view + Bitmap returnedBitmap = Bitmap.createBitmap(getWidth(), getHeight(), Bitmap.Config.RGB_565); + // Bind a canvas to it + Canvas canvas = new Canvas(returnedBitmap); + // Get the view's background + Drawable bgDrawable = getBackground(); + if (bgDrawable != null) + // has background drawable, then draw it on the canvas + bgDrawable.draw(canvas); + else + // does not have background drawable, then draw white background on + // the canvas + canvas.drawColor(Color.WHITE); + // draw the view on the canvas + draw(canvas); + // return the bitmap + return returnedBitmap; + } + + /** + * Saves the current chart state with the given name to the given path on + * the sdcard leaving the path empty "" will put the saved file directly on + * the SD card chart is saved as a PNG image, example: + * saveToPath("myfilename", "foldername1/foldername2"); + * + * @param title + * @param pathOnSD e.g. "folder1/folder2/folder3" + * @return returns true on success, false on error + */ + public boolean saveToPath(String title, String pathOnSD) { + + + + Bitmap b = getChartBitmap(); + + OutputStream stream = null; + try { + stream = new FileOutputStream(Environment.getExternalStorageDirectory().getPath() + + pathOnSD + "/" + title + + ".png"); + + /* + * Write bitmap to file using JPEG or PNG and 40% quality hint for + * JPEG. + */ + b.compress(CompressFormat.PNG, 40, stream); + + stream.close(); + } catch (Exception e) { + e.printStackTrace(); + return false; + } + + return true; + } + + /** + * Saves the current state of the chart to the gallery as an image type. The + * compression must be set for JPEG only. 0 == maximum compression, 100 = low + * compression (high quality). NOTE: Needs permission WRITE_EXTERNAL_STORAGE + * + * @param fileName e.g. "my_image" + * @param subFolderPath e.g. "ChartPics" + * @param fileDescription e.g. "Chart details" + * @param format e.g. Bitmap.CompressFormat.PNG + * @param quality e.g. 50, min = 0, max = 100 + * @return returns true if saving was successful, false if not + */ + public boolean saveToGallery(String fileName, String subFolderPath, String fileDescription, Bitmap.CompressFormat + format, int quality) { + // restrain quality + if (quality < 0 || quality > 100) + quality = 50; + + long currentTime = System.currentTimeMillis(); + + File extBaseDir = Environment.getExternalStorageDirectory(); + File file = new File(extBaseDir.getAbsolutePath() + "/DCIM/" + subFolderPath); + if (!file.exists()) { + if (!file.mkdirs()) { + return false; + } + } + + String mimeType = ""; + switch (format) { + case PNG: + mimeType = "image/png"; + if (!fileName.endsWith(".png")) + fileName += ".png"; + break; + case WEBP: + mimeType = "image/webp"; + if (!fileName.endsWith(".webp")) + fileName += ".webp"; + break; + case JPEG: + default: + mimeType = "image/jpeg"; + if (!(fileName.endsWith(".jpg") || fileName.endsWith(".jpeg"))) + fileName += ".jpg"; + break; + } + + String filePath = file.getAbsolutePath() + "/" + fileName; + FileOutputStream out = null; + try { + out = new FileOutputStream(filePath); + + Bitmap b = getChartBitmap(); + b.compress(format, quality, out); + + out.flush(); + out.close(); + + } catch (IOException e) { + e.printStackTrace(); + + return false; + } + + long size = new File(filePath).length(); + + ContentValues values = new ContentValues(8); + + // store the details + values.put(Images.Media.TITLE, fileName); + values.put(Images.Media.DISPLAY_NAME, fileName); + values.put(Images.Media.DATE_ADDED, currentTime); + values.put(Images.Media.MIME_TYPE, mimeType); + values.put(Images.Media.DESCRIPTION, fileDescription); + values.put(Images.Media.ORIENTATION, 0); + values.put(Images.Media.DATA, filePath); + values.put(Images.Media.SIZE, size); + + return getContext().getContentResolver().insert(Images.Media.EXTERNAL_CONTENT_URI, values) != null; + } + + /** + * Saves the current state of the chart to the gallery as a JPEG image. The + * filename and compression can be set. 0 == maximum compression, 100 = low + * compression (high quality). NOTE: Needs permission WRITE_EXTERNAL_STORAGE + * + * @param fileName e.g. "my_image" + * @param quality e.g. 50, min = 0, max = 100 + * @return returns true if saving was successful, false if not + */ + public boolean saveToGallery(String fileName, int quality) { + return saveToGallery(fileName, "", "MPAndroidChart-Library Save", Bitmap.CompressFormat.PNG, quality); + } + + /** + * Saves the current state of the chart to the gallery as a PNG image. + * NOTE: Needs permission WRITE_EXTERNAL_STORAGE + * + * @param fileName e.g. "my_image" + * @return returns true if saving was successful, false if not + */ + public boolean saveToGallery(String fileName) { + return saveToGallery(fileName, "", "MPAndroidChart-Library Save", Bitmap.CompressFormat.PNG, 40); + } + + /** + * tasks to be done after the view is setup + */ + protected ArrayList<Runnable> mJobs = new ArrayList<Runnable>(); + + public void removeViewportJob(Runnable job) { + mJobs.remove(job); + } + + public void clearAllViewportJobs() { + mJobs.clear(); + } + + /** + * Either posts a job immediately if the chart has already setup it's + * dimensions or adds the job to the execution queue. + * + * @param job + */ + public void addViewportJob(Runnable job) { + + if (mViewPortHandler.hasChartDimens()) { + post(job); + } else { + mJobs.add(job); + } + } + + /** + * Returns all jobs that are scheduled to be executed after + * onSizeChanged(...). + * + * @return + */ + public ArrayList<Runnable> getJobs() { + return mJobs; + } + + @Override + protected void onLayout(boolean changed, int left, int top, int right, int bottom) { + + for (int i = 0; i < getChildCount(); i++) { + getChildAt(i).layout(left, top, right, bottom); + } + } + + @Override + protected void onMeasure(int widthMeasureSpec, int heightMeasureSpec) { + super.onMeasure(widthMeasureSpec, heightMeasureSpec); + int size = (int) Utils.convertDpToPixel(50f); + setMeasuredDimension( + Math.max(getSuggestedMinimumWidth(), + resolveSize(size, + widthMeasureSpec)), + Math.max(getSuggestedMinimumHeight(), + resolveSize(size, + heightMeasureSpec))); + } + + @Override + protected void onSizeChanged(int w, int h, int oldw, int oldh) { + if (mLogEnabled) + Log.i(LOG_TAG, "OnSizeChanged()"); + + if (w > 0 && h > 0 && w < 10000 && h < 10000) { + if (mLogEnabled) + Log.i(LOG_TAG, "Setting chart dimens, width: " + w + ", height: " + h); + mViewPortHandler.setChartDimens(w, h); + } else { + if (mLogEnabled) + Log.w(LOG_TAG, "*Avoiding* setting chart dimens! width: " + w + ", height: " + h); + } + + // This may cause the chart view to mutate properties affecting the view port -- + // lets do this before we try to run any pending jobs on the view port itself + notifyDataSetChanged(); + + for (Runnable r : mJobs) { + post(r); + } + + mJobs.clear(); + + super.onSizeChanged(w, h, oldw, oldh); + } + + /** + * Setting this to true will set the layer-type HARDWARE for the view, false + * will set layer-type SOFTWARE. + * + * @param enabled + */ + public void setHardwareAccelerationEnabled(boolean enabled) { + + if (enabled) + setLayerType(View.LAYER_TYPE_HARDWARE, null); + else + setLayerType(View.LAYER_TYPE_SOFTWARE, null); + } + + @Override + protected void onDetachedFromWindow() { + super.onDetachedFromWindow(); + + //Log.i(LOG_TAG, "Detaching..."); + + if (mUnbind) + unbindDrawables(this); + } + + /** + * unbind flag + */ + private boolean mUnbind = false; + + /** + * Unbind all drawables to avoid memory leaks. + * Link: http://stackoverflow.com/a/6779164/1590502 + * + * @param view + */ + private void unbindDrawables(View view) { + + if (view.getBackground() != null) { + view.getBackground().setCallback(null); + } + if (view instanceof ViewGroup) { + for (int i = 0; i < ((ViewGroup) view).getChildCount(); i++) { + unbindDrawables(((ViewGroup) view).getChildAt(i)); + } + ((ViewGroup) view).removeAllViews(); + } + } + + /** + * Set this to true to enable "unbinding" of drawables. When a View is detached + * from a window. This helps avoid memory leaks. + * Default: false + * Link: http://stackoverflow.com/a/6779164/1590502 + * + * @param enabled + */ + public void setUnbindEnabled(boolean enabled) { + this.mUnbind = enabled; + } +} diff --git a/MPChartLib/src/main/java/com/github/mikephil/charting/charts/CombinedChart.java b/MPChartLib/src/main/java/com/github/mikephil/charting/charts/CombinedChart.java new file mode 100644 index 00000000..cd01f0ef --- /dev/null +++ b/MPChartLib/src/main/java/com/github/mikephil/charting/charts/CombinedChart.java @@ -0,0 +1,272 @@ + +package com.github.mikephil.charting.charts; + +import android.content.Context; +import android.graphics.Canvas; +import android.util.AttributeSet; +import android.util.Log; + +import com.github.mikephil.charting.data.BarData; +import com.github.mikephil.charting.data.BubbleData; +import com.github.mikephil.charting.data.CandleData; +import com.github.mikephil.charting.data.CombinedData; +import com.github.mikephil.charting.data.Entry; +import com.github.mikephil.charting.data.LineData; +import com.github.mikephil.charting.data.ScatterData; +import com.github.mikephil.charting.highlight.CombinedHighlighter; +import com.github.mikephil.charting.highlight.Highlight; +import com.github.mikephil.charting.interfaces.dataprovider.CombinedDataProvider; +import com.github.mikephil.charting.interfaces.datasets.IDataSet; +import com.github.mikephil.charting.renderer.CombinedChartRenderer; + +/** + * This chart class allows the combination of lines, bars, scatter and candle + * data all displayed in one chart area. + * + * @author Philipp Jahoda + */ +public class CombinedChart extends BarLineChartBase<CombinedData> implements CombinedDataProvider { + + /** + * if set to true, all values are drawn above their bars, instead of below + * their top + */ + private boolean mDrawValueAboveBar = true; + + + /** + * flag that indicates whether the highlight should be full-bar oriented, or single-value? + */ + protected boolean mHighlightFullBarEnabled = false; + + /** + * if set to true, a grey area is drawn behind each bar that indicates the + * maximum value + */ + private boolean mDrawBarShadow = false; + + protected DrawOrder[] mDrawOrder; + + /** + * enum that allows to specify the order in which the different data objects + * for the combined-chart are drawn + */ + public enum DrawOrder { + BAR, BUBBLE, LINE, CANDLE, SCATTER + } + + public CombinedChart(Context context) { + super(context); + } + + public CombinedChart(Context context, AttributeSet attrs) { + super(context, attrs); + } + + public CombinedChart(Context context, AttributeSet attrs, int defStyle) { + super(context, attrs, defStyle); + } + + @Override + protected void init() { + super.init(); + + // Default values are not ready here yet + mDrawOrder = new DrawOrder[]{ + DrawOrder.BAR, DrawOrder.BUBBLE, DrawOrder.LINE, DrawOrder.CANDLE, DrawOrder.SCATTER + }; + + setHighlighter(new CombinedHighlighter(this, this)); + + // Old default behaviour + setHighlightFullBarEnabled(true); + + mRenderer = new CombinedChartRenderer(this, mAnimator, mViewPortHandler); + } + + @Override + public CombinedData getCombinedData() { + return mData; + } + + @Override + public void setData(CombinedData data) { + super.setData(data); + setHighlighter(new CombinedHighlighter(this, this)); + ((CombinedChartRenderer)mRenderer).createRenderers(); + mRenderer.initBuffers(); + } + + /** + * Returns the Highlight object (contains x-index and DataSet index) of the selected value at the given touch + * point + * inside the CombinedChart. + * + * @param x + * @param y + * @return + */ + @Override + public Highlight getHighlightByTouchPoint(float x, float y) { + + if (mData == null) { + Log.e(LOG_TAG, "Can't select by touch. No data set."); + return null; + } else { + Highlight h = getHighlighter().getHighlight(x, y); + if (h == null || !isHighlightFullBarEnabled()) return h; + + // For isHighlightFullBarEnabled, remove stackIndex + return new Highlight(h.getX(), h.getY(), + h.getXPx(), h.getYPx(), + h.getDataSetIndex(), -1, h.getAxis()); + } + } + + @Override + public LineData getLineData() { + if (mData == null) + return null; + return mData.getLineData(); + } + + @Override + public BarData getBarData() { + if (mData == null) + return null; + return mData.getBarData(); + } + + @Override + public ScatterData getScatterData() { + if (mData == null) + return null; + return mData.getScatterData(); + } + + @Override + public CandleData getCandleData() { + if (mData == null) + return null; + return mData.getCandleData(); + } + + @Override + public BubbleData getBubbleData() { + if (mData == null) + return null; + return mData.getBubbleData(); + } + + @Override + public boolean isDrawBarShadowEnabled() { + return mDrawBarShadow; + } + + @Override + public boolean isDrawValueAboveBarEnabled() { + return mDrawValueAboveBar; + } + + /** + * If set to true, all values are drawn above their bars, instead of below + * their top. + * + * @param enabled + */ + public void setDrawValueAboveBar(boolean enabled) { + mDrawValueAboveBar = enabled; + } + + + /** + * If set to true, a grey area is drawn behind each bar that indicates the + * maximum value. Enabling his will reduce performance by about 50%. + * + * @param enabled + */ + public void setDrawBarShadow(boolean enabled) { + mDrawBarShadow = enabled; + } + + /** + * Set this to true to make the highlight operation full-bar oriented, + * false to make it highlight single values (relevant only for stacked). + * + * @param enabled + */ + public void setHighlightFullBarEnabled(boolean enabled) { + mHighlightFullBarEnabled = enabled; + } + + /** + * @return true the highlight operation is be full-bar oriented, false if single-value + */ + @Override + public boolean isHighlightFullBarEnabled() { + return mHighlightFullBarEnabled; + } + + /** + * Returns the currently set draw order. + * + * @return + */ + public DrawOrder[] getDrawOrder() { + return mDrawOrder; + } + + /** + * Sets the order in which the provided data objects should be drawn. The + * earlier you place them in the provided array, the further they will be in + * the background. e.g. if you provide new DrawOrer[] { DrawOrder.BAR, + * DrawOrder.LINE }, the bars will be drawn behind the lines. + * + * @param order + */ + public void setDrawOrder(DrawOrder[] order) { + if (order == null || order.length <= 0) + return; + mDrawOrder = order; + } + + /** + * draws all MarkerViews on the highlighted positions + */ + protected void drawMarkers(Canvas canvas) { + + // if there is no marker view or drawing marker is disabled + if (mMarker == null || !isDrawMarkersEnabled() || !valuesToHighlight()) + return; + + for (int i = 0; i < mIndicesToHighlight.length; i++) { + + Highlight highlight = mIndicesToHighlight[i]; + + IDataSet set = mData.getDataSetByHighlight(highlight); + + Entry e = mData.getEntryForHighlight(highlight); + if (e == null) + continue; + + int entryIndex = set.getEntryIndex(e); + + // make sure entry not null + if (entryIndex > set.getEntryCount() * mAnimator.getPhaseX()) + continue; + + float[] pos = getMarkerPosition(highlight); + + // check bounds + if (!mViewPortHandler.isInBounds(pos[0], pos[1])) + continue; + + // callbacks to update the content + mMarker.refreshContent(e, highlight); + + // draw the marker + mMarker.draw(canvas, pos[0], pos[1]); + } + } + +} diff --git a/MPChartLib/src/main/java/com/github/mikephil/charting/charts/HorizontalBarChart.java b/MPChartLib/src/main/java/com/github/mikephil/charting/charts/HorizontalBarChart.java new file mode 100644 index 00000000..9aac1ce9 --- /dev/null +++ b/MPChartLib/src/main/java/com/github/mikephil/charting/charts/HorizontalBarChart.java @@ -0,0 +1,346 @@ +package com.github.mikephil.charting.charts; + +import android.content.Context; +import android.graphics.RectF; +import android.util.AttributeSet; +import android.util.Log; + +import com.github.mikephil.charting.components.XAxis.XAxisPosition; +import com.github.mikephil.charting.components.YAxis.AxisDependency; +import com.github.mikephil.charting.data.BarEntry; +import com.github.mikephil.charting.data.Entry; +import com.github.mikephil.charting.highlight.Highlight; +import com.github.mikephil.charting.highlight.HorizontalBarHighlighter; +import com.github.mikephil.charting.interfaces.datasets.IBarDataSet; +import com.github.mikephil.charting.renderer.HorizontalBarChartRenderer; +import com.github.mikephil.charting.renderer.XAxisRendererHorizontalBarChart; +import com.github.mikephil.charting.renderer.YAxisRendererHorizontalBarChart; +import com.github.mikephil.charting.utils.HorizontalViewPortHandler; +import com.github.mikephil.charting.utils.MPPointF; +import com.github.mikephil.charting.utils.TransformerHorizontalBarChart; +import com.github.mikephil.charting.utils.Utils; + +/** + * BarChart with horizontal bar orientation. In this implementation, x- and y-axis are switched, meaning the YAxis class + * represents the horizontal values and the XAxis class represents the vertical values. + * + * @author Philipp Jahoda + */ +public class HorizontalBarChart extends BarChart { + + public HorizontalBarChart(Context context) { + super(context); + } + + public HorizontalBarChart(Context context, AttributeSet attrs) { + super(context, attrs); + } + + public HorizontalBarChart(Context context, AttributeSet attrs, int defStyle) { + super(context, attrs, defStyle); + } + + @Override + protected void init() { + + mViewPortHandler = new HorizontalViewPortHandler(); + + super.init(); + + mLeftAxisTransformer = new TransformerHorizontalBarChart(mViewPortHandler); + mRightAxisTransformer = new TransformerHorizontalBarChart(mViewPortHandler); + + mRenderer = new HorizontalBarChartRenderer(this, mAnimator, mViewPortHandler); + setHighlighter(new HorizontalBarHighlighter(this)); + + mAxisRendererLeft = new YAxisRendererHorizontalBarChart(mViewPortHandler, mAxisLeft, mLeftAxisTransformer); + mAxisRendererRight = new YAxisRendererHorizontalBarChart(mViewPortHandler, mAxisRight, mRightAxisTransformer); + mXAxisRenderer = new XAxisRendererHorizontalBarChart(mViewPortHandler, mXAxis, mLeftAxisTransformer, this); + } + + private RectF mOffsetsBuffer = new RectF(); + + protected void calculateLegendOffsets(RectF offsets) { + + offsets.left = 0.f; + offsets.right = 0.f; + offsets.top = 0.f; + offsets.bottom = 0.f; + + if (mLegend == null || !mLegend.isEnabled() || mLegend.isDrawInsideEnabled()) + return; + + switch (mLegend.getOrientation()) { + case VERTICAL: + + switch (mLegend.getHorizontalAlignment()) { + case LEFT: + offsets.left += Math.min(mLegend.mNeededWidth, + mViewPortHandler.getChartWidth() * mLegend.getMaxSizePercent()) + + mLegend.getXOffset(); + break; + + case RIGHT: + offsets.right += Math.min(mLegend.mNeededWidth, + mViewPortHandler.getChartWidth() * mLegend.getMaxSizePercent()) + + mLegend.getXOffset(); + break; + + case CENTER: + + switch (mLegend.getVerticalAlignment()) { + case TOP: + offsets.top += Math.min(mLegend.mNeededHeight, + mViewPortHandler.getChartHeight() * mLegend.getMaxSizePercent()) + + mLegend.getYOffset(); + break; + + case BOTTOM: + offsets.bottom += Math.min(mLegend.mNeededHeight, + mViewPortHandler.getChartHeight() * mLegend.getMaxSizePercent()) + + mLegend.getYOffset(); + break; + + default: + break; + } + } + + break; + + case HORIZONTAL: + + switch (mLegend.getVerticalAlignment()) { + case TOP: + offsets.top += Math.min(mLegend.mNeededHeight, + mViewPortHandler.getChartHeight() * mLegend.getMaxSizePercent()) + + mLegend.getYOffset(); + + if (mAxisLeft.isEnabled() && mAxisLeft.isDrawLabelsEnabled()) + offsets.top += mAxisLeft.getRequiredHeightSpace( + mAxisRendererLeft.getPaintAxisLabels()); + break; + + case BOTTOM: + offsets.bottom += Math.min(mLegend.mNeededHeight, + mViewPortHandler.getChartHeight() * mLegend.getMaxSizePercent()) + + mLegend.getYOffset(); + + if (mAxisRight.isEnabled() && mAxisRight.isDrawLabelsEnabled()) + offsets.bottom += mAxisRight.getRequiredHeightSpace( + mAxisRendererRight.getPaintAxisLabels()); + break; + + default: + break; + } + break; + } + } + + @Override + public void calculateOffsets() { + + float offsetLeft = 0f, offsetRight = 0f, offsetTop = 0f, offsetBottom = 0f; + + calculateLegendOffsets(mOffsetsBuffer); + + offsetLeft += mOffsetsBuffer.left; + offsetTop += mOffsetsBuffer.top; + offsetRight += mOffsetsBuffer.right; + offsetBottom += mOffsetsBuffer.bottom; + + // offsets for y-labels + if (mAxisLeft.needsOffset()) { + offsetTop += mAxisLeft.getRequiredHeightSpace(mAxisRendererLeft.getPaintAxisLabels()); + } + + if (mAxisRight.needsOffset()) { + offsetBottom += mAxisRight.getRequiredHeightSpace(mAxisRendererRight.getPaintAxisLabels()); + } + + float xlabelwidth = mXAxis.mLabelRotatedWidth; + + if (mXAxis.isEnabled()) { + + // offsets for x-labels + if (mXAxis.getPosition() == XAxisPosition.BOTTOM) { + + offsetLeft += xlabelwidth; + + } else if (mXAxis.getPosition() == XAxisPosition.TOP) { + + offsetRight += xlabelwidth; + + } else if (mXAxis.getPosition() == XAxisPosition.BOTH_SIDED) { + + offsetLeft += xlabelwidth; + offsetRight += xlabelwidth; + } + } + + offsetTop += getExtraTopOffset(); + offsetRight += getExtraRightOffset(); + offsetBottom += getExtraBottomOffset(); + offsetLeft += getExtraLeftOffset(); + + float minOffset = Utils.convertDpToPixel(mMinOffset); + + mViewPortHandler.restrainViewPort( + Math.max(minOffset, offsetLeft), + Math.max(minOffset, offsetTop), + Math.max(minOffset, offsetRight), + Math.max(minOffset, offsetBottom)); + + if (mLogEnabled) { + Log.i(LOG_TAG, "offsetLeft: " + offsetLeft + ", offsetTop: " + offsetTop + ", offsetRight: " + + offsetRight + ", offsetBottom: " + + offsetBottom); + Log.i(LOG_TAG, "Content: " + mViewPortHandler.getContentRect().toString()); + } + + prepareOffsetMatrix(); + prepareValuePxMatrix(); + } + + @Override + protected void prepareValuePxMatrix() { + mRightAxisTransformer.prepareMatrixValuePx(mAxisRight.mAxisMinimum, mAxisRight.mAxisRange, mXAxis.mAxisRange, + mXAxis.mAxisMinimum); + mLeftAxisTransformer.prepareMatrixValuePx(mAxisLeft.mAxisMinimum, mAxisLeft.mAxisRange, mXAxis.mAxisRange, + mXAxis.mAxisMinimum); + } + + @Override + protected float[] getMarkerPosition(Highlight high) { + return new float[]{high.getDrawY(), high.getDrawX()}; + } + + @Override + public void getBarBounds(BarEntry e, RectF outputRect) { + + RectF bounds = outputRect; + IBarDataSet set = mData.getDataSetForEntry(e); + + if (set == null) { + outputRect.set(Float.MIN_VALUE, Float.MIN_VALUE, Float.MIN_VALUE, Float.MIN_VALUE); + return; + } + + float y = e.getY(); + float x = e.getX(); + + float barWidth = mData.getBarWidth(); + + float top = x - barWidth / 2f; + float bottom = x + barWidth / 2f; + float left = y >= 0 ? y : 0; + float right = y <= 0 ? y : 0; + + bounds.set(left, top, right, bottom); + + getTransformer(set.getAxisDependency()).rectValueToPixel(bounds); + + } + + protected float[] mGetPositionBuffer = new float[2]; + + /** + * Returns a recyclable MPPointF instance. + * + * @param e + * @param axis + * @return + */ + @Override + public MPPointF getPosition(Entry e, AxisDependency axis) { + + if (e == null) + return null; + + float[] vals = mGetPositionBuffer; + vals[0] = e.getY(); + vals[1] = e.getX(); + + getTransformer(axis).pointValuesToPixel(vals); + + return MPPointF.getInstance(vals[0], vals[1]); + } + + /** + * Returns the Highlight object (contains x-index and DataSet index) of the selected value at the given touch point + * inside the BarChart. + * + * @param x + * @param y + * @return + */ + @Override + public Highlight getHighlightByTouchPoint(float x, float y) { + + if (mData == null) { + if (mLogEnabled) + Log.e(LOG_TAG, "Can't select by touch. No data set."); + return null; + } else + return getHighlighter().getHighlight(y, x); // switch x and y + } + + @Override + public float getLowestVisibleX() { + getTransformer(AxisDependency.LEFT).getValuesByTouchPoint(mViewPortHandler.contentLeft(), + mViewPortHandler.contentBottom(), posForGetLowestVisibleX); + float result = (float) Math.max(mXAxis.mAxisMinimum, posForGetLowestVisibleX.y); + return result; + } + + @Override + public float getHighestVisibleX() { + getTransformer(AxisDependency.LEFT).getValuesByTouchPoint(mViewPortHandler.contentLeft(), + mViewPortHandler.contentTop(), posForGetHighestVisibleX); + float result = (float) Math.min(mXAxis.mAxisMaximum, posForGetHighestVisibleX.y); + return result; + } + + /** + * ###### VIEWPORT METHODS BELOW THIS ###### + */ + + @Override + public void setVisibleXRangeMaximum(float maxXRange) { + float xScale = mXAxis.mAxisRange / (maxXRange); + mViewPortHandler.setMinimumScaleY(xScale); + } + + @Override + public void setVisibleXRangeMinimum(float minXRange) { + float xScale = mXAxis.mAxisRange / (minXRange); + mViewPortHandler.setMaximumScaleY(xScale); + } + + @Override + public void setVisibleXRange(float minXRange, float maxXRange) { + float minScale = mXAxis.mAxisRange / minXRange; + float maxScale = mXAxis.mAxisRange / maxXRange; + mViewPortHandler.setMinMaxScaleY(minScale, maxScale); + } + + @Override + public void setVisibleYRangeMaximum(float maxYRange, AxisDependency axis) { + float yScale = getAxisRange(axis) / maxYRange; + mViewPortHandler.setMinimumScaleX(yScale); + } + + @Override + public void setVisibleYRangeMinimum(float minYRange, AxisDependency axis) { + float yScale = getAxisRange(axis) / minYRange; + mViewPortHandler.setMaximumScaleX(yScale); + } + + @Override + public void setVisibleYRange(float minYRange, float maxYRange, AxisDependency axis) { + float minScale = getAxisRange(axis) / minYRange; + float maxScale = getAxisRange(axis) / maxYRange; + mViewPortHandler.setMinMaxScaleX(minScale, maxScale); + } +} diff --git a/MPChartLib/src/main/java/com/github/mikephil/charting/charts/LineChart.java b/MPChartLib/src/main/java/com/github/mikephil/charting/charts/LineChart.java new file mode 100644 index 00000000..aa7afc4c --- /dev/null +++ b/MPChartLib/src/main/java/com/github/mikephil/charting/charts/LineChart.java @@ -0,0 +1,50 @@ + +package com.github.mikephil.charting.charts; + +import android.content.Context; +import android.util.AttributeSet; + +import com.github.mikephil.charting.data.LineData; +import com.github.mikephil.charting.interfaces.dataprovider.LineDataProvider; +import com.github.mikephil.charting.renderer.LineChartRenderer; + +/** + * Chart that draws lines, surfaces, circles, ... + * + * @author Philipp Jahoda + */ +public class LineChart extends BarLineChartBase<LineData> implements LineDataProvider { + + public LineChart(Context context) { + super(context); + } + + public LineChart(Context context, AttributeSet attrs) { + super(context, attrs); + } + + public LineChart(Context context, AttributeSet attrs, int defStyle) { + super(context, attrs, defStyle); + } + + @Override + protected void init() { + super.init(); + + mRenderer = new LineChartRenderer(this, mAnimator, mViewPortHandler); + } + + @Override + public LineData getLineData() { + return mData; + } + + @Override + protected void onDetachedFromWindow() { + // releases the bitmap in the renderer to avoid oom error + if (mRenderer != null && mRenderer instanceof LineChartRenderer) { + ((LineChartRenderer) mRenderer).releaseBitmap(); + } + super.onDetachedFromWindow(); + } +} diff --git a/MPChartLib/src/main/java/com/github/mikephil/charting/charts/PieChart.java b/MPChartLib/src/main/java/com/github/mikephil/charting/charts/PieChart.java new file mode 100644 index 00000000..de11b3a8 --- /dev/null +++ b/MPChartLib/src/main/java/com/github/mikephil/charting/charts/PieChart.java @@ -0,0 +1,804 @@ + +package com.github.mikephil.charting.charts; + +import android.content.Context; +import android.graphics.Canvas; +import android.graphics.Paint; +import android.graphics.RectF; +import android.graphics.Typeface; +import android.util.AttributeSet; + +import com.github.mikephil.charting.components.XAxis; +import com.github.mikephil.charting.data.PieData; +import com.github.mikephil.charting.highlight.Highlight; +import com.github.mikephil.charting.highlight.PieHighlighter; +import com.github.mikephil.charting.interfaces.datasets.IPieDataSet; +import com.github.mikephil.charting.renderer.PieChartRenderer; +import com.github.mikephil.charting.utils.MPPointF; +import com.github.mikephil.charting.utils.Utils; + +import java.util.List; + +/** + * View that represents a pie chart. Draws cake like slices. + * + * @author Philipp Jahoda + */ +public class PieChart extends PieRadarChartBase<PieData> { + + /** + * rect object that represents the bounds of the piechart, needed for + * drawing the circle + */ + private RectF mCircleBox = new RectF(); + + /** + * flag indicating if entry labels should be drawn or not + */ + private boolean mDrawEntryLabels = true; + + /** + * array that holds the width of each pie-slice in degrees + */ + private float[] mDrawAngles = new float[1]; + + /** + * array that holds the absolute angle in degrees of each slice + */ + private float[] mAbsoluteAngles = new float[1]; + + /** + * if true, the white hole inside the chart will be drawn + */ + private boolean mDrawHole = true; + + /** + * if true, the hole will see-through to the inner tips of the slices + */ + private boolean mDrawSlicesUnderHole = false; + + /** + * if true, the values inside the piechart are drawn as percent values + */ + private boolean mUsePercentValues = false; + + /** + * if true, the slices of the piechart are rounded + */ + private boolean mDrawRoundedSlices = false; + + /** + * variable for the text that is drawn in the center of the pie-chart + */ + private CharSequence mCenterText = ""; + + private MPPointF mCenterTextOffset = MPPointF.getInstance(0, 0); + + /** + * indicates the size of the hole in the center of the piechart, default: + * radius / 2 + */ + private float mHoleRadiusPercent = 50f; + + /** + * the radius of the transparent circle next to the chart-hole in the center + */ + protected float mTransparentCircleRadiusPercent = 55f; + + /** + * if enabled, centertext is drawn + */ + private boolean mDrawCenterText = true; + + private float mCenterTextRadiusPercent = 100.f; + + protected float mMaxAngle = 360f; + + /** + * Minimum angle to draw slices, this only works if there is enough room for all slices to have + * the minimum angle, default 0f. + */ + private float mMinAngleForSlices = 0f; + + public PieChart(Context context) { + super(context); + } + + public PieChart(Context context, AttributeSet attrs) { + super(context, attrs); + } + + public PieChart(Context context, AttributeSet attrs, int defStyle) { + super(context, attrs, defStyle); + } + + @Override + protected void init() { + super.init(); + + mRenderer = new PieChartRenderer(this, mAnimator, mViewPortHandler); + mXAxis = null; + + mHighlighter = new PieHighlighter(this); + } + + @Override + protected void onDraw(Canvas canvas) { + super.onDraw(canvas); + + if (mData == null) + return; + + mRenderer.drawData(canvas); + + if (valuesToHighlight()) + mRenderer.drawHighlighted(canvas, mIndicesToHighlight); + + mRenderer.drawExtras(canvas); + + mRenderer.drawValues(canvas); + + mLegendRenderer.renderLegend(canvas); + + drawDescription(canvas); + + drawMarkers(canvas); + } + + @Override + public void calculateOffsets() { + super.calculateOffsets(); + + // prevent nullpointer when no data set + if (mData == null) + return; + + float diameter = getDiameter(); + float radius = diameter / 2f; + + MPPointF c = getCenterOffsets(); + + float shift = mData.getDataSet().getSelectionShift(); + + // create the circle box that will contain the pie-chart (the bounds of + // the pie-chart) + mCircleBox.set(c.x - radius + shift, + c.y - radius + shift, + c.x + radius - shift, + c.y + radius - shift); + + MPPointF.recycleInstance(c); + } + + @Override + protected void calcMinMax() { + calcAngles(); + } + + @Override + protected float[] getMarkerPosition(Highlight highlight) { + + MPPointF center = getCenterCircleBox(); + float r = getRadius(); + + float off = r / 10f * 3.6f; + + if (isDrawHoleEnabled()) { + off = (r - (r / 100f * getHoleRadius())) / 2f; + } + + r -= off; // offset to keep things inside the chart + + float rotationAngle = getRotationAngle(); + + int entryIndex = (int) highlight.getX(); + + // offset needed to center the drawn text in the slice + float offset = mDrawAngles[entryIndex] / 2; + + // calculate the text position + float x = (float) (r + * Math.cos(Math.toRadians((rotationAngle + mAbsoluteAngles[entryIndex] - offset) + * mAnimator.getPhaseY())) + center.x); + float y = (float) (r + * Math.sin(Math.toRadians((rotationAngle + mAbsoluteAngles[entryIndex] - offset) + * mAnimator.getPhaseY())) + center.y); + + MPPointF.recycleInstance(center); + return new float[]{x, y}; + } + + /** + * calculates the needed angles for the chart slices + */ + private void calcAngles() { + + int entryCount = mData.getEntryCount(); + + if (mDrawAngles.length != entryCount) { + mDrawAngles = new float[entryCount]; + } else { + for (int i = 0; i < entryCount; i++) { + mDrawAngles[i] = 0; + } + } + if (mAbsoluteAngles.length != entryCount) { + mAbsoluteAngles = new float[entryCount]; + } else { + for (int i = 0; i < entryCount; i++) { + mAbsoluteAngles[i] = 0; + } + } + + float yValueSum = mData.getYValueSum(); + + List<IPieDataSet> dataSets = mData.getDataSets(); + + boolean hasMinAngle = mMinAngleForSlices != 0f && entryCount * mMinAngleForSlices <= mMaxAngle; + float[] minAngles = new float[entryCount]; + + int cnt = 0; + float offset = 0f; + float diff = 0f; + + for (int i = 0; i < mData.getDataSetCount(); i++) { + + IPieDataSet set = dataSets.get(i); + + for (int j = 0; j < set.getEntryCount(); j++) { + + float drawAngle = calcAngle(Math.abs(set.getEntryForIndex(j).getY()), yValueSum); + + if (hasMinAngle) { + float temp = drawAngle - mMinAngleForSlices; + if (temp <= 0) { + minAngles[cnt] = mMinAngleForSlices; + offset += -temp; + } else { + minAngles[cnt] = drawAngle; + diff += temp; + } + } + + mDrawAngles[cnt] = drawAngle; + + if (cnt == 0) { + mAbsoluteAngles[cnt] = mDrawAngles[cnt]; + } else { + mAbsoluteAngles[cnt] = mAbsoluteAngles[cnt - 1] + mDrawAngles[cnt]; + } + + cnt++; + } + } + + if (hasMinAngle) { + // Correct bigger slices by relatively reducing their angles based on the total angle needed to subtract + // This requires that `entryCount * mMinAngleForSlices <= mMaxAngle` be true to properly work! + for (int i = 0; i < entryCount; i++) { + minAngles[i] -= (minAngles[i] - mMinAngleForSlices) / diff * offset; + if (i == 0) { + mAbsoluteAngles[0] = minAngles[0]; + } else { + mAbsoluteAngles[i] = mAbsoluteAngles[i - 1] + minAngles[i]; + } + } + + mDrawAngles = minAngles; + } + } + + /** + * Checks if the given index is set to be highlighted. + * + * @param index + * @return + */ + public boolean needsHighlight(int index) { + + // no highlight + if (!valuesToHighlight()) + return false; + + for (int i = 0; i < mIndicesToHighlight.length; i++) + + // check if the xvalue for the given dataset needs highlight + if ((int) mIndicesToHighlight[i].getX() == index) + return true; + + return false; + } + + /** + * calculates the needed angle for a given value + * + * @param value + * @return + */ + private float calcAngle(float value) { + return calcAngle(value, mData.getYValueSum()); + } + + /** + * calculates the needed angle for a given value + * + * @param value + * @param yValueSum + * @return + */ + private float calcAngle(float value, float yValueSum) { + return value / yValueSum * mMaxAngle; + } + + /** + * This will throw an exception, PieChart has no XAxis object. + * + * @return + */ + @Deprecated + @Override + public XAxis getXAxis() { + throw new RuntimeException("PieChart has no XAxis"); + } + + @Override + public int getIndexForAngle(float angle) { + + // take the current angle of the chart into consideration + float a = Utils.getNormalizedAngle(angle - getRotationAngle()); + + for (int i = 0; i < mAbsoluteAngles.length; i++) { + if (mAbsoluteAngles[i] > a) + return i; + } + + return -1; // return -1 if no index found + } + + /** + * Returns the index of the DataSet this x-index belongs to. + * + * @param xIndex + * @return + */ + public int getDataSetIndexForIndex(int xIndex) { + + List<IPieDataSet> dataSets = mData.getDataSets(); + + for (int i = 0; i < dataSets.size(); i++) { + if (dataSets.get(i).getEntryForXValue(xIndex, Float.NaN) != null) + return i; + } + + return -1; + } + + /** + * returns an integer array of all the different angles the chart slices + * have the angles in the returned array determine how much space (of 360°) + * each slice takes + * + * @return + */ + public float[] getDrawAngles() { + return mDrawAngles; + } + + /** + * returns the absolute angles of the different chart slices (where the + * slices end) + * + * @return + */ + public float[] getAbsoluteAngles() { + return mAbsoluteAngles; + } + + /** + * Sets the color for the hole that is drawn in the center of the PieChart + * (if enabled). + * + * @param color + */ + public void setHoleColor(int color) { + ((PieChartRenderer) mRenderer).getPaintHole().setColor(color); + } + + /** + * Enable or disable the visibility of the inner tips of the slices behind the hole + */ + public void setDrawSlicesUnderHole(boolean enable) { + mDrawSlicesUnderHole = enable; + } + + /** + * Returns true if the inner tips of the slices are visible behind the hole, + * false if not. + * + * @return true if slices are visible behind the hole. + */ + public boolean isDrawSlicesUnderHoleEnabled() { + return mDrawSlicesUnderHole; + } + + /** + * set this to true to draw the pie center empty + * + * @param enabled + */ + public void setDrawHoleEnabled(boolean enabled) { + this.mDrawHole = enabled; + } + + /** + * returns true if the hole in the center of the pie-chart is set to be + * visible, false if not + * + * @return + */ + public boolean isDrawHoleEnabled() { + return mDrawHole; + } + + /** + * Sets the text String that is displayed in the center of the PieChart. + * + * @param text + */ + public void setCenterText(CharSequence text) { + if (text == null) + mCenterText = ""; + else + mCenterText = text; + } + + /** + * returns the text that is drawn in the center of the pie-chart + * + * @return + */ + public CharSequence getCenterText() { + return mCenterText; + } + + /** + * set this to true to draw the text that is displayed in the center of the + * pie chart + * + * @param enabled + */ + public void setDrawCenterText(boolean enabled) { + this.mDrawCenterText = enabled; + } + + /** + * returns true if drawing the center text is enabled + * + * @return + */ + public boolean isDrawCenterTextEnabled() { + return mDrawCenterText; + } + + @Override + protected float getRequiredLegendOffset() { + return mLegendRenderer.getLabelPaint().getTextSize() * 2.f; + } + + @Override + protected float getRequiredBaseOffset() { + return 0; + } + + @Override + public float getRadius() { + if (mCircleBox == null) + return 0; + else + return Math.min(mCircleBox.width() / 2f, mCircleBox.height() / 2f); + } + + /** + * returns the circlebox, the boundingbox of the pie-chart slices + * + * @return + */ + public RectF getCircleBox() { + return mCircleBox; + } + + /** + * returns the center of the circlebox + * + * @return + */ + public MPPointF getCenterCircleBox() { + return MPPointF.getInstance(mCircleBox.centerX(), mCircleBox.centerY()); + } + + /** + * sets the typeface for the center-text paint + * + * @param t + */ + public void setCenterTextTypeface(Typeface t) { + ((PieChartRenderer) mRenderer).getPaintCenterText().setTypeface(t); + } + + /** + * Sets the size of the center text of the PieChart in dp. + * + * @param sizeDp + */ + public void setCenterTextSize(float sizeDp) { + ((PieChartRenderer) mRenderer).getPaintCenterText().setTextSize( + Utils.convertDpToPixel(sizeDp)); + } + + /** + * Sets the size of the center text of the PieChart in pixels. + * + * @param sizePixels + */ + public void setCenterTextSizePixels(float sizePixels) { + ((PieChartRenderer) mRenderer).getPaintCenterText().setTextSize(sizePixels); + } + + /** + * Sets the offset the center text should have from it's original position in dp. Default x = 0, y = 0 + * + * @param x + * @param y + */ + public void setCenterTextOffset(float x, float y) { + mCenterTextOffset.x = Utils.convertDpToPixel(x); + mCenterTextOffset.y = Utils.convertDpToPixel(y); + } + + /** + * Returns the offset on the x- and y-axis the center text has in dp. + * + * @return + */ + public MPPointF getCenterTextOffset() { + return MPPointF.getInstance(mCenterTextOffset.x, mCenterTextOffset.y); + } + + /** + * Sets the color of the center text of the PieChart. + * + * @param color + */ + public void setCenterTextColor(int color) { + ((PieChartRenderer) mRenderer).getPaintCenterText().setColor(color); + } + + /** + * sets the radius of the hole in the center of the piechart in percent of + * the maximum radius (max = the radius of the whole chart), default 50% + * + * @param percent + */ + public void setHoleRadius(final float percent) { + mHoleRadiusPercent = percent; + } + + /** + * Returns the size of the hole radius in percent of the total radius. + * + * @return + */ + public float getHoleRadius() { + return mHoleRadiusPercent; + } + + /** + * Sets the color the transparent-circle should have. + * + * @param color + */ + public void setTransparentCircleColor(int color) { + + Paint p = ((PieChartRenderer) mRenderer).getPaintTransparentCircle(); + int alpha = p.getAlpha(); + p.setColor(color); + p.setAlpha(alpha); + } + + /** + * sets the radius of the transparent circle that is drawn next to the hole + * in the piechart in percent of the maximum radius (max = the radius of the + * whole chart), default 55% -> means 5% larger than the center-hole by + * default + * + * @param percent + */ + public void setTransparentCircleRadius(final float percent) { + mTransparentCircleRadiusPercent = percent; + } + + public float getTransparentCircleRadius() { + return mTransparentCircleRadiusPercent; + } + + /** + * Sets the amount of transparency the transparent circle should have 0 = fully transparent, + * 255 = fully opaque. + * Default value is 100. + * + * @param alpha 0-255 + */ + public void setTransparentCircleAlpha(int alpha) { + ((PieChartRenderer) mRenderer).getPaintTransparentCircle().setAlpha(alpha); + } + + /** + * Set this to true to draw the entry labels into the pie slices (Provided by the getLabel() method of the PieEntry class). + * Deprecated -> use setDrawEntryLabels(...) instead. + * + * @param enabled + */ + @Deprecated + public void setDrawSliceText(boolean enabled) { + mDrawEntryLabels = enabled; + } + + /** + * Set this to true to draw the entry labels into the pie slices (Provided by the getLabel() method of the PieEntry class). + * + * @param enabled + */ + public void setDrawEntryLabels(boolean enabled) { + mDrawEntryLabels = enabled; + } + + /** + * Returns true if drawing the entry labels is enabled, false if not. + * + * @return + */ + public boolean isDrawEntryLabelsEnabled() { + return mDrawEntryLabels; + } + + /** + * Sets the color the entry labels are drawn with. + * + * @param color + */ + public void setEntryLabelColor(int color) { + ((PieChartRenderer) mRenderer).getPaintEntryLabels().setColor(color); + } + + /** + * Sets a custom Typeface for the drawing of the entry labels. + * + * @param tf + */ + public void setEntryLabelTypeface(Typeface tf) { + ((PieChartRenderer) mRenderer).getPaintEntryLabels().setTypeface(tf); + } + + /** + * Sets the size of the entry labels in dp. Default: 13dp + * + * @param size + */ + public void setEntryLabelTextSize(float size) { + ((PieChartRenderer) mRenderer).getPaintEntryLabels().setTextSize(Utils.convertDpToPixel(size)); + } + + /** + * Sets whether to draw slices in a curved fashion, only works if drawing the hole is enabled + * and if the slices are not drawn under the hole. + * + * @param enabled draw curved ends of slices + */ + public void setDrawRoundedSlices(boolean enabled) { + mDrawRoundedSlices = enabled; + } + + /** + * Returns true if the chart is set to draw each end of a pie-slice + * "rounded". + * + * @return + */ + public boolean isDrawRoundedSlicesEnabled() { + return mDrawRoundedSlices; + } + + /** + * If this is enabled, values inside the PieChart are drawn in percent and + * not with their original value. Values provided for the IValueFormatter to + * format are then provided in percent. + * + * @param enabled + */ + public void setUsePercentValues(boolean enabled) { + mUsePercentValues = enabled; + } + + /** + * Returns true if using percentage values is enabled for the chart. + * + * @return + */ + public boolean isUsePercentValuesEnabled() { + return mUsePercentValues; + } + + /** + * the rectangular radius of the bounding box for the center text, as a percentage of the pie + * hole + * default 1.f (100%) + */ + public void setCenterTextRadiusPercent(float percent) { + mCenterTextRadiusPercent = percent; + } + + /** + * the rectangular radius of the bounding box for the center text, as a percentage of the pie + * hole + * default 1.f (100%) + */ + public float getCenterTextRadiusPercent() { + return mCenterTextRadiusPercent; + } + + public float getMaxAngle() { + return mMaxAngle; + } + + /** + * Sets the max angle that is used for calculating the pie-circle. 360f means + * it's a full PieChart, 180f results in a half-pie-chart. Default: 360f + * + * @param maxangle min 90, max 360 + */ + public void setMaxAngle(float maxangle) { + + if (maxangle > 360) + maxangle = 360f; + + if (maxangle < 90) + maxangle = 90f; + + this.mMaxAngle = maxangle; + } + + /** + * The minimum angle slices on the chart are rendered with, default is 0f. + * + * @return minimum angle for slices + */ + public float getMinAngleForSlices() { + return mMinAngleForSlices; + } + + /** + * Set the angle to set minimum size for slices, you must call {@link #notifyDataSetChanged()} + * and {@link #invalidate()} when changing this, only works if there is enough room for all + * slices to have the minimum angle. + * + * @param minAngle minimum 0, maximum is half of {@link #setMaxAngle(float)} + */ + public void setMinAngleForSlices(float minAngle) { + + if (minAngle > (mMaxAngle / 2f)) + minAngle = mMaxAngle / 2f; + else if (minAngle < 0) + minAngle = 0f; + + this.mMinAngleForSlices = minAngle; + } + + @Override + protected void onDetachedFromWindow() { + // releases the bitmap in the renderer to avoid oom error + if (mRenderer != null && mRenderer instanceof PieChartRenderer) { + ((PieChartRenderer) mRenderer).releaseBitmap(); + } + super.onDetachedFromWindow(); + } +} diff --git a/MPChartLib/src/main/java/com/github/mikephil/charting/charts/PieRadarChartBase.java b/MPChartLib/src/main/java/com/github/mikephil/charting/charts/PieRadarChartBase.java new file mode 100644 index 00000000..e6d38d3a --- /dev/null +++ b/MPChartLib/src/main/java/com/github/mikephil/charting/charts/PieRadarChartBase.java @@ -0,0 +1,499 @@ + +package com.github.mikephil.charting.charts; + +import android.animation.ObjectAnimator; +import android.animation.ValueAnimator; +import android.animation.ValueAnimator.AnimatorUpdateListener; +import android.annotation.SuppressLint; +import android.content.Context; +import android.graphics.RectF; +import android.util.AttributeSet; +import android.util.Log; +import android.view.MotionEvent; + +import com.github.mikephil.charting.animation.Easing; +import com.github.mikephil.charting.animation.Easing.EasingFunction; +import com.github.mikephil.charting.components.Legend; +import com.github.mikephil.charting.components.XAxis; +import com.github.mikephil.charting.data.ChartData; +import com.github.mikephil.charting.data.Entry; +import com.github.mikephil.charting.interfaces.datasets.IDataSet; +import com.github.mikephil.charting.listener.PieRadarChartTouchListener; +import com.github.mikephil.charting.utils.MPPointF; +import com.github.mikephil.charting.utils.Utils; + +/** + * Baseclass of PieChart and RadarChart. + * + * @author Philipp Jahoda + */ +public abstract class PieRadarChartBase<T extends ChartData<? extends IDataSet<? extends Entry>>> + extends Chart<T> { + + /** + * holds the normalized version of the current rotation angle of the chart + */ + private float mRotationAngle = 270f; + + /** + * holds the raw version of the current rotation angle of the chart + */ + private float mRawRotationAngle = 270f; + + /** + * flag that indicates if rotation is enabled or not + */ + protected boolean mRotateEnabled = true; + + /** + * Sets the minimum offset (padding) around the chart, defaults to 0.f + */ + protected float mMinOffset = 0.f; + + public PieRadarChartBase(Context context) { + super(context); + } + + public PieRadarChartBase(Context context, AttributeSet attrs) { + super(context, attrs); + } + + public PieRadarChartBase(Context context, AttributeSet attrs, int defStyle) { + super(context, attrs, defStyle); + } + + @Override + protected void init() { + super.init(); + + mChartTouchListener = new PieRadarChartTouchListener(this); + } + + @Override + protected void calcMinMax() { + //mXAxis.mAxisRange = mData.getXVals().size() - 1; + } + + @Override + public int getMaxVisibleCount() { + return mData.getEntryCount(); + } + + @Override + public boolean onTouchEvent(MotionEvent event) { + // use the pie- and radarchart listener own listener + if (mTouchEnabled && mChartTouchListener != null) + return mChartTouchListener.onTouch(this, event); + else + return super.onTouchEvent(event); + } + + @Override + public void computeScroll() { + + if (mChartTouchListener instanceof PieRadarChartTouchListener) + ((PieRadarChartTouchListener) mChartTouchListener).computeScroll(); + } + + @Override + public void notifyDataSetChanged() { + if (mData == null) + return; + + calcMinMax(); + + if (mLegend != null) + mLegendRenderer.computeLegend(mData); + + calculateOffsets(); + } + + @Override + public void calculateOffsets() { + + float legendLeft = 0f, legendRight = 0f, legendBottom = 0f, legendTop = 0f; + + if (mLegend != null && mLegend.isEnabled() && !mLegend.isDrawInsideEnabled()) { + + float fullLegendWidth = Math.min(mLegend.mNeededWidth, + mViewPortHandler.getChartWidth() * mLegend.getMaxSizePercent()); + + switch (mLegend.getOrientation()) { + case VERTICAL: { + float xLegendOffset = 0.f; + + if (mLegend.getHorizontalAlignment() == Legend.LegendHorizontalAlignment.LEFT + || mLegend.getHorizontalAlignment() == Legend.LegendHorizontalAlignment.RIGHT) { + if (mLegend.getVerticalAlignment() == Legend.LegendVerticalAlignment.CENTER) { + // this is the space between the legend and the chart + final float spacing = Utils.convertDpToPixel(13f); + + xLegendOffset = fullLegendWidth + spacing; + + } else { + // this is the space between the legend and the chart + float spacing = Utils.convertDpToPixel(8f); + + float legendWidth = fullLegendWidth + spacing; + float legendHeight = mLegend.mNeededHeight + mLegend.mTextHeightMax; + + MPPointF center = getCenter(); + + float bottomX = mLegend.getHorizontalAlignment() == + Legend.LegendHorizontalAlignment.RIGHT + ? getWidth() - legendWidth + 15.f + : legendWidth - 15.f; + float bottomY = legendHeight + 15.f; + float distLegend = distanceToCenter(bottomX, bottomY); + + MPPointF reference = getPosition(center, getRadius(), + getAngleForPoint(bottomX, bottomY)); + + float distReference = distanceToCenter(reference.x, reference.y); + float minOffset = Utils.convertDpToPixel(5f); + + if (bottomY >= center.y && getHeight() - legendWidth > getWidth()) { + xLegendOffset = legendWidth; + } else if (distLegend < distReference) { + + float diff = distReference - distLegend; + xLegendOffset = minOffset + diff; + } + + MPPointF.recycleInstance(center); + MPPointF.recycleInstance(reference); + } + } + + switch (mLegend.getHorizontalAlignment()) { + case LEFT: + legendLeft = xLegendOffset; + break; + + case RIGHT: + legendRight = xLegendOffset; + break; + + case CENTER: + switch (mLegend.getVerticalAlignment()) { + case TOP: + legendTop = Math.min(mLegend.mNeededHeight, + mViewPortHandler.getChartHeight() * mLegend.getMaxSizePercent()); + break; + case BOTTOM: + legendBottom = Math.min(mLegend.mNeededHeight, + mViewPortHandler.getChartHeight() * mLegend.getMaxSizePercent()); + break; + } + break; + } + } + break; + + case HORIZONTAL: + float yLegendOffset = 0.f; + + if (mLegend.getVerticalAlignment() == Legend.LegendVerticalAlignment.TOP || + mLegend.getVerticalAlignment() == Legend.LegendVerticalAlignment.BOTTOM) { + + // It's possible that we do not need this offset anymore as it + // is available through the extraOffsets, but changing it can mean + // changing default visibility for existing apps. + float yOffset = getRequiredLegendOffset(); + + yLegendOffset = Math.min(mLegend.mNeededHeight + yOffset, + mViewPortHandler.getChartHeight() * mLegend.getMaxSizePercent()); + + switch (mLegend.getVerticalAlignment()) { + case TOP: + legendTop = yLegendOffset; + break; + case BOTTOM: + legendBottom = yLegendOffset; + break; + } + } + break; + } + + legendLeft += getRequiredBaseOffset(); + legendRight += getRequiredBaseOffset(); + legendTop += getRequiredBaseOffset(); + legendBottom += getRequiredBaseOffset(); + } + + float minOffset = Utils.convertDpToPixel(mMinOffset); + + if (this instanceof RadarChart) { + XAxis x = this.getXAxis(); + + if (x.isEnabled() && x.isDrawLabelsEnabled()) { + minOffset = Math.max(minOffset, x.mLabelRotatedWidth); + } + } + + legendTop += getExtraTopOffset(); + legendRight += getExtraRightOffset(); + legendBottom += getExtraBottomOffset(); + legendLeft += getExtraLeftOffset(); + + float offsetLeft = Math.max(minOffset, legendLeft); + float offsetTop = Math.max(minOffset, legendTop); + float offsetRight = Math.max(minOffset, legendRight); + float offsetBottom = Math.max(minOffset, Math.max(getRequiredBaseOffset(), legendBottom)); + + mViewPortHandler.restrainViewPort(offsetLeft, offsetTop, offsetRight, offsetBottom); + + if (mLogEnabled) + Log.i(LOG_TAG, "offsetLeft: " + offsetLeft + ", offsetTop: " + offsetTop + + ", offsetRight: " + offsetRight + ", offsetBottom: " + offsetBottom); + } + + /** + * returns the angle relative to the chart center for the given point on the + * chart in degrees. The angle is always between 0 and 360°, 0° is NORTH, + * 90° is EAST, ... + * + * @param x + * @param y + * @return + */ + public float getAngleForPoint(float x, float y) { + + MPPointF c = getCenterOffsets(); + + double tx = x - c.x, ty = y - c.y; + double length = Math.sqrt(tx * tx + ty * ty); + double r = Math.acos(ty / length); + + float angle = (float) Math.toDegrees(r); + + if (x > c.x) + angle = 360f - angle; + + // add 90° because chart starts EAST + angle = angle + 90f; + + // neutralize overflow + if (angle > 360f) + angle = angle - 360f; + + MPPointF.recycleInstance(c); + + return angle; + } + + /** + * Returns a recyclable MPPointF instance. + * Calculates the position around a center point, depending on the distance + * from the center, and the angle of the position around the center. + * + * @param center + * @param dist + * @param angle in degrees, converted to radians internally + * @return + */ + public MPPointF getPosition(MPPointF center, float dist, float angle) { + + MPPointF p = MPPointF.getInstance(0, 0); + getPosition(center, dist, angle, p); + return p; + } + + public void getPosition(MPPointF center, float dist, float angle, MPPointF outputPoint) { + outputPoint.x = (float) (center.x + dist * Math.cos(Math.toRadians(angle))); + outputPoint.y = (float) (center.y + dist * Math.sin(Math.toRadians(angle))); + } + + /** + * Returns the distance of a certain point on the chart to the center of the + * chart. + * + * @param x + * @param y + * @return + */ + public float distanceToCenter(float x, float y) { + + MPPointF c = getCenterOffsets(); + + float dist = 0f; + + float xDist = 0f; + float yDist = 0f; + + if (x > c.x) { + xDist = x - c.x; + } else { + xDist = c.x - x; + } + + if (y > c.y) { + yDist = y - c.y; + } else { + yDist = c.y - y; + } + + // pythagoras + dist = (float) Math.sqrt(Math.pow(xDist, 2.0) + Math.pow(yDist, 2.0)); + + MPPointF.recycleInstance(c); + + return dist; + } + + /** + * Returns the xIndex for the given angle around the center of the chart. + * Returns -1 if not found / outofbounds. + * + * @param angle + * @return + */ + public abstract int getIndexForAngle(float angle); + + /** + * Set an offset for the rotation of the RadarChart in degrees. Default 270f + * --> top (NORTH) + * + * @param angle + */ + public void setRotationAngle(float angle) { + mRawRotationAngle = angle; + mRotationAngle = Utils.getNormalizedAngle(mRawRotationAngle); + } + + /** + * gets the raw version of the current rotation angle of the pie chart the + * returned value could be any value, negative or positive, outside of the + * 360 degrees. this is used when working with rotation direction, mainly by + * gestures and animations. + * + * @return + */ + public float getRawRotationAngle() { + return mRawRotationAngle; + } + + /** + * gets a normalized version of the current rotation angle of the pie chart, + * which will always be between 0.0 < 360.0 + * + * @return + */ + public float getRotationAngle() { + return mRotationAngle; + } + + /** + * Set this to true to enable the rotation / spinning of the chart by touch. + * Set it to false to disable it. Default: true + * + * @param enabled + */ + public void setRotationEnabled(boolean enabled) { + mRotateEnabled = enabled; + } + + /** + * Returns true if rotation of the chart by touch is enabled, false if not. + * + * @return + */ + public boolean isRotationEnabled() { + return mRotateEnabled; + } + + /** + * Gets the minimum offset (padding) around the chart, defaults to 0.f + */ + public float getMinOffset() { + return mMinOffset; + } + + /** + * Sets the minimum offset (padding) around the chart, defaults to 0.f + */ + public void setMinOffset(float minOffset) { + mMinOffset = minOffset; + } + + /** + * returns the diameter of the pie- or radar-chart + * + * @return + */ + public float getDiameter() { + RectF content = mViewPortHandler.getContentRect(); + content.left += getExtraLeftOffset(); + content.top += getExtraTopOffset(); + content.right -= getExtraRightOffset(); + content.bottom -= getExtraBottomOffset(); + return Math.min(content.width(), content.height()); + } + + /** + * Returns the radius of the chart in pixels. + * + * @return + */ + public abstract float getRadius(); + + /** + * Returns the required offset for the chart legend. + * + * @return + */ + protected abstract float getRequiredLegendOffset(); + + /** + * Returns the base offset needed for the chart without calculating the + * legend size. + * + * @return + */ + protected abstract float getRequiredBaseOffset(); + + @Override + public float getYChartMax() { + // TODO Auto-generated method stub + return 0; + } + + @Override + public float getYChartMin() { + // TODO Auto-generated method stub + return 0; + } + + /** + * ################ ################ ################ ################ + */ + /** CODE BELOW THIS RELATED TO ANIMATION */ + + /** + * Applys a spin animation to the Chart. + * + * @param durationmillis + * @param fromangle + * @param toangle + */ + @SuppressLint("NewApi") + public void spin(int durationmillis, float fromangle, float toangle, EasingFunction easing) { + + setRotationAngle(fromangle); + + ObjectAnimator spinAnimator = ObjectAnimator.ofFloat(this, "rotationAngle", fromangle, + toangle); + spinAnimator.setDuration(durationmillis); + spinAnimator.setInterpolator(easing); + + spinAnimator.addUpdateListener(new AnimatorUpdateListener() { + + @Override + public void onAnimationUpdate(ValueAnimator animation) { + postInvalidate(); + } + }); + spinAnimator.start(); + } +} diff --git a/MPChartLib/src/main/java/com/github/mikephil/charting/charts/RadarChart.java b/MPChartLib/src/main/java/com/github/mikephil/charting/charts/RadarChart.java new file mode 100644 index 00000000..8c088539 --- /dev/null +++ b/MPChartLib/src/main/java/com/github/mikephil/charting/charts/RadarChart.java @@ -0,0 +1,362 @@ + +package com.github.mikephil.charting.charts; + +import android.content.Context; +import android.graphics.Canvas; +import android.graphics.Color; +import android.graphics.RectF; +import android.util.AttributeSet; + +import com.github.mikephil.charting.components.YAxis; +import com.github.mikephil.charting.components.YAxis.AxisDependency; +import com.github.mikephil.charting.data.RadarData; +import com.github.mikephil.charting.highlight.RadarHighlighter; +import com.github.mikephil.charting.renderer.RadarChartRenderer; +import com.github.mikephil.charting.renderer.XAxisRendererRadarChart; +import com.github.mikephil.charting.renderer.YAxisRendererRadarChart; +import com.github.mikephil.charting.utils.Utils; + +/** + * Implementation of the RadarChart, a "spidernet"-like chart. It works best + * when displaying 5-10 entries per DataSet. + * + * @author Philipp Jahoda + */ +public class RadarChart extends PieRadarChartBase<RadarData> { + + /** + * width of the main web lines + */ + private float mWebLineWidth = 2.5f; + + /** + * width of the inner web lines + */ + private float mInnerWebLineWidth = 1.5f; + + /** + * color for the main web lines + */ + private int mWebColor = Color.rgb(122, 122, 122); + + /** + * color for the inner web + */ + private int mWebColorInner = Color.rgb(122, 122, 122); + + /** + * transparency the grid is drawn with (0-255) + */ + private int mWebAlpha = 150; + + /** + * flag indicating if the web lines should be drawn or not + */ + private boolean mDrawWeb = true; + + /** + * modulus that determines how many labels and web-lines are skipped before the next is drawn + */ + private int mSkipWebLineCount = 0; + + /** + * the object reprsenting the y-axis labels + */ + private YAxis mYAxis; + + protected YAxisRendererRadarChart mYAxisRenderer; + protected XAxisRendererRadarChart mXAxisRenderer; + + public RadarChart(Context context) { + super(context); + } + + public RadarChart(Context context, AttributeSet attrs) { + super(context, attrs); + } + + public RadarChart(Context context, AttributeSet attrs, int defStyle) { + super(context, attrs, defStyle); + } + + @Override + protected void init() { + super.init(); + + mYAxis = new YAxis(AxisDependency.LEFT); + mYAxis.setLabelXOffset(10f); + + mWebLineWidth = Utils.convertDpToPixel(1.5f); + mInnerWebLineWidth = Utils.convertDpToPixel(0.75f); + + mRenderer = new RadarChartRenderer(this, mAnimator, mViewPortHandler); + mYAxisRenderer = new YAxisRendererRadarChart(mViewPortHandler, mYAxis, this); + mXAxisRenderer = new XAxisRendererRadarChart(mViewPortHandler, mXAxis, this); + + mHighlighter = new RadarHighlighter(this); + } + + @Override + protected void calcMinMax() { + super.calcMinMax(); + + mYAxis.calculate(mData.getYMin(AxisDependency.LEFT), mData.getYMax(AxisDependency.LEFT)); + mXAxis.calculate(0, mData.getMaxEntryCountSet().getEntryCount()); + } + + @Override + public void notifyDataSetChanged() { + if (mData == null) + return; + + calcMinMax(); + + mYAxisRenderer.computeAxis(mYAxis.mAxisMinimum, mYAxis.mAxisMaximum, mYAxis.isInverted()); + mXAxisRenderer.computeAxis(mXAxis.mAxisMinimum, mXAxis.mAxisMaximum, false); + + if (mLegend != null && !mLegend.isLegendCustom()) + mLegendRenderer.computeLegend(mData); + + calculateOffsets(); + } + + @Override + protected void onDraw(Canvas canvas) { + super.onDraw(canvas); + + if (mData == null) + return; + +// if (mYAxis.isEnabled()) +// mYAxisRenderer.computeAxis(mYAxis.mAxisMinimum, mYAxis.mAxisMaximum, mYAxis.isInverted()); + + if (mXAxis.isEnabled()) + mXAxisRenderer.computeAxis(mXAxis.mAxisMinimum, mXAxis.mAxisMaximum, false); + + mXAxisRenderer.renderAxisLabels(canvas); + + if (mDrawWeb) + mRenderer.drawExtras(canvas); + + if (mYAxis.isEnabled() && mYAxis.isDrawLimitLinesBehindDataEnabled()) + mYAxisRenderer.renderLimitLines(canvas); + + mRenderer.drawData(canvas); + + if (valuesToHighlight()) + mRenderer.drawHighlighted(canvas, mIndicesToHighlight); + + if (mYAxis.isEnabled() && !mYAxis.isDrawLimitLinesBehindDataEnabled()) + mYAxisRenderer.renderLimitLines(canvas); + + mYAxisRenderer.renderAxisLabels(canvas); + + mRenderer.drawValues(canvas); + + mLegendRenderer.renderLegend(canvas); + + drawDescription(canvas); + + drawMarkers(canvas); + } + + /** + * Returns the factor that is needed to transform values into pixels. + * + * @return + */ + public float getFactor() { + RectF content = mViewPortHandler.getContentRect(); + return Math.min(content.width() / 2f, content.height() / 2f) / mYAxis.mAxisRange; + } + + /** + * Returns the angle that each slice in the radar chart occupies. + * + * @return + */ + public float getSliceAngle() { + return 360f / (float) mData.getMaxEntryCountSet().getEntryCount(); + } + + @Override + public int getIndexForAngle(float angle) { + + // take the current angle of the chart into consideration + float a = Utils.getNormalizedAngle(angle - getRotationAngle()); + + float sliceangle = getSliceAngle(); + + int max = mData.getMaxEntryCountSet().getEntryCount(); + + int index = 0; + + for (int i = 0; i < max; i++) { + + float referenceAngle = sliceangle * (i + 1) - sliceangle / 2f; + + if (referenceAngle > a) { + index = i; + break; + } + } + + return index; + } + + /** + * Returns the object that represents all y-labels of the RadarChart. + * + * @return + */ + public YAxis getYAxis() { + return mYAxis; + } + + /** + * Sets the width of the web lines that come from the center. + * + * @param width + */ + public void setWebLineWidth(float width) { + mWebLineWidth = Utils.convertDpToPixel(width); + } + + public float getWebLineWidth() { + return mWebLineWidth; + } + + /** + * Sets the width of the web lines that are in between the lines coming from + * the center. + * + * @param width + */ + public void setWebLineWidthInner(float width) { + mInnerWebLineWidth = Utils.convertDpToPixel(width); + } + + public float getWebLineWidthInner() { + return mInnerWebLineWidth; + } + + /** + * Sets the transparency (alpha) value for all web lines, default: 150, 255 + * = 100% opaque, 0 = 100% transparent + * + * @param alpha + */ + public void setWebAlpha(int alpha) { + mWebAlpha = alpha; + } + + /** + * Returns the alpha value for all web lines. + * + * @return + */ + public int getWebAlpha() { + return mWebAlpha; + } + + /** + * Sets the color for the web lines that come from the center. Don't forget + * to use getResources().getColor(...) when loading a color from the + * resources. Default: Color.rgb(122, 122, 122) + * + * @param color + */ + public void setWebColor(int color) { + mWebColor = color; + } + + public int getWebColor() { + return mWebColor; + } + + /** + * Sets the color for the web lines in between the lines that come from the + * center. Don't forget to use getResources().getColor(...) when loading a + * color from the resources. Default: Color.rgb(122, 122, 122) + * + * @param color + */ + public void setWebColorInner(int color) { + mWebColorInner = color; + } + + public int getWebColorInner() { + return mWebColorInner; + } + + /** + * If set to true, drawing the web is enabled, if set to false, drawing the + * whole web is disabled. Default: true + * + * @param enabled + */ + public void setDrawWeb(boolean enabled) { + mDrawWeb = enabled; + } + + /** + * Sets the number of web-lines that should be skipped on chart web before the + * next one is drawn. This targets the lines that come from the center of the RadarChart. + * + * @param count if count = 1 -> 1 line is skipped in between + */ + public void setSkipWebLineCount(int count) { + + mSkipWebLineCount = Math.max(0, count); + } + + /** + * Returns the modulus that is used for skipping web-lines. + * + * @return + */ + public int getSkipWebLineCount() { + return mSkipWebLineCount; + } + + @Override + protected float getRequiredLegendOffset() { + return mLegendRenderer.getLabelPaint().getTextSize() * 4.f; + } + + @Override + protected float getRequiredBaseOffset() { + return mXAxis.isEnabled() && mXAxis.isDrawLabelsEnabled() ? + mXAxis.mLabelRotatedWidth : + Utils.convertDpToPixel(10f); + } + + @Override + public float getRadius() { + RectF content = mViewPortHandler.getContentRect(); + return Math.min(content.width() / 2f, content.height() / 2f); + } + + /** + * Returns the maximum value this chart can display on it's y-axis. + */ + public float getYChartMax() { + return mYAxis.mAxisMaximum; + } + + /** + * Returns the minimum value this chart can display on it's y-axis. + */ + public float getYChartMin() { + return mYAxis.mAxisMinimum; + } + + /** + * Returns the range of y-values this chart can display. + * + * @return + */ + public float getYRange() { + return mYAxis.mAxisRange; + } +} diff --git a/MPChartLib/src/main/java/com/github/mikephil/charting/charts/ScatterChart.java b/MPChartLib/src/main/java/com/github/mikephil/charting/charts/ScatterChart.java new file mode 100644 index 00000000..37e8395b --- /dev/null +++ b/MPChartLib/src/main/java/com/github/mikephil/charting/charts/ScatterChart.java @@ -0,0 +1,77 @@ + +package com.github.mikephil.charting.charts; + +import android.content.Context; +import android.util.AttributeSet; + +import com.github.mikephil.charting.data.ScatterData; +import com.github.mikephil.charting.interfaces.dataprovider.ScatterDataProvider; +import com.github.mikephil.charting.renderer.ScatterChartRenderer; + +/** + * The ScatterChart. Draws dots, triangles, squares and custom shapes into the + * Chart-View. CIRCLE and SCQUARE offer the best performance, TRIANGLE has the + * worst performance. + * + * @author Philipp Jahoda + */ +public class ScatterChart extends BarLineChartBase<ScatterData> implements ScatterDataProvider { + + public ScatterChart(Context context) { + super(context); + } + + public ScatterChart(Context context, AttributeSet attrs) { + super(context, attrs); + } + + public ScatterChart(Context context, AttributeSet attrs, int defStyle) { + super(context, attrs, defStyle); + } + + + @Override + protected void init() { + super.init(); + + mRenderer = new ScatterChartRenderer(this, mAnimator, mViewPortHandler); + + getXAxis().setSpaceMin(0.5f); + getXAxis().setSpaceMax(0.5f); + } + + @Override + public ScatterData getScatterData() { + return mData; + } + + /** + * Predefined ScatterShapes that allow the specification of a shape a ScatterDataSet should be drawn with. + * If a ScatterShape is specified for a ScatterDataSet, the required renderer is set. + */ + public enum ScatterShape { + + SQUARE("SQUARE"), + CIRCLE("CIRCLE"), + TRIANGLE("TRIANGLE"), + CROSS("CROSS"), + X("X"), + CHEVRON_UP("CHEVRON_UP"), + CHEVRON_DOWN("CHEVRON_DOWN"); + + private final String shapeIdentifier; + + ScatterShape(final String shapeIdentifier) { + this.shapeIdentifier = shapeIdentifier; + } + + @Override + public String toString() { + return shapeIdentifier; + } + + public static ScatterShape[] getAllDefaultShapes() { + return new ScatterShape[]{SQUARE, CIRCLE, TRIANGLE, CROSS, X, CHEVRON_UP, CHEVRON_DOWN}; + } + } +} diff --git a/MPChartLib/src/main/java/com/github/mikephil/charting/components/AxisBase.java b/MPChartLib/src/main/java/com/github/mikephil/charting/components/AxisBase.java new file mode 100644 index 00000000..c90b4fc9 --- /dev/null +++ b/MPChartLib/src/main/java/com/github/mikephil/charting/components/AxisBase.java @@ -0,0 +1,816 @@ + +package com.github.mikephil.charting.components; + +import android.graphics.Color; +import android.graphics.DashPathEffect; +import android.util.Log; + +import com.github.mikephil.charting.formatter.DefaultAxisValueFormatter; +import com.github.mikephil.charting.formatter.IAxisValueFormatter; +import com.github.mikephil.charting.utils.Utils; + +import java.util.ArrayList; +import java.util.List; + +/** + * Base-class of all axes (previously called labels). + * + * @author Philipp Jahoda + */ +public abstract class AxisBase extends ComponentBase { + + /** + * custom formatter that is used instead of the auto-formatter if set + */ + protected IAxisValueFormatter mAxisValueFormatter; + + private int mGridColor = Color.GRAY; + + private float mGridLineWidth = 1f; + + private int mAxisLineColor = Color.GRAY; + + private float mAxisLineWidth = 1f; + + /** + * the actual array of entries + */ + public float[] mEntries = new float[]{}; + + /** + * axis label entries only used for centered labels + */ + public float[] mCenteredEntries = new float[]{}; + + /** + * the number of entries the legend contains + */ + public int mEntryCount; + + /** + * the number of decimal digits to use + */ + public int mDecimals; + + /** + * the number of label entries the axis should have, default 6 + */ + private int mLabelCount = 6; + + /** + * the minimum interval between axis values + */ + protected float mGranularity = 1.0f; + + /** + * When true, axis labels are controlled by the `granularity` property. + * When false, axis values could possibly be repeated. + * This could happen if two adjacent axis values are rounded to same value. + * If using granularity this could be avoided by having fewer axis values visible. + */ + protected boolean mGranularityEnabled = false; + + /** + * if true, the set number of y-labels will be forced + */ + protected boolean mForceLabels = false; + + /** + * flag indicating if the grid lines for this axis should be drawn + */ + protected boolean mDrawGridLines = true; + + /** + * flag that indicates if the line alongside the axis is drawn or not + */ + protected boolean mDrawAxisLine = true; + + /** + * flag that indicates of the labels of this axis should be drawn or not + */ + protected boolean mDrawLabels = true; + + protected boolean mCenterAxisLabels = false; + + /** + * the path effect of the axis line that makes dashed lines possible + */ + private DashPathEffect mAxisLineDashPathEffect = null; + + /** + * the path effect of the grid lines that makes dashed lines possible + */ + private DashPathEffect mGridDashPathEffect = null; + + /** + * array of limit lines that can be set for the axis + */ + protected List<LimitLine> mLimitLines; + + /** + * flag indicating the limit lines layer depth + */ + protected boolean mDrawLimitLineBehindData = false; + + /** + * flag indicating the grid lines layer depth + */ + protected boolean mDrawGridLinesBehindData = true; + + /** + * Extra spacing for `axisMinimum` to be added to automatically calculated `axisMinimum` + */ + protected float mSpaceMin = 0.f; + + /** + * Extra spacing for `axisMaximum` to be added to automatically calculated `axisMaximum` + */ + protected float mSpaceMax = 0.f; + + /** + * flag indicating that the axis-min value has been customized + */ + protected boolean mCustomAxisMin = false; + + /** + * flag indicating that the axis-max value has been customized + */ + protected boolean mCustomAxisMax = false; + + /** + * don't touch this direclty, use setter + */ + public float mAxisMaximum = 0f; + + /** + * don't touch this directly, use setter + */ + public float mAxisMinimum = 0f; + + /** + * the total range of values this axis covers + */ + public float mAxisRange = 0f; + + private int mAxisMinLabels = 2; + private int mAxisMaxLabels = 25; + + /** + * The minumum number of labels on the axis + */ + public int getAxisMinLabels() { + return mAxisMinLabels; + } + + /** + * The minumum number of labels on the axis + */ + public void setAxisMinLabels(int labels) { + if (labels > 0) + mAxisMinLabels = labels; + } + + /** + * The maximum number of labels on the axis + */ + public int getAxisMaxLabels() { + return mAxisMaxLabels; + } + + /** + * The maximum number of labels on the axis + */ + public void setAxisMaxLabels(int labels) { + if (labels > 0) + mAxisMaxLabels = labels; + } + + /** + * default constructor + */ + public AxisBase() { + this.mTextSize = Utils.convertDpToPixel(10f); + this.mXOffset = Utils.convertDpToPixel(5f); + this.mYOffset = Utils.convertDpToPixel(5f); + this.mLimitLines = new ArrayList<LimitLine>(); + } + + /** + * Set this to true to enable drawing the grid lines for this axis. + * + * @param enabled + */ + public void setDrawGridLines(boolean enabled) { + mDrawGridLines = enabled; + } + + /** + * Returns true if drawing grid lines is enabled for this axis. + * + * @return + */ + public boolean isDrawGridLinesEnabled() { + return mDrawGridLines; + } + + /** + * Set this to true if the line alongside the axis should be drawn or not. + * + * @param enabled + */ + public void setDrawAxisLine(boolean enabled) { + mDrawAxisLine = enabled; + } + + /** + * Returns true if the line alongside the axis should be drawn. + * + * @return + */ + public boolean isDrawAxisLineEnabled() { + return mDrawAxisLine; + } + + /** + * Centers the axis labels instead of drawing them at their original position. + * This is useful especially for grouped BarChart. + * + * @param enabled + */ + public void setCenterAxisLabels(boolean enabled) { + mCenterAxisLabels = enabled; + } + + public boolean isCenterAxisLabelsEnabled() { + return mCenterAxisLabels && mEntryCount > 0; + } + + /** + * Sets the color of the grid lines for this axis (the horizontal lines + * coming from each label). + * + * @param color + */ + public void setGridColor(int color) { + mGridColor = color; + } + + /** + * Returns the color of the grid lines for this axis (the horizontal lines + * coming from each label). + * + * @return + */ + public int getGridColor() { + return mGridColor; + } + + /** + * Sets the width of the border surrounding the chart in dp. + * + * @param width + */ + public void setAxisLineWidth(float width) { + mAxisLineWidth = Utils.convertDpToPixel(width); + } + + /** + * Returns the width of the axis line (line alongside the axis). + * + * @return + */ + public float getAxisLineWidth() { + return mAxisLineWidth; + } + + /** + * Sets the width of the grid lines that are drawn away from each axis + * label. + * + * @param width + */ + public void setGridLineWidth(float width) { + mGridLineWidth = Utils.convertDpToPixel(width); + } + + /** + * Returns the width of the grid lines that are drawn away from each axis + * label. + * + * @return + */ + public float getGridLineWidth() { + return mGridLineWidth; + } + + /** + * Sets the color of the border surrounding the chart. + * + * @param color + */ + public void setAxisLineColor(int color) { + mAxisLineColor = color; + } + + /** + * Returns the color of the axis line (line alongside the axis). + * + * @return + */ + public int getAxisLineColor() { + return mAxisLineColor; + } + + /** + * Set this to true to enable drawing the labels of this axis (this will not + * affect drawing the grid lines or axis lines). + * + * @param enabled + */ + public void setDrawLabels(boolean enabled) { + mDrawLabels = enabled; + } + + /** + * Returns true if drawing the labels is enabled for this axis. + * + * @return + */ + public boolean isDrawLabelsEnabled() { + return mDrawLabels; + } + + /** + * Sets the number of label entries for the y-axis max = 25, min = 2, default: 6, be aware + * that this number is not fixed. + * + * @param count the number of y-axis labels that should be displayed + */ + public void setLabelCount(int count) { + + if (count > getAxisMaxLabels()) + count = getAxisMaxLabels(); + if (count < getAxisMinLabels()) + count = getAxisMinLabels(); + + mLabelCount = count; + mForceLabels = false; + } + + /** + * sets the number of label entries for the y-axis max = 25, min = 2, default: 6, be aware + * that this number is not + * fixed (if force == false) and can only be approximated. + * + * @param count the number of y-axis labels that should be displayed + * @param force if enabled, the set label count will be forced, meaning that the exact + * specified count of labels will + * be drawn and evenly distributed alongside the axis - this might cause labels + * to have uneven values + */ + public void setLabelCount(int count, boolean force) { + + setLabelCount(count); + mForceLabels = force; + } + + /** + * Returns true if focing the y-label count is enabled. Default: false + * + * @return + */ + public boolean isForceLabelsEnabled() { + return mForceLabels; + } + + /** + * Returns the number of label entries the y-axis should have + * + * @return + */ + public int getLabelCount() { + return mLabelCount; + } + + /** + * @return true if granularity is enabled + */ + public boolean isGranularityEnabled() { + return mGranularityEnabled; + } + + /** + * Enabled/disable granularity control on axis value intervals. If enabled, the axis + * interval is not allowed to go below a certain granularity. Default: false + * + * @param enabled + */ + public void setGranularityEnabled(boolean enabled) { + mGranularityEnabled = enabled; + } + + /** + * @return the minimum interval between axis values + */ + public float getGranularity() { + return mGranularity; + } + + /** + * Set a minimum interval for the axis when zooming in. The axis is not allowed to go below + * that limit. This can be used to avoid label duplicating when zooming in. + * + * @param granularity + */ + public void setGranularity(float granularity) { + mGranularity = granularity; + // set this to true if it was disabled, as it makes no sense to call this method with granularity disabled + mGranularityEnabled = true; + } + + /** + * Adds a new LimitLine to this axis. + * + * @param l + */ + public void addLimitLine(LimitLine l) { + mLimitLines.add(l); + + if (mLimitLines.size() > 6) { + Log.e("MPAndroiChart", + "Warning! You have more than 6 LimitLines on your axis, do you really want " + + "that?"); + } + } + + /** + * Removes the specified LimitLine from the axis. + * + * @param l + */ + public void removeLimitLine(LimitLine l) { + mLimitLines.remove(l); + } + + /** + * Removes all LimitLines from the axis. + */ + public void removeAllLimitLines() { + mLimitLines.clear(); + } + + /** + * Returns the LimitLines of this axis. + * + * @return + */ + public List<LimitLine> getLimitLines() { + return mLimitLines; + } + + /** + * If this is set to true, the LimitLines are drawn behind the actual data, + * otherwise on top. Default: false + * + * @param enabled + */ + public void setDrawLimitLinesBehindData(boolean enabled) { + mDrawLimitLineBehindData = enabled; + } + + public boolean isDrawLimitLinesBehindDataEnabled() { + return mDrawLimitLineBehindData; + } + + /** + * If this is set to false, the grid lines are draw on top of the actual data, + * otherwise behind. Default: true + * + * @param enabled + */ + public void setDrawGridLinesBehindData(boolean enabled) { mDrawGridLinesBehindData = enabled; } + + public boolean isDrawGridLinesBehindDataEnabled() { + return mDrawGridLinesBehindData; + } + + /** + * Returns the longest formatted label (in terms of characters), this axis + * contains. + * + * @return + */ + public String getLongestLabel() { + + String longest = ""; + + for (int i = 0; i < mEntries.length; i++) { + String text = getFormattedLabel(i); + + if (text != null && longest.length() < text.length()) + longest = text; + } + + return longest; + } + + public String getFormattedLabel(int index) { + + if (index < 0 || index >= mEntries.length) + return ""; + else + return getValueFormatter().getFormattedValue(mEntries[index], this); + } + + /** + * Sets the formatter to be used for formatting the axis labels. If no formatter is set, the + * chart will + * automatically determine a reasonable formatting (concerning decimals) for all the values + * that are drawn inside + * the chart. Use chart.getDefaultValueFormatter() to use the formatter calculated by the chart. + * + * @param f + */ + public void setValueFormatter(IAxisValueFormatter f) { + + if (f == null) + mAxisValueFormatter = new DefaultAxisValueFormatter(mDecimals); + else + mAxisValueFormatter = f; + } + + /** + * Returns the formatter used for formatting the axis labels. + * + * @return + */ + public IAxisValueFormatter getValueFormatter() { + + if (mAxisValueFormatter == null || + (mAxisValueFormatter instanceof DefaultAxisValueFormatter && + ((DefaultAxisValueFormatter)mAxisValueFormatter).getDecimalDigits() != mDecimals)) + mAxisValueFormatter = new DefaultAxisValueFormatter(mDecimals); + + return mAxisValueFormatter; + } + + /** + * Enables the grid line to be drawn in dashed mode, e.g. like this + * "- - - - - -". THIS ONLY WORKS IF HARDWARE-ACCELERATION IS TURNED OFF. + * Keep in mind that hardware acceleration boosts performance. + * + * @param lineLength the length of the line pieces + * @param spaceLength the length of space in between the pieces + * @param phase offset, in degrees (normally, use 0) + */ + public void enableGridDashedLine(float lineLength, float spaceLength, float phase) { + mGridDashPathEffect = new DashPathEffect(new float[]{ + lineLength, spaceLength + }, phase); + } + + /** + * Enables the grid line to be drawn in dashed mode, e.g. like this + * "- - - - - -". THIS ONLY WORKS IF HARDWARE-ACCELERATION IS TURNED OFF. + * Keep in mind that hardware acceleration boosts performance. + * + * @param effect the DashPathEffect + */ + public void setGridDashedLine(DashPathEffect effect) { + mGridDashPathEffect = effect; + } + + /** + * Disables the grid line to be drawn in dashed mode. + */ + public void disableGridDashedLine() { + mGridDashPathEffect = null; + } + + /** + * Returns true if the grid dashed-line effect is enabled, false if not. + * + * @return + */ + public boolean isGridDashedLineEnabled() { + return mGridDashPathEffect == null ? false : true; + } + + /** + * returns the DashPathEffect that is set for grid line + * + * @return + */ + public DashPathEffect getGridDashPathEffect() { + return mGridDashPathEffect; + } + + + /** + * Enables the axis line to be drawn in dashed mode, e.g. like this + * "- - - - - -". THIS ONLY WORKS IF HARDWARE-ACCELERATION IS TURNED OFF. + * Keep in mind that hardware acceleration boosts performance. + * + * @param lineLength the length of the line pieces + * @param spaceLength the length of space in between the pieces + * @param phase offset, in degrees (normally, use 0) + */ + public void enableAxisLineDashedLine(float lineLength, float spaceLength, float phase) { + mAxisLineDashPathEffect = new DashPathEffect(new float[]{ + lineLength, spaceLength + }, phase); + } + + /** + * Enables the axis line to be drawn in dashed mode, e.g. like this + * "- - - - - -". THIS ONLY WORKS IF HARDWARE-ACCELERATION IS TURNED OFF. + * Keep in mind that hardware acceleration boosts performance. + * + * @param effect the DashPathEffect + */ + public void setAxisLineDashedLine(DashPathEffect effect) { + mAxisLineDashPathEffect = effect; + } + + /** + * Disables the axis line to be drawn in dashed mode. + */ + public void disableAxisLineDashedLine() { + mAxisLineDashPathEffect = null; + } + + /** + * Returns true if the axis dashed-line effect is enabled, false if not. + * + * @return + */ + public boolean isAxisLineDashedLineEnabled() { + return mAxisLineDashPathEffect == null ? false : true; + } + + /** + * returns the DashPathEffect that is set for axis line + * + * @return + */ + public DashPathEffect getAxisLineDashPathEffect() { + return mAxisLineDashPathEffect; + } + + /** + * ###### BELOW CODE RELATED TO CUSTOM AXIS VALUES ###### + */ + + public float getAxisMaximum() { + return mAxisMaximum; + } + + public float getAxisMinimum() { + return mAxisMinimum; + } + + /** + * By calling this method, any custom maximum value that has been previously set is reseted, + * and the calculation is + * done automatically. + */ + public void resetAxisMaximum() { + mCustomAxisMax = false; + } + + /** + * Returns true if the axis max value has been customized (and is not calculated automatically) + * + * @return + */ + public boolean isAxisMaxCustom() { + return mCustomAxisMax; + } + + /** + * By calling this method, any custom minimum value that has been previously set is reseted, + * and the calculation is + * done automatically. + */ + public void resetAxisMinimum() { + mCustomAxisMin = false; + } + + /** + * Returns true if the axis min value has been customized (and is not calculated automatically) + * + * @return + */ + public boolean isAxisMinCustom() { + return mCustomAxisMin; + } + + /** + * Set a custom minimum value for this axis. If set, this value will not be calculated + * automatically depending on + * the provided data. Use resetAxisMinValue() to undo this. Do not forget to call + * setStartAtZero(false) if you use + * this method. Otherwise, the axis-minimum value will still be forced to 0. + * + * @param min + */ + public void setAxisMinimum(float min) { + mCustomAxisMin = true; + mAxisMinimum = min; + this.mAxisRange = Math.abs(mAxisMaximum - min); + } + + /** + * Use setAxisMinimum(...) instead. + * + * @param min + */ + @Deprecated + public void setAxisMinValue(float min) { + setAxisMinimum(min); + } + + /** + * Set a custom maximum value for this axis. If set, this value will not be calculated + * automatically depending on + * the provided data. Use resetAxisMaxValue() to undo this. + * + * @param max + */ + public void setAxisMaximum(float max) { + mCustomAxisMax = true; + mAxisMaximum = max; + this.mAxisRange = Math.abs(max - mAxisMinimum); + } + + /** + * Use setAxisMaximum(...) instead. + * + * @param max + */ + @Deprecated + public void setAxisMaxValue(float max) { + setAxisMaximum(max); + } + + /** + * Calculates the minimum / maximum and range values of the axis with the given + * minimum and maximum values from the chart data. + * + * @param dataMin the min value according to chart data + * @param dataMax the max value according to chart data + */ + public void calculate(float dataMin, float dataMax) { + + // if custom, use value as is, else use data value + float min = mCustomAxisMin ? mAxisMinimum : (dataMin - mSpaceMin); + float max = mCustomAxisMax ? mAxisMaximum : (dataMax + mSpaceMax); + + // temporary range (before calculations) + float range = Math.abs(max - min); + + // in case all values are equal + if (range == 0f) { + max = max + 1f; + min = min - 1f; + } + + this.mAxisMinimum = min; + this.mAxisMaximum = max; + + // actual range + this.mAxisRange = Math.abs(max - min); + } + + /** + * Gets extra spacing for `axisMinimum` to be added to automatically calculated `axisMinimum` + */ + public float getSpaceMin() + { + return mSpaceMin; + } + + /** + * Sets extra spacing for `axisMinimum` to be added to automatically calculated `axisMinimum` + */ + public void setSpaceMin(float mSpaceMin) + { + this.mSpaceMin = mSpaceMin; + } + + /** + * Gets extra spacing for `axisMaximum` to be added to automatically calculated `axisMaximum` + */ + public float getSpaceMax() + { + return mSpaceMax; + } + + /** + * Sets extra spacing for `axisMaximum` to be added to automatically calculated `axisMaximum` + */ + public void setSpaceMax(float mSpaceMax) + { + this.mSpaceMax = mSpaceMax; + } +} diff --git a/MPChartLib/src/main/java/com/github/mikephil/charting/components/ComponentBase.java b/MPChartLib/src/main/java/com/github/mikephil/charting/components/ComponentBase.java new file mode 100644 index 00000000..d3a1d4d8 --- /dev/null +++ b/MPChartLib/src/main/java/com/github/mikephil/charting/components/ComponentBase.java @@ -0,0 +1,173 @@ + +package com.github.mikephil.charting.components; + +import android.graphics.Color; +import android.graphics.Typeface; + +import com.github.mikephil.charting.utils.Utils; + +/** + * This class encapsulates everything both Axis, Legend and LimitLines have in common. + * + * @author Philipp Jahoda + */ +public abstract class ComponentBase { + + /** + * flag that indicates if this axis / legend is enabled or not + */ + protected boolean mEnabled = true; + + /** + * the offset in pixels this component has on the x-axis + */ + protected float mXOffset = 5f; + + /** + * the offset in pixels this component has on the Y-axis + */ + protected float mYOffset = 5f; + + /** + * the typeface used for the labels + */ + protected Typeface mTypeface = null; + + /** + * the text size of the labels + */ + protected float mTextSize = Utils.convertDpToPixel(10f); + + /** + * the text color to use for the labels + */ + protected int mTextColor = Color.BLACK; + + + public ComponentBase() { + + } + + /** + * Returns the used offset on the x-axis for drawing the axis or legend + * labels. This offset is applied before and after the label. + * + * @return + */ + public float getXOffset() { + return mXOffset; + } + + /** + * Sets the used x-axis offset for the labels on this axis. + * + * @param xOffset + */ + public void setXOffset(float xOffset) { + mXOffset = Utils.convertDpToPixel(xOffset); + } + + /** + * Returns the used offset on the x-axis for drawing the axis labels. This + * offset is applied before and after the label. + * + * @return + */ + public float getYOffset() { + return mYOffset; + } + + /** + * Sets the used y-axis offset for the labels on this axis. For the legend, + * higher offset means the legend as a whole will be placed further away + * from the top. + * + * @param yOffset + */ + public void setYOffset(float yOffset) { + mYOffset = Utils.convertDpToPixel(yOffset); + } + + /** + * returns the Typeface used for the labels, returns null if none is set + * + * @return + */ + public Typeface getTypeface() { + return mTypeface; + } + + /** + * sets a specific Typeface for the labels + * + * @param tf + */ + public void setTypeface(Typeface tf) { + mTypeface = tf; + } + + /** + * sets the size of the label text in density pixels min = 6f, max = 24f, default + * 10f + * + * @param size the text size, in DP + */ + public void setTextSize(float size) { + + if (size > 24f) + size = 24f; + if (size < 6f) + size = 6f; + + mTextSize = Utils.convertDpToPixel(size); + } + + /** + * returns the text size that is currently set for the labels, in pixels + * + * @return + */ + public float getTextSize() { + return mTextSize; + } + + + /** + * Sets the text color to use for the labels. Make sure to use + * getResources().getColor(...) when using a color from the resources. + * + * @param color + */ + public void setTextColor(int color) { + mTextColor = color; + } + + /** + * Returns the text color that is set for the labels. + * + * @return + */ + public int getTextColor() { + return mTextColor; + } + + /** + * Set this to true if this component should be enabled (should be drawn), + * false if not. If disabled, nothing of this component will be drawn. + * Default: true + * + * @param enabled + */ + public void setEnabled(boolean enabled) { + mEnabled = enabled; + } + + /** + * Returns true if this comonent is enabled (should be drawn), false if not. + * + * @return + */ + public boolean isEnabled() { + return mEnabled; + } +} diff --git a/MPChartLib/src/main/java/com/github/mikephil/charting/components/Description.java b/MPChartLib/src/main/java/com/github/mikephil/charting/components/Description.java new file mode 100644 index 00000000..18294a32 --- /dev/null +++ b/MPChartLib/src/main/java/com/github/mikephil/charting/components/Description.java @@ -0,0 +1,95 @@ +package com.github.mikephil.charting.components; + +import android.graphics.Paint; + +import com.github.mikephil.charting.utils.MPPointF; +import com.github.mikephil.charting.utils.Utils; + +/** + * Created by Philipp Jahoda on 17/09/16. + */ +public class Description extends ComponentBase { + + /** + * the text used in the description + */ + private String text = "Description Label"; + + /** + * the custom position of the description text + */ + private MPPointF mPosition; + + /** + * the alignment of the description text + */ + private Paint.Align mTextAlign = Paint.Align.RIGHT; + + public Description() { + super(); + + // default size + mTextSize = Utils.convertDpToPixel(8f); + } + + /** + * Sets the text to be shown as the description. + * Never set this to null as this will cause nullpointer exception when drawing with Android Canvas. + * + * @param text + */ + public void setText(String text) { + this.text = text; + } + + /** + * Returns the description text. + * + * @return + */ + public String getText() { + return text; + } + + /** + * Sets a custom position for the description text in pixels on the screen. + * + * @param x - xcoordinate + * @param y - ycoordinate + */ + public void setPosition(float x, float y) { + if (mPosition == null) { + mPosition = MPPointF.getInstance(x, y); + } else { + mPosition.x = x; + mPosition.y = y; + } + } + + /** + * Returns the customized position of the description, or null if none set. + * + * @return + */ + public MPPointF getPosition() { + return mPosition; + } + + /** + * Sets the text alignment of the description text. Default RIGHT. + * + * @param align + */ + public void setTextAlign(Paint.Align align) { + this.mTextAlign = align; + } + + /** + * Returns the text alignment of the description. + * + * @return + */ + public Paint.Align getTextAlign() { + return mTextAlign; + } +} diff --git a/MPChartLib/src/main/java/com/github/mikephil/charting/components/IMarker.java b/MPChartLib/src/main/java/com/github/mikephil/charting/components/IMarker.java new file mode 100644 index 00000000..3b8ca43c --- /dev/null +++ b/MPChartLib/src/main/java/com/github/mikephil/charting/components/IMarker.java @@ -0,0 +1,47 @@ +package com.github.mikephil.charting.components; + +import android.graphics.Canvas; + +import com.github.mikephil.charting.data.Entry; +import com.github.mikephil.charting.highlight.Highlight; +import com.github.mikephil.charting.utils.MPPointF; + +public interface IMarker { + + /** + * @return The desired (general) offset you wish the IMarker to have on the x- and y-axis. + * By returning x: -(width / 2) you will center the IMarker horizontally. + * By returning y: -(height / 2) you will center the IMarker vertically. + */ + MPPointF getOffset(); + + /** + * @return The offset for drawing at the specific `point`. This allows conditional adjusting of the Marker position. + * If you have no adjustments to make, return getOffset(). + * + * @param posX This is the X position at which the marker wants to be drawn. + * You can adjust the offset conditionally based on this argument. + * @param posY This is the X position at which the marker wants to be drawn. + * You can adjust the offset conditionally based on this argument. + */ + MPPointF getOffsetForDrawingAtPoint(float posX, float posY); + + /** + * This method enables a specified custom IMarker to update it's content every time the IMarker is redrawn. + * + * @param e The Entry the IMarker belongs to. This can also be any subclass of Entry, like BarEntry or + * CandleEntry, simply cast it at runtime. + * @param highlight The highlight object contains information about the highlighted value such as it's dataset-index, the + * selected range or stack-index (only stacked bar entries). + */ + void refreshContent(Entry e, Highlight highlight); + + /** + * Draws the IMarker on the given position on the screen with the given Canvas object. + * + * @param canvas + * @param posX + * @param posY + */ + void draw(Canvas canvas, float posX, float posY); +} diff --git a/MPChartLib/src/main/java/com/github/mikephil/charting/components/Legend.java b/MPChartLib/src/main/java/com/github/mikephil/charting/components/Legend.java new file mode 100644 index 00000000..70812925 --- /dev/null +++ b/MPChartLib/src/main/java/com/github/mikephil/charting/components/Legend.java @@ -0,0 +1,825 @@ +package com.github.mikephil.charting.components; + +import android.graphics.DashPathEffect; +import android.graphics.Paint; + +import com.github.mikephil.charting.utils.ColorTemplate; +import com.github.mikephil.charting.utils.FSize; +import com.github.mikephil.charting.utils.Utils; +import com.github.mikephil.charting.utils.ViewPortHandler; + +import java.util.ArrayList; +import java.util.List; + +/** + * Class representing the legend of the chart. The legend will contain one entry + * per color and DataSet. Multiple colors in one DataSet are grouped together. + * The legend object is NOT available before setting data to the chart. + * + * @author Philipp Jahoda + */ +public class Legend extends ComponentBase { + + public enum LegendForm { + /** + * Avoid drawing a form + */ + NONE, + + /** + * Do not draw the a form, but leave space for it + */ + EMPTY, + + /** + * Use default (default dataset's form to the legend's form) + */ + DEFAULT, + + /** + * Draw a square + */ + SQUARE, + + /** + * Draw a circle + */ + CIRCLE, + + /** + * Draw a horizontal line + */ + LINE + } + + public enum LegendHorizontalAlignment { + LEFT, CENTER, RIGHT + } + + public enum LegendVerticalAlignment { + TOP, CENTER, BOTTOM + } + + public enum LegendOrientation { + HORIZONTAL, VERTICAL + } + + public enum LegendDirection { + LEFT_TO_RIGHT, RIGHT_TO_LEFT + } + + /** + * The legend entries array + */ + private LegendEntry[] mEntries = new LegendEntry[]{}; + + /** + * Entries that will be appended to the end of the auto calculated entries after calculating the legend. + * (if the legend has already been calculated, you will need to call notifyDataSetChanged() to let the changes take effect) + */ + private LegendEntry[] mExtraEntries; + + /** + * Are the legend labels/colors a custom value or auto calculated? If false, + * then it's auto, if true, then custom. default false (automatic legend) + */ + private boolean mIsLegendCustom = false; + + private LegendHorizontalAlignment mHorizontalAlignment = LegendHorizontalAlignment.LEFT; + private LegendVerticalAlignment mVerticalAlignment = LegendVerticalAlignment.BOTTOM; + private LegendOrientation mOrientation = LegendOrientation.HORIZONTAL; + private boolean mDrawInside = false; + + /** + * the text direction for the legend + */ + private LegendDirection mDirection = LegendDirection.LEFT_TO_RIGHT; + + /** + * the shape/form the legend colors are drawn in + */ + private LegendForm mShape = LegendForm.SQUARE; + + /** + * the size of the legend forms/shapes + */ + private float mFormSize = 8f; + + /** + * the size of the legend forms/shapes + */ + private float mFormLineWidth = 3f; + + /** + * Line dash path effect used for shapes that consist of lines. + */ + private DashPathEffect mFormLineDashEffect = null; + + /** + * the space between the legend entries on a horizontal axis, default 6f + */ + private float mXEntrySpace = 6f; + + /** + * the space between the legend entries on a vertical axis, default 5f + */ + private float mYEntrySpace = 0f; + + /** + * the space between the legend entries on a vertical axis, default 2f + * private float mYEntrySpace = 2f; /** the space between the form and the + * actual label/text + */ + private float mFormToTextSpace = 5f; + + /** + * the space that should be left between stacked forms + */ + private float mStackSpace = 3f; + + /** + * the maximum relative size out of the whole chart view in percent + */ + private float mMaxSizePercent = 0.95f; + + /** + * default constructor + */ + public Legend() { + + this.mTextSize = Utils.convertDpToPixel(10f); + this.mXOffset = Utils.convertDpToPixel(5f); + this.mYOffset = Utils.convertDpToPixel(3f); // 2 + } + + /** + * Constructor. Provide entries for the legend. + * + * @param entries + */ + public Legend(LegendEntry[] entries) { + this(); + + if (entries == null) { + throw new IllegalArgumentException("entries array is NULL"); + } + + this.mEntries = entries; + } + + /** + * This method sets the automatically computed colors for the legend. Use setCustom(...) to set custom colors. + * + * @param entries + */ + public void setEntries(List<LegendEntry> entries) { + mEntries = entries.toArray(new LegendEntry[entries.size()]); + } + + public LegendEntry[] getEntries() { + return mEntries; + } + + /** + * returns the maximum length in pixels across all legend labels + formsize + * + formtotextspace + * + * @param p the paint object used for rendering the text + * @return + */ + public float getMaximumEntryWidth(Paint p) { + + float max = 0f; + float maxFormSize = 0f; + float formToTextSpace = Utils.convertDpToPixel(mFormToTextSpace); + + for (LegendEntry entry : mEntries) { + final float formSize = Utils.convertDpToPixel( + Float.isNaN(entry.formSize) + ? mFormSize : entry.formSize); + if (formSize > maxFormSize) + maxFormSize = formSize; + + String label = entry.label; + if (label == null) continue; + + float length = (float) Utils.calcTextWidth(p, label); + + if (length > max) + max = length; + } + + return max + maxFormSize + formToTextSpace; + } + + /** + * returns the maximum height in pixels across all legend labels + * + * @param p the paint object used for rendering the text + * @return + */ + public float getMaximumEntryHeight(Paint p) { + + float max = 0f; + + for (LegendEntry entry : mEntries) { + String label = entry.label; + if (label == null) continue; + + float length = (float) Utils.calcTextHeight(p, label); + + if (length > max) + max = length; + } + + return max; + } + + public LegendEntry[] getExtraEntries() { + + return mExtraEntries; + } + + public void setExtra(List<LegendEntry> entries) { + mExtraEntries = entries.toArray(new LegendEntry[entries.size()]); + } + + public void setExtra(LegendEntry[] entries) { + if (entries == null) + entries = new LegendEntry[]{}; + mExtraEntries = entries; + } + + /** + * Entries that will be appended to the end of the auto calculated + * entries after calculating the legend. + * (if the legend has already been calculated, you will need to call notifyDataSetChanged() + * to let the changes take effect) + */ + public void setExtra(int[] colors, String[] labels) { + + List<LegendEntry> entries = new ArrayList<>(); + + for (int i = 0; i < Math.min(colors.length, labels.length); i++) { + final LegendEntry entry = new LegendEntry(); + entry.formColor = colors[i]; + entry.label = labels[i]; + + if (entry.formColor == ColorTemplate.COLOR_SKIP || + entry.formColor == 0) + entry.form = LegendForm.NONE; + else if (entry.formColor == ColorTemplate.COLOR_NONE) + entry.form = LegendForm.EMPTY; + + entries.add(entry); + } + + mExtraEntries = entries.toArray(new LegendEntry[entries.size()]); + } + + /** + * Sets a custom legend's entries array. + * * A null label will start a group. + * This will disable the feature that automatically calculates the legend + * entries from the datasets. + * Call resetCustom() to re-enable automatic calculation (and then + * notifyDataSetChanged() is needed to auto-calculate the legend again) + */ + public void setCustom(LegendEntry[] entries) { + + mEntries = entries; + mIsLegendCustom = true; + } + + /** + * Sets a custom legend's entries array. + * * A null label will start a group. + * This will disable the feature that automatically calculates the legend + * entries from the datasets. + * Call resetCustom() to re-enable automatic calculation (and then + * notifyDataSetChanged() is needed to auto-calculate the legend again) + */ + public void setCustom(List<LegendEntry> entries) { + + mEntries = entries.toArray(new LegendEntry[entries.size()]); + mIsLegendCustom = true; + } + + /** + * Calling this will disable the custom legend entries (set by + * setCustom(...)). Instead, the entries will again be calculated + * automatically (after notifyDataSetChanged() is called). + */ + public void resetCustom() { + mIsLegendCustom = false; + } + + /** + * @return true if a custom legend entries has been set default + * false (automatic legend) + */ + public boolean isLegendCustom() { + return mIsLegendCustom; + } + + /** + * returns the horizontal alignment of the legend + * + * @return + */ + public LegendHorizontalAlignment getHorizontalAlignment() { + return mHorizontalAlignment; + } + + /** + * sets the horizontal alignment of the legend + * + * @param value + */ + public void setHorizontalAlignment(LegendHorizontalAlignment value) { + mHorizontalAlignment = value; + } + + /** + * returns the vertical alignment of the legend + * + * @return + */ + public LegendVerticalAlignment getVerticalAlignment() { + return mVerticalAlignment; + } + + /** + * sets the vertical alignment of the legend + * + * @param value + */ + public void setVerticalAlignment(LegendVerticalAlignment value) { + mVerticalAlignment = value; + } + + /** + * returns the orientation of the legend + * + * @return + */ + public LegendOrientation getOrientation() { + return mOrientation; + } + + /** + * sets the orientation of the legend + * + * @param value + */ + public void setOrientation(LegendOrientation value) { + mOrientation = value; + } + + /** + * returns whether the legend will draw inside the chart or outside + * + * @return + */ + public boolean isDrawInsideEnabled() { + return mDrawInside; + } + + /** + * sets whether the legend will draw inside the chart or outside + * + * @param value + */ + public void setDrawInside(boolean value) { + mDrawInside = value; + } + + /** + * returns the text direction of the legend + * + * @return + */ + public LegendDirection getDirection() { + return mDirection; + } + + /** + * sets the text direction of the legend + * + * @param pos + */ + public void setDirection(LegendDirection pos) { + mDirection = pos; + } + + /** + * returns the current form/shape that is set for the legend + * + * @return + */ + public LegendForm getForm() { + return mShape; + } + + /** + * sets the form/shape of the legend forms + * + * @param shape + */ + public void setForm(LegendForm shape) { + mShape = shape; + } + + /** + * sets the size in dp of the legend forms, default 8f + * + * @param size + */ + public void setFormSize(float size) { + mFormSize = size; + } + + /** + * returns the size in dp of the legend forms + * + * @return + */ + public float getFormSize() { + return mFormSize; + } + + /** + * sets the line width in dp for forms that consist of lines, default 3f + * + * @param size + */ + public void setFormLineWidth(float size) { + mFormLineWidth = size; + } + + /** + * returns the line width in dp for drawing forms that consist of lines + * + * @return + */ + public float getFormLineWidth() { + return mFormLineWidth; + } + + /** + * Sets the line dash path effect used for shapes that consist of lines. + * + * @param dashPathEffect + */ + public void setFormLineDashEffect(DashPathEffect dashPathEffect) { + mFormLineDashEffect = dashPathEffect; + } + + /** + * @return The line dash path effect used for shapes that consist of lines. + */ + public DashPathEffect getFormLineDashEffect() { + return mFormLineDashEffect; + } + + /** + * returns the space between the legend entries on a horizontal axis in + * pixels + * + * @return + */ + public float getXEntrySpace() { + return mXEntrySpace; + } + + /** + * sets the space between the legend entries on a horizontal axis in pixels, + * converts to dp internally + * + * @param space + */ + public void setXEntrySpace(float space) { + mXEntrySpace = space; + } + + /** + * returns the space between the legend entries on a vertical axis in pixels + * + * @return + */ + public float getYEntrySpace() { + return mYEntrySpace; + } + + /** + * sets the space between the legend entries on a vertical axis in pixels, + * converts to dp internally + * + * @param space + */ + public void setYEntrySpace(float space) { + mYEntrySpace = space; + } + + /** + * returns the space between the form and the actual label/text + * + * @return + */ + public float getFormToTextSpace() { + return mFormToTextSpace; + } + + /** + * sets the space between the form and the actual label/text, converts to dp + * internally + * + * @param space + */ + public void setFormToTextSpace(float space) { + this.mFormToTextSpace = space; + } + + /** + * returns the space that is left out between stacked forms (with no label) + * + * @return + */ + public float getStackSpace() { + return mStackSpace; + } + + /** + * sets the space that is left out between stacked forms (with no label) + * + * @param space + */ + public void setStackSpace(float space) { + mStackSpace = space; + } + + /** + * the total width of the legend (needed width space) + */ + public float mNeededWidth = 0f; + + /** + * the total height of the legend (needed height space) + */ + public float mNeededHeight = 0f; + + public float mTextHeightMax = 0f; + + public float mTextWidthMax = 0f; + + /** + * flag that indicates if word wrapping is enabled + */ + private boolean mWordWrapEnabled = false; + + /** + * Should the legend word wrap? / this is currently supported only for: + * BelowChartLeft, BelowChartRight, BelowChartCenter. / note that word + * wrapping a legend takes a toll on performance. / you may want to set + * maxSizePercent when word wrapping, to set the point where the text wraps. + * / default: false + * + * @param enabled + */ + public void setWordWrapEnabled(boolean enabled) { + mWordWrapEnabled = enabled; + } + + /** + * If this is set, then word wrapping the legend is enabled. This means the + * legend will not be cut off if too long. + * + * @return + */ + public boolean isWordWrapEnabled() { + return mWordWrapEnabled; + } + + /** + * The maximum relative size out of the whole chart view. / If the legend is + * to the right/left of the chart, then this affects the width of the + * legend. / If the legend is to the top/bottom of the chart, then this + * affects the height of the legend. / If the legend is the center of the + * piechart, then this defines the size of the rectangular bounds out of the + * size of the "hole". / default: 0.95f (95%) + * + * @return + */ + public float getMaxSizePercent() { + return mMaxSizePercent; + } + + /** + * The maximum relative size out of the whole chart view. / If + * the legend is to the right/left of the chart, then this affects the width + * of the legend. / If the legend is to the top/bottom of the chart, then + * this affects the height of the legend. / default: 0.95f (95%) + * + * @param maxSize + */ + public void setMaxSizePercent(float maxSize) { + mMaxSizePercent = maxSize; + } + + private List<FSize> mCalculatedLabelSizes = new ArrayList<>(16); + private List<Boolean> mCalculatedLabelBreakPoints = new ArrayList<>(16); + private List<FSize> mCalculatedLineSizes = new ArrayList<>(16); + + public List<FSize> getCalculatedLabelSizes() { + return mCalculatedLabelSizes; + } + + public List<Boolean> getCalculatedLabelBreakPoints() { + return mCalculatedLabelBreakPoints; + } + + public List<FSize> getCalculatedLineSizes() { + return mCalculatedLineSizes; + } + + /** + * Calculates the dimensions of the Legend. This includes the maximum width + * and height of a single entry, as well as the total width and height of + * the Legend. + * + * @param labelpaint + */ + public void calculateDimensions(Paint labelpaint, ViewPortHandler viewPortHandler) { + + float defaultFormSize = Utils.convertDpToPixel(mFormSize); + float stackSpace = Utils.convertDpToPixel(mStackSpace); + float formToTextSpace = Utils.convertDpToPixel(mFormToTextSpace); + float xEntrySpace = Utils.convertDpToPixel(mXEntrySpace); + float yEntrySpace = Utils.convertDpToPixel(mYEntrySpace); + boolean wordWrapEnabled = mWordWrapEnabled; + LegendEntry[] entries = mEntries; + int entryCount = entries.length; + + mTextWidthMax = getMaximumEntryWidth(labelpaint); + mTextHeightMax = getMaximumEntryHeight(labelpaint); + + switch (mOrientation) { + case VERTICAL: { + + float maxWidth = 0f, maxHeight = 0f, width = 0f; + float labelLineHeight = Utils.getLineHeight(labelpaint); + boolean wasStacked = false; + + for (int i = 0; i < entryCount; i++) { + + LegendEntry e = entries[i]; + boolean drawingForm = e.form != LegendForm.NONE; + float formSize = Float.isNaN(e.formSize) + ? defaultFormSize + : Utils.convertDpToPixel(e.formSize); + String label = e.label; + + if (!wasStacked) + width = 0.f; + + if (drawingForm) { + if (wasStacked) + width += stackSpace; + width += formSize; + } + + // grouped forms have null labels + if (label != null) { + + // make a step to the left + if (drawingForm && !wasStacked) + width += formToTextSpace; + else if (wasStacked) { + maxWidth = Math.max(maxWidth, width); + maxHeight += labelLineHeight + yEntrySpace; + width = 0.f; + wasStacked = false; + } + + width += Utils.calcTextWidth(labelpaint, label); + + maxHeight += labelLineHeight + yEntrySpace; + } else { + wasStacked = true; + width += formSize; + if (i < entryCount - 1) + width += stackSpace; + } + + maxWidth = Math.max(maxWidth, width); + } + + mNeededWidth = maxWidth; + mNeededHeight = maxHeight; + + break; + } + case HORIZONTAL: { + + float labelLineHeight = Utils.getLineHeight(labelpaint); + float labelLineSpacing = Utils.getLineSpacing(labelpaint) + yEntrySpace; + float contentWidth = viewPortHandler.contentWidth() * mMaxSizePercent; + + // Start calculating layout + float maxLineWidth = 0.f; + float currentLineWidth = 0.f; + float requiredWidth = 0.f; + int stackedStartIndex = -1; + + mCalculatedLabelBreakPoints.clear(); + mCalculatedLabelSizes.clear(); + mCalculatedLineSizes.clear(); + + for (int i = 0; i < entryCount; i++) { + + LegendEntry e = entries[i]; + boolean drawingForm = e.form != LegendForm.NONE; + float formSize = Float.isNaN(e.formSize) + ? defaultFormSize + : Utils.convertDpToPixel(e.formSize); + String label = e.label; + + mCalculatedLabelBreakPoints.add(false); + + if (stackedStartIndex == -1) { + // we are not stacking, so required width is for this label + // only + requiredWidth = 0.f; + } else { + // add the spacing appropriate for stacked labels/forms + requiredWidth += stackSpace; + } + + // grouped forms have null labels + if (label != null) { + + mCalculatedLabelSizes.add(Utils.calcTextSize(labelpaint, label)); + requiredWidth += drawingForm ? formToTextSpace + formSize : 0.f; + requiredWidth += mCalculatedLabelSizes.get(i).width; + } else { + + mCalculatedLabelSizes.add(FSize.getInstance(0.f, 0.f)); + requiredWidth += drawingForm ? formSize : 0.f; + + if (stackedStartIndex == -1) { + // mark this index as we might want to break here later + stackedStartIndex = i; + } + } + + if (label != null || i == entryCount - 1) { + + float requiredSpacing = currentLineWidth == 0.f ? 0.f : xEntrySpace; + + if (!wordWrapEnabled // No word wrapping, it must fit. + // The line is empty, it must fit + || currentLineWidth == 0.f + // It simply fits + || (contentWidth - currentLineWidth >= + requiredSpacing + requiredWidth)) { + // Expand current line + currentLineWidth += requiredSpacing + requiredWidth; + } else { // It doesn't fit, we need to wrap a line + + // Add current line size to array + mCalculatedLineSizes.add(FSize.getInstance(currentLineWidth, labelLineHeight)); + maxLineWidth = Math.max(maxLineWidth, currentLineWidth); + + // Start a new line + mCalculatedLabelBreakPoints.set( + stackedStartIndex > -1 ? stackedStartIndex + : i, true); + currentLineWidth = requiredWidth; + } + + if (i == entryCount - 1) { + // Add last line size to array + mCalculatedLineSizes.add(FSize.getInstance(currentLineWidth, labelLineHeight)); + maxLineWidth = Math.max(maxLineWidth, currentLineWidth); + } + } + + stackedStartIndex = label != null ? -1 : stackedStartIndex; + } + + mNeededWidth = maxLineWidth; + mNeededHeight = labelLineHeight + * (float) (mCalculatedLineSizes.size()) + + labelLineSpacing * + (float) (mCalculatedLineSizes.size() == 0 + ? 0 + : (mCalculatedLineSizes.size() - 1)); + + break; + } + } + + mNeededHeight += mYOffset; + mNeededWidth += mXOffset; + } +} diff --git a/MPChartLib/src/main/java/com/github/mikephil/charting/components/LegendEntry.java b/MPChartLib/src/main/java/com/github/mikephil/charting/components/LegendEntry.java new file mode 100644 index 00000000..3acec0f4 --- /dev/null +++ b/MPChartLib/src/main/java/com/github/mikephil/charting/components/LegendEntry.java @@ -0,0 +1,78 @@ +package com.github.mikephil.charting.components; + + +import android.graphics.DashPathEffect; + +import com.github.mikephil.charting.utils.ColorTemplate; + +public class LegendEntry { + public LegendEntry() { + + } + + /** + * + * @param label The legend entry text. A `null` label will start a group. + * @param form The form to draw for this entry. + * @param formSize Set to NaN to use the legend's default. + * @param formLineWidth Set to NaN to use the legend's default. + * @param formLineDashEffect Set to nil to use the legend's default. + * @param formColor The color for drawing the form. + */ + public LegendEntry(String label, + Legend.LegendForm form, + float formSize, + float formLineWidth, + DashPathEffect formLineDashEffect, + int formColor) + { + this.label = label; + this.form = form; + this.formSize = formSize; + this.formLineWidth = formLineWidth; + this.formLineDashEffect = formLineDashEffect; + this.formColor = formColor; + } + + /** + * The legend entry text. + * A `null` label will start a group. + */ + public String label; + + /** + * The form to draw for this entry. + * + * `NONE` will avoid drawing a form, and any related space. + * `EMPTY` will avoid drawing a form, but keep its space. + * `DEFAULT` will use the Legend's default. + */ + public Legend.LegendForm form = Legend.LegendForm.DEFAULT; + + /** + * Form size will be considered except for when .None is used + * + * Set as NaN to use the legend's default + */ + public float formSize = Float.NaN; + + /** + * Line width used for shapes that consist of lines. + * + * Set as NaN to use the legend's default + */ + public float formLineWidth = Float.NaN; + + /** + * Line dash path effect used for shapes that consist of lines. + * + * Set to null to use the legend's default + */ + public DashPathEffect formLineDashEffect = null; + + /** + * The color for drawing the form + */ + public int formColor = ColorTemplate.COLOR_NONE; + +}
\ No newline at end of file diff --git a/MPChartLib/src/main/java/com/github/mikephil/charting/components/LimitLine.java b/MPChartLib/src/main/java/com/github/mikephil/charting/components/LimitLine.java new file mode 100644 index 00000000..8fcdee8f --- /dev/null +++ b/MPChartLib/src/main/java/com/github/mikephil/charting/components/LimitLine.java @@ -0,0 +1,215 @@ + +package com.github.mikephil.charting.components; + +import android.graphics.Color; +import android.graphics.DashPathEffect; +import android.graphics.Paint; +import android.graphics.Typeface; + +import com.github.mikephil.charting.utils.Utils; + +/** + * The limit line is an additional feature for all Line-, Bar- and + * ScatterCharts. It allows the displaying of an additional line in the chart + * that marks a certain maximum / limit on the specified axis (x- or y-axis). + * + * @author Philipp Jahoda + */ +public class LimitLine extends ComponentBase { + + /** limit / maximum (the y-value or xIndex) */ + private float mLimit = 0f; + + /** the width of the limit line */ + private float mLineWidth = 2f; + + /** the color of the limit line */ + private int mLineColor = Color.rgb(237, 91, 91); + + /** the style of the label text */ + private Paint.Style mTextStyle = Paint.Style.FILL_AND_STROKE; + + /** label string that is drawn next to the limit line */ + private String mLabel = ""; + + /** the path effect of this LimitLine that makes dashed lines possible */ + private DashPathEffect mDashPathEffect = null; + + /** indicates the position of the LimitLine label */ + private LimitLabelPosition mLabelPosition = LimitLabelPosition.RIGHT_TOP; + + /** enum that indicates the position of the LimitLine label */ + public enum LimitLabelPosition { + LEFT_TOP, LEFT_BOTTOM, RIGHT_TOP, RIGHT_BOTTOM + } + + /** + * Constructor with limit. + * + * @param limit - the position (the value) on the y-axis (y-value) or x-axis + * (xIndex) where this line should appear + */ + public LimitLine(float limit) { + mLimit = limit; + } + + /** + * Constructor with limit and label. + * + * @param limit - the position (the value) on the y-axis (y-value) or x-axis + * (xIndex) where this line should appear + * @param label - provide "" if no label is required + */ + public LimitLine(float limit, String label) { + mLimit = limit; + mLabel = label; + } + + /** + * Returns the limit that is set for this line. + * + * @return + */ + public float getLimit() { + return mLimit; + } + + /** + * set the line width of the chart (min = 0.2f, max = 12f); default 2f NOTE: + * thinner line == better performance, thicker line == worse performance + * + * @param width + */ + public void setLineWidth(float width) { + + if (width < 0.2f) + width = 0.2f; + if (width > 12.0f) + width = 12.0f; + mLineWidth = Utils.convertDpToPixel(width); + } + + /** + * returns the width of limit line + * + * @return + */ + public float getLineWidth() { + return mLineWidth; + } + + /** + * Sets the linecolor for this LimitLine. Make sure to use + * getResources().getColor(...) + * + * @param color + */ + public void setLineColor(int color) { + mLineColor = color; + } + + /** + * Returns the color that is used for this LimitLine + * + * @return + */ + public int getLineColor() { + return mLineColor; + } + + /** + * Enables the line to be drawn in dashed mode, e.g. like this "- - - - - -" + * + * @param lineLength the length of the line pieces + * @param spaceLength the length of space inbetween the pieces + * @param phase offset, in degrees (normally, use 0) + */ + public void enableDashedLine(float lineLength, float spaceLength, float phase) { + mDashPathEffect = new DashPathEffect(new float[] { + lineLength, spaceLength + }, phase); + } + + /** + * Disables the line to be drawn in dashed mode. + */ + public void disableDashedLine() { + mDashPathEffect = null; + } + + /** + * Returns true if the dashed-line effect is enabled, false if not. Default: + * disabled + * + * @return + */ + public boolean isDashedLineEnabled() { + return mDashPathEffect == null ? false : true; + } + + /** + * returns the DashPathEffect that is set for this LimitLine + * + * @return + */ + public DashPathEffect getDashPathEffect() { + return mDashPathEffect; + } + + /** + * Sets the color of the value-text that is drawn next to the LimitLine. + * Default: Paint.Style.FILL_AND_STROKE + * + * @param style + */ + public void setTextStyle(Paint.Style style) { + this.mTextStyle = style; + } + + /** + * Returns the color of the value-text that is drawn next to the LimitLine. + * + * @return + */ + public Paint.Style getTextStyle() { + return mTextStyle; + } + + /** + * Sets the position of the LimitLine value label (either on the right or on + * the left edge of the chart). Not supported for RadarChart. + * + * @param pos + */ + public void setLabelPosition(LimitLabelPosition pos) { + mLabelPosition = pos; + } + + /** + * Returns the position of the LimitLine label (value). + * + * @return + */ + public LimitLabelPosition getLabelPosition() { + return mLabelPosition; + } + + /** + * Sets the label that is drawn next to the limit line. Provide "" if no + * label is required. + * + * @param label + */ + public void setLabel(String label) { + mLabel = label; + } + + /** + * Returns the label that is drawn next to the limit line. + * + * @return + */ + public String getLabel() { + return mLabel; + } +} diff --git a/MPChartLib/src/main/java/com/github/mikephil/charting/components/MarkerImage.java b/MPChartLib/src/main/java/com/github/mikephil/charting/components/MarkerImage.java new file mode 100644 index 00000000..7bd7b8e6 --- /dev/null +++ b/MPChartLib/src/main/java/com/github/mikephil/charting/components/MarkerImage.java @@ -0,0 +1,167 @@ +package com.github.mikephil.charting.components; + +import android.content.Context; +import android.graphics.Bitmap; +import android.graphics.Canvas; +import android.graphics.Rect; +import android.graphics.drawable.Drawable; +import android.os.Build; +import android.view.LayoutInflater; +import android.view.View; +import android.widget.RelativeLayout; + +import com.github.mikephil.charting.charts.Chart; +import com.github.mikephil.charting.data.Entry; +import com.github.mikephil.charting.highlight.Highlight; +import com.github.mikephil.charting.utils.FSize; +import com.github.mikephil.charting.utils.MPPointF; + +import java.lang.ref.WeakReference; + +/** + * View that can be displayed when selecting values in the chart. Extend this class to provide custom layouts for your + * markers. + * + * @author Philipp Jahoda + */ +public class MarkerImage implements IMarker { + + private Context mContext; + private Drawable mDrawable; + + private MPPointF mOffset = new MPPointF(); + private MPPointF mOffset2 = new MPPointF(); + private WeakReference<Chart> mWeakChart; + + private FSize mSize = new FSize(); + private Rect mDrawableBoundsCache = new Rect(); + + /** + * Constructor. Sets up the MarkerView with a custom layout resource. + * + * @param context + * @param drawableResourceId the drawable resource to render + */ + public MarkerImage(Context context, int drawableResourceId) { + mContext = context; + + if (Build.VERSION.SDK_INT >= Build.VERSION_CODES.LOLLIPOP) + { + mDrawable = mContext.getResources().getDrawable(drawableResourceId, null); + } + else + { + mDrawable = mContext.getResources().getDrawable(drawableResourceId); + } + } + + public void setOffset(MPPointF offset) { + mOffset = offset; + + if (mOffset == null) { + mOffset = new MPPointF(); + } + } + + public void setOffset(float offsetX, float offsetY) { + mOffset.x = offsetX; + mOffset.y = offsetY; + } + + @Override + public MPPointF getOffset() { + return mOffset; + } + + public void setSize(FSize size) { + mSize = size; + + if (mSize == null) { + mSize = new FSize(); + } + } + + public FSize getSize() { + return mSize; + } + + public void setChartView(Chart chart) { + mWeakChart = new WeakReference<>(chart); + } + + public Chart getChartView() { + return mWeakChart == null ? null : mWeakChart.get(); + } + + @Override + public MPPointF getOffsetForDrawingAtPoint(float posX, float posY) { + + MPPointF offset = getOffset(); + mOffset2.x = offset.x; + mOffset2.y = offset.y; + + Chart chart = getChartView(); + + float width = mSize.width; + float height = mSize.height; + + if (width == 0.f && mDrawable != null) { + width = mDrawable.getIntrinsicWidth(); + } + if (height == 0.f && mDrawable != null) { + height = mDrawable.getIntrinsicHeight(); + } + + if (posX + mOffset2.x < 0) { + mOffset2.x = - posX; + } else if (chart != null && posX + width + mOffset2.x > chart.getWidth()) { + mOffset2.x = chart.getWidth() - posX - width; + } + + if (posY + mOffset2.y < 0) { + mOffset2.y = - posY; + } else if (chart != null && posY + height + mOffset2.y > chart.getHeight()) { + mOffset2.y = chart.getHeight() - posY - height; + } + + return mOffset2; + } + + @Override + public void refreshContent(Entry e, Highlight highlight) { + + } + + @Override + public void draw(Canvas canvas, float posX, float posY) { + + if (mDrawable == null) return; + + MPPointF offset = getOffsetForDrawingAtPoint(posX, posY); + + float width = mSize.width; + float height = mSize.height; + + if (width == 0.f) { + width = mDrawable.getIntrinsicWidth(); + } + if (height == 0.f) { + height = mDrawable.getIntrinsicHeight(); + } + + mDrawable.copyBounds(mDrawableBoundsCache); + mDrawable.setBounds( + mDrawableBoundsCache.left, + mDrawableBoundsCache.top, + mDrawableBoundsCache.left + (int)width, + mDrawableBoundsCache.top + (int)height); + + int saveId = canvas.save(); + // translate to the correct position and draw + canvas.translate(posX + offset.x, posY + offset.y); + mDrawable.draw(canvas); + canvas.restoreToCount(saveId); + + mDrawable.setBounds(mDrawableBoundsCache); + } +} diff --git a/MPChartLib/src/main/java/com/github/mikephil/charting/components/MarkerView.java b/MPChartLib/src/main/java/com/github/mikephil/charting/components/MarkerView.java new file mode 100644 index 00000000..162e88e3 --- /dev/null +++ b/MPChartLib/src/main/java/com/github/mikephil/charting/components/MarkerView.java @@ -0,0 +1,129 @@ +package com.github.mikephil.charting.components; + +import android.content.Context; +import android.graphics.Canvas; +import android.view.LayoutInflater; +import android.view.View; +import android.widget.RelativeLayout; + +import com.github.mikephil.charting.charts.Chart; +import com.github.mikephil.charting.data.Entry; +import com.github.mikephil.charting.highlight.Highlight; +import com.github.mikephil.charting.utils.FSize; +import com.github.mikephil.charting.utils.MPPointF; + +import java.lang.ref.WeakReference; + +/** + * View that can be displayed when selecting values in the chart. Extend this class to provide custom layouts for your + * markers. + * + * @author Philipp Jahoda + */ +public class MarkerView extends RelativeLayout implements IMarker { + + private MPPointF mOffset = new MPPointF(); + private MPPointF mOffset2 = new MPPointF(); + private WeakReference<Chart> mWeakChart; + + /** + * Constructor. Sets up the MarkerView with a custom layout resource. + * + * @param context + * @param layoutResource the layout resource to use for the MarkerView + */ + public MarkerView(Context context, int layoutResource) { + super(context); + setupLayoutResource(layoutResource); + } + + /** + * Sets the layout resource for a custom MarkerView. + * + * @param layoutResource + */ + private void setupLayoutResource(int layoutResource) { + + View inflated = LayoutInflater.from(getContext()).inflate(layoutResource, this); + + inflated.setLayoutParams(new LayoutParams(RelativeLayout.LayoutParams.WRAP_CONTENT, RelativeLayout.LayoutParams.WRAP_CONTENT)); + inflated.measure(MeasureSpec.makeMeasureSpec(0, MeasureSpec.UNSPECIFIED), MeasureSpec.makeMeasureSpec(0, MeasureSpec.UNSPECIFIED)); + + // measure(getWidth(), getHeight()); + inflated.layout(0, 0, inflated.getMeasuredWidth(), inflated.getMeasuredHeight()); + } + + public void setOffset(MPPointF offset) { + mOffset = offset; + + if (mOffset == null) { + mOffset = new MPPointF(); + } + } + + public void setOffset(float offsetX, float offsetY) { + mOffset.x = offsetX; + mOffset.y = offsetY; + } + + @Override + public MPPointF getOffset() { + return mOffset; + } + + public void setChartView(Chart chart) { + mWeakChart = new WeakReference<>(chart); + } + + public Chart getChartView() { + return mWeakChart == null ? null : mWeakChart.get(); + } + + @Override + public MPPointF getOffsetForDrawingAtPoint(float posX, float posY) { + + MPPointF offset = getOffset(); + mOffset2.x = offset.x; + mOffset2.y = offset.y; + + Chart chart = getChartView(); + + float width = getWidth(); + float height = getHeight(); + + if (posX + mOffset2.x < 0) { + mOffset2.x = - posX; + } else if (chart != null && posX + width + mOffset2.x > chart.getWidth()) { + mOffset2.x = chart.getWidth() - posX - width; + } + + if (posY + mOffset2.y < 0) { + mOffset2.y = - posY; + } else if (chart != null && posY + height + mOffset2.y > chart.getHeight()) { + mOffset2.y = chart.getHeight() - posY - height; + } + + return mOffset2; + } + + @Override + public void refreshContent(Entry e, Highlight highlight) { + + measure(MeasureSpec.makeMeasureSpec(0, MeasureSpec.UNSPECIFIED), + MeasureSpec.makeMeasureSpec(0, MeasureSpec.UNSPECIFIED)); + layout(0, 0, getMeasuredWidth(), getMeasuredHeight()); + + } + + @Override + public void draw(Canvas canvas, float posX, float posY) { + + MPPointF offset = getOffsetForDrawingAtPoint(posX, posY); + + int saveId = canvas.save(); + // translate to the correct position and draw + canvas.translate(posX + offset.x, posY + offset.y); + draw(canvas); + canvas.restoreToCount(saveId); + } +} diff --git a/MPChartLib/src/main/java/com/github/mikephil/charting/components/XAxis.java b/MPChartLib/src/main/java/com/github/mikephil/charting/components/XAxis.java new file mode 100644 index 00000000..77d4aaf9 --- /dev/null +++ b/MPChartLib/src/main/java/com/github/mikephil/charting/components/XAxis.java @@ -0,0 +1,118 @@ + +package com.github.mikephil.charting.components; + +import com.github.mikephil.charting.utils.Utils; + +/** + * Class representing the x-axis labels settings. Only use the setter methods to + * modify it. Do not access public variables directly. Be aware that not all + * features the XLabels class provides are suitable for the RadarChart. + * + * @author Philipp Jahoda + */ +public class XAxis extends AxisBase { + + /** + * width of the x-axis labels in pixels - this is automatically + * calculated by the computeSize() methods in the renderers + */ + public int mLabelWidth = 1; + + /** + * height of the x-axis labels in pixels - this is automatically + * calculated by the computeSize() methods in the renderers + */ + public int mLabelHeight = 1; + + /** + * width of the (rotated) x-axis labels in pixels - this is automatically + * calculated by the computeSize() methods in the renderers + */ + public int mLabelRotatedWidth = 1; + + /** + * height of the (rotated) x-axis labels in pixels - this is automatically + * calculated by the computeSize() methods in the renderers + */ + public int mLabelRotatedHeight = 1; + + /** + * This is the angle for drawing the X axis labels (in degrees) + */ + protected float mLabelRotationAngle = 0f; + + /** + * if set to true, the chart will avoid that the first and last label entry + * in the chart "clip" off the edge of the chart + */ + private boolean mAvoidFirstLastClipping = false; + + /** + * the position of the x-labels relative to the chart + */ + private XAxisPosition mPosition = XAxisPosition.TOP; + + /** + * enum for the position of the x-labels relative to the chart + */ + public enum XAxisPosition { + TOP, BOTTOM, BOTH_SIDED, TOP_INSIDE, BOTTOM_INSIDE + } + + public XAxis() { + super(); + + mYOffset = Utils.convertDpToPixel(4.f); // -3 + } + + /** + * returns the position of the x-labels + */ + public XAxisPosition getPosition() { + return mPosition; + } + + /** + * sets the position of the x-labels + * + * @param pos + */ + public void setPosition(XAxisPosition pos) { + mPosition = pos; + } + + /** + * returns the angle for drawing the X axis labels (in degrees) + */ + public float getLabelRotationAngle() { + return mLabelRotationAngle; + } + + /** + * sets the angle for drawing the X axis labels (in degrees) + * + * @param angle the angle in degrees + */ + public void setLabelRotationAngle(float angle) { + mLabelRotationAngle = angle; + } + + /** + * if set to true, the chart will avoid that the first and last label entry + * in the chart "clip" off the edge of the chart or the screen + * + * @param enabled + */ + public void setAvoidFirstLastClipping(boolean enabled) { + mAvoidFirstLastClipping = enabled; + } + + /** + * returns true if avoid-first-lastclipping is enabled, false if not + * + * @return + */ + public boolean isAvoidFirstLastClippingEnabled() { + return mAvoidFirstLastClipping; + } +} diff --git a/MPChartLib/src/main/java/com/github/mikephil/charting/components/YAxis.java b/MPChartLib/src/main/java/com/github/mikephil/charting/components/YAxis.java new file mode 100644 index 00000000..d2071ec5 --- /dev/null +++ b/MPChartLib/src/main/java/com/github/mikephil/charting/components/YAxis.java @@ -0,0 +1,467 @@ +package com.github.mikephil.charting.components; + +import android.graphics.Color; +import android.graphics.Paint; + +import com.github.mikephil.charting.utils.Utils; + +/** + * Class representing the y-axis labels settings and its entries. Only use the setter methods to + * modify it. Do not + * access public variables directly. Be aware that not all features the YLabels class provides + * are suitable for the + * RadarChart. Customizations that affect the value range of the axis need to be applied before + * setting data for the + * chart. + * + * @author Philipp Jahoda + */ +public class YAxis extends AxisBase { + + /** + * indicates if the bottom y-label entry is drawn or not + */ + private boolean mDrawBottomYLabelEntry = true; + + /** + * indicates if the top y-label entry is drawn or not + */ + private boolean mDrawTopYLabelEntry = true; + + /** + * flag that indicates if the axis is inverted or not + */ + protected boolean mInverted = false; + + /** + * flag that indicates if the zero-line should be drawn regardless of other grid lines + */ + protected boolean mDrawZeroLine = false; + + /** + * flag indicating that auto scale min restriction should be used + */ + private boolean mUseAutoScaleRestrictionMin = false; + + /** + * flag indicating that auto scale max restriction should be used + */ + private boolean mUseAutoScaleRestrictionMax = false; + + /** + * Color of the zero line + */ + protected int mZeroLineColor = Color.GRAY; + + /** + * Width of the zero line in pixels + */ + protected float mZeroLineWidth = 1f; + + /** + * axis space from the largest value to the top in percent of the total axis range + */ + protected float mSpacePercentTop = 10f; + + /** + * axis space from the smallest value to the bottom in percent of the total axis range + */ + protected float mSpacePercentBottom = 10f; + + /** + * the position of the y-labels relative to the chart + */ + private YAxisLabelPosition mPosition = YAxisLabelPosition.OUTSIDE_CHART; + + /** + * the horizontal offset of the y-label + */ + private float mXLabelOffset = 0.0f; + + /** + * enum for the position of the y-labels relative to the chart + */ + public enum YAxisLabelPosition { + OUTSIDE_CHART, INSIDE_CHART + } + + /** + * the side this axis object represents + */ + private AxisDependency mAxisDependency; + + /** + * the minimum width that the axis should take (in dp). + * <p/> + * default: 0.0 + */ + protected float mMinWidth = 0.f; + + /** + * the maximum width that the axis can take (in dp). + * use Inifinity for disabling the maximum + * default: Float.POSITIVE_INFINITY (no maximum specified) + */ + protected float mMaxWidth = Float.POSITIVE_INFINITY; + + /** + * Enum that specifies the axis a DataSet should be plotted against, either LEFT or RIGHT. + * + * @author Philipp Jahoda + */ + public enum AxisDependency { + LEFT, RIGHT + } + + public YAxis() { + super(); + + // default left + this.mAxisDependency = AxisDependency.LEFT; + this.mYOffset = 0f; + } + + public YAxis(AxisDependency position) { + super(); + this.mAxisDependency = position; + this.mYOffset = 0f; + } + + public AxisDependency getAxisDependency() { + return mAxisDependency; + } + + /** + * @return the minimum width that the axis should take (in dp). + */ + public float getMinWidth() { + return mMinWidth; + } + + /** + * Sets the minimum width that the axis should take (in dp). + * + * @param minWidth + */ + public void setMinWidth(float minWidth) { + mMinWidth = minWidth; + } + + /** + * @return the maximum width that the axis can take (in dp). + */ + public float getMaxWidth() { + return mMaxWidth; + } + + /** + * Sets the maximum width that the axis can take (in dp). + * + * @param maxWidth + */ + public void setMaxWidth(float maxWidth) { + mMaxWidth = maxWidth; + } + + /** + * returns the position of the y-labels + */ + public YAxisLabelPosition getLabelPosition() { + return mPosition; + } + + /** + * sets the position of the y-labels + * + * @param pos + */ + public void setPosition(YAxisLabelPosition pos) { + mPosition = pos; + } + + /** + * returns the horizontal offset of the y-label + */ + public float getLabelXOffset() { + return mXLabelOffset; + } + + /** + * sets the horizontal offset of the y-label + * + * @param xOffset + */ + public void setLabelXOffset(float xOffset) { + mXLabelOffset = xOffset; + } + + /** + * returns true if drawing the top y-axis label entry is enabled + * + * @return + */ + public boolean isDrawTopYLabelEntryEnabled() { + return mDrawTopYLabelEntry; + } + + /** + * returns true if drawing the bottom y-axis label entry is enabled + * + * @return + */ + public boolean isDrawBottomYLabelEntryEnabled() { + return mDrawBottomYLabelEntry; + } + + /** + * set this to true to enable drawing the top y-label entry. Disabling this can be helpful + * when the top y-label and + * left x-label interfere with each other. default: true + * + * @param enabled + */ + public void setDrawTopYLabelEntry(boolean enabled) { + mDrawTopYLabelEntry = enabled; + } + + /** + * If this is set to true, the y-axis is inverted which means that low values are on top of + * the chart, high values + * on bottom. + * + * @param enabled + */ + public void setInverted(boolean enabled) { + mInverted = enabled; + } + + /** + * If this returns true, the y-axis is inverted. + * + * @return + */ + public boolean isInverted() { + return mInverted; + } + + /** + * This method is deprecated. + * Use setAxisMinimum(...) / setAxisMaximum(...) instead. + * + * @param startAtZero + */ + @Deprecated + public void setStartAtZero(boolean startAtZero) { + if (startAtZero) + setAxisMinimum(0f); + else + resetAxisMinimum(); + } + + /** + * Sets the top axis space in percent of the full range. Default 10f + * + * @param percent + */ + public void setSpaceTop(float percent) { + mSpacePercentTop = percent; + } + + /** + * Returns the top axis space in percent of the full range. Default 10f + * + * @return + */ + public float getSpaceTop() { + return mSpacePercentTop; + } + + /** + * Sets the bottom axis space in percent of the full range. Default 10f + * + * @param percent + */ + public void setSpaceBottom(float percent) { + mSpacePercentBottom = percent; + } + + /** + * Returns the bottom axis space in percent of the full range. Default 10f + * + * @return + */ + public float getSpaceBottom() { + return mSpacePercentBottom; + } + + public boolean isDrawZeroLineEnabled() { + return mDrawZeroLine; + } + + /** + * Set this to true to draw the zero-line regardless of weather other + * grid-lines are enabled or not. Default: false + * + * @param mDrawZeroLine + */ + public void setDrawZeroLine(boolean mDrawZeroLine) { + this.mDrawZeroLine = mDrawZeroLine; + } + + public int getZeroLineColor() { + return mZeroLineColor; + } + + /** + * Sets the color of the zero line + * + * @param color + */ + public void setZeroLineColor(int color) { + mZeroLineColor = color; + } + + public float getZeroLineWidth() { + return mZeroLineWidth; + } + + /** + * Sets the width of the zero line in dp + * + * @param width + */ + public void setZeroLineWidth(float width) { + this.mZeroLineWidth = Utils.convertDpToPixel(width); + } + + /** + * This is for normal (not horizontal) charts horizontal spacing. + * + * @param p + * @return + */ + public float getRequiredWidthSpace(Paint p) { + + p.setTextSize(mTextSize); + + String label = getLongestLabel(); + float width = (float) Utils.calcTextWidth(p, label) + getXOffset() * 2f; + + float minWidth = getMinWidth(); + float maxWidth = getMaxWidth(); + + if (minWidth > 0.f) + minWidth = Utils.convertDpToPixel(minWidth); + + if (maxWidth > 0.f && maxWidth != Float.POSITIVE_INFINITY) + maxWidth = Utils.convertDpToPixel(maxWidth); + + width = Math.max(minWidth, Math.min(width, maxWidth > 0.0 ? maxWidth : width)); + + return width; + } + + /** + * This is for HorizontalBarChart vertical spacing. + * + * @param p + * @return + */ + public float getRequiredHeightSpace(Paint p) { + + p.setTextSize(mTextSize); + + String label = getLongestLabel(); + return (float) Utils.calcTextHeight(p, label) + getYOffset() * 2f; + } + + /** + * Returns true if this axis needs horizontal offset, false if no offset is needed. + * + * @return + */ + public boolean needsOffset() { + if (isEnabled() && isDrawLabelsEnabled() && getLabelPosition() == YAxisLabelPosition + .OUTSIDE_CHART) + return true; + else + return false; + } + + /** + * Returns true if autoscale restriction for axis min value is enabled + */ + @Deprecated + public boolean isUseAutoScaleMinRestriction( ) { + return mUseAutoScaleRestrictionMin; + } + + /** + * Sets autoscale restriction for axis min value as enabled/disabled + */ + @Deprecated + public void setUseAutoScaleMinRestriction( boolean isEnabled ) { + mUseAutoScaleRestrictionMin = isEnabled; + } + + /** + * Returns true if autoscale restriction for axis max value is enabled + */ + @Deprecated + public boolean isUseAutoScaleMaxRestriction() { + return mUseAutoScaleRestrictionMax; + } + + /** + * Sets autoscale restriction for axis max value as enabled/disabled + */ + @Deprecated + public void setUseAutoScaleMaxRestriction( boolean isEnabled ) { + mUseAutoScaleRestrictionMax = isEnabled; + } + + + @Override + public void calculate(float dataMin, float dataMax) { + + float min = dataMin; + float max = dataMax; + + // Make sure max is greater than min + // Discussion: https://github.com/danielgindi/Charts/pull/3650#discussion_r221409991 + if (min > max) + { + if (mCustomAxisMax && mCustomAxisMin) + { + float t = min; + min = max; + max = t; + } + else if (mCustomAxisMax) + { + min = max < 0f ? max * 1.5f : max * 0.5f; + } + else if (mCustomAxisMin) + { + max = min < 0f ? min * 0.5f : min * 1.5f; + } + } + + float range = Math.abs(max - min); + + // in case all values are equal + if (range == 0f) { + max = max + 1f; + min = min - 1f; + } + + // recalculate + range = Math.abs(max - min); + + // calc extra spacing + this.mAxisMinimum = mCustomAxisMin ? this.mAxisMinimum : min - (range / 100f) * getSpaceBottom(); + this.mAxisMaximum = mCustomAxisMax ? this.mAxisMaximum : max + (range / 100f) * getSpaceTop(); + + this.mAxisRange = Math.abs(this.mAxisMinimum - this.mAxisMaximum); + } +} diff --git a/MPChartLib/src/main/java/com/github/mikephil/charting/data/BarData.java b/MPChartLib/src/main/java/com/github/mikephil/charting/data/BarData.java new file mode 100644 index 00000000..16d60f6f --- /dev/null +++ b/MPChartLib/src/main/java/com/github/mikephil/charting/data/BarData.java @@ -0,0 +1,119 @@ + +package com.github.mikephil.charting.data; + +import com.github.mikephil.charting.interfaces.datasets.IBarDataSet; + +import java.util.List; + +/** + * Data object that represents all data for the BarChart. + * + * @author Philipp Jahoda + */ +public class BarData extends BarLineScatterCandleBubbleData<IBarDataSet> { + + /** + * the width of the bars on the x-axis, in values (not pixels) + */ + private float mBarWidth = 0.85f; + + public BarData() { + super(); + } + + public BarData(IBarDataSet... dataSets) { + super(dataSets); + } + + public BarData(List<IBarDataSet> dataSets) { + super(dataSets); + } + + /** + * Sets the width each bar should have on the x-axis (in values, not pixels). + * Default 0.85f + * + * @param mBarWidth + */ + public void setBarWidth(float mBarWidth) { + this.mBarWidth = mBarWidth; + } + + public float getBarWidth() { + return mBarWidth; + } + + /** + * Groups all BarDataSet objects this data object holds together by modifying the x-value of their entries. + * Previously set x-values of entries will be overwritten. Leaves space between bars and groups as specified + * by the parameters. + * Do not forget to call notifyDataSetChanged() on your BarChart object after calling this method. + * + * @param fromX the starting point on the x-axis where the grouping should begin + * @param groupSpace the space between groups of bars in values (not pixels) e.g. 0.8f for bar width 1f + * @param barSpace the space between individual bars in values (not pixels) e.g. 0.1f for bar width 1f + */ + public void groupBars(float fromX, float groupSpace, float barSpace) { + + int setCount = mDataSets.size(); + if (setCount <= 1) { + throw new RuntimeException("BarData needs to hold at least 2 BarDataSets to allow grouping."); + } + + IBarDataSet max = getMaxEntryCountSet(); + int maxEntryCount = max.getEntryCount(); + + float groupSpaceWidthHalf = groupSpace / 2f; + float barSpaceHalf = barSpace / 2f; + float barWidthHalf = mBarWidth / 2f; + + float interval = getGroupWidth(groupSpace, barSpace); + + for (int i = 0; i < maxEntryCount; i++) { + + float start = fromX; + fromX += groupSpaceWidthHalf; + + for (IBarDataSet set : mDataSets) { + + fromX += barSpaceHalf; + fromX += barWidthHalf; + + if (i < set.getEntryCount()) { + + BarEntry entry = set.getEntryForIndex(i); + + if (entry != null) { + entry.setX(fromX); + } + } + + fromX += barWidthHalf; + fromX += barSpaceHalf; + } + + fromX += groupSpaceWidthHalf; + float end = fromX; + float innerInterval = end - start; + float diff = interval - innerInterval; + + // correct rounding errors + if (diff > 0 || diff < 0) { + fromX += diff; + } + } + + notifyDataChanged(); + } + + /** + * In case of grouped bars, this method returns the space an individual group of bar needs on the x-axis. + * + * @param groupSpace + * @param barSpace + * @return + */ + public float getGroupWidth(float groupSpace, float barSpace) { + return mDataSets.size() * (mBarWidth + barSpace) + groupSpace; + } +} diff --git a/MPChartLib/src/main/java/com/github/mikephil/charting/data/BarDataSet.java b/MPChartLib/src/main/java/com/github/mikephil/charting/data/BarDataSet.java new file mode 100644 index 00000000..e6563880 --- /dev/null +++ b/MPChartLib/src/main/java/com/github/mikephil/charting/data/BarDataSet.java @@ -0,0 +1,299 @@ + +package com.github.mikephil.charting.data; + +import android.graphics.Color; + +import com.github.mikephil.charting.interfaces.datasets.IBarDataSet; +import com.github.mikephil.charting.utils.Fill; + +import java.util.ArrayList; +import java.util.List; + +public class BarDataSet extends BarLineScatterCandleBubbleDataSet<BarEntry> implements IBarDataSet { + + /** + * the maximum number of bars that are stacked upon each other, this value + * is calculated from the Entries that are added to the DataSet + */ + private int mStackSize = 1; + + /** + * the color used for drawing the bar shadows + */ + private int mBarShadowColor = Color.rgb(215, 215, 215); + + private float mBarBorderWidth = 0.0f; + + private int mBarBorderColor = Color.BLACK; + + /** + * the alpha value used to draw the highlight indicator bar + */ + private int mHighLightAlpha = 120; + + /** + * the overall entry count, including counting each stack-value individually + */ + private int mEntryCountStacks = 0; + + /** + * array of labels used to describe the different values of the stacked bars + */ + private String[] mStackLabels = new String[]{}; + + protected List<Fill> mFills = null; + + public BarDataSet(List<BarEntry> yVals, String label) { + super(yVals, label); + + mHighLightColor = Color.rgb(0, 0, 0); + + calcStackSize(yVals); + calcEntryCountIncludingStacks(yVals); + } + + @Override + public DataSet<BarEntry> copy() { + List<BarEntry> entries = new ArrayList<BarEntry>(); + for (int i = 0; i < mEntries.size(); i++) { + entries.add(mEntries.get(i).copy()); + } + BarDataSet copied = new BarDataSet(entries, getLabel()); + copy(copied); + return copied; + } + + protected void copy(BarDataSet barDataSet) { + super.copy(barDataSet); + barDataSet.mStackSize = mStackSize; + barDataSet.mBarShadowColor = mBarShadowColor; + barDataSet.mBarBorderWidth = mBarBorderWidth; + barDataSet.mStackLabels = mStackLabels; + barDataSet.mHighLightAlpha = mHighLightAlpha; + } + + @Override + public List<Fill> getFills() { + return mFills; + } + + @Override + public Fill getFill(int index) { + return mFills.get(index % mFills.size()); + } + + /** + * This method is deprecated. + * Use getFills() instead. + */ + @Deprecated + public List<Fill> getGradients() { + return mFills; + } + + /** + * This method is deprecated. + * Use getFill(...) instead. + * + * @param index + */ + @Deprecated + public Fill getGradient(int index) { + return getFill(index); + } + + /** + * Sets the start and end color for gradient color, ONLY color that should be used for this DataSet. + * + * @param startColor + * @param endColor + */ + public void setGradientColor(int startColor, int endColor) { + mFills.clear(); + mFills.add(new Fill(startColor, endColor)); + } + + /** + * This method is deprecated. + * Use setFills(...) instead. + * + * @param gradientColors + */ + @Deprecated + public void setGradientColors(List<Fill> gradientColors) { + this.mFills = gradientColors; + } + + /** + * Sets the fills for the bars in this dataset. + * + * @param fills + */ + public void setFills(List<Fill> fills) { + this.mFills = fills; + } + + /** + * Calculates the total number of entries this DataSet represents, including + * stacks. All values belonging to a stack are calculated separately. + */ + private void calcEntryCountIncludingStacks(List<BarEntry> yVals) { + + mEntryCountStacks = 0; + + for (int i = 0; i < yVals.size(); i++) { + + float[] vals = yVals.get(i).getYVals(); + + if (vals == null) + mEntryCountStacks++; + else + mEntryCountStacks += vals.length; + } + } + + /** + * calculates the maximum stacksize that occurs in the Entries array of this + * DataSet + */ + private void calcStackSize(List<BarEntry> yVals) { + + for (int i = 0; i < yVals.size(); i++) { + + float[] vals = yVals.get(i).getYVals(); + + if (vals != null && vals.length > mStackSize) + mStackSize = vals.length; + } + } + + @Override + protected void calcMinMax(BarEntry e) { + + if (e != null && !Float.isNaN(e.getY())) { + + if (e.getYVals() == null) { + + if (e.getY() < mYMin) + mYMin = e.getY(); + + if (e.getY() > mYMax) + mYMax = e.getY(); + } else { + + if (-e.getNegativeSum() < mYMin) + mYMin = -e.getNegativeSum(); + + if (e.getPositiveSum() > mYMax) + mYMax = e.getPositiveSum(); + } + + calcMinMaxX(e); + } + } + + @Override + public int getStackSize() { + return mStackSize; + } + + @Override + public boolean isStacked() { + return mStackSize > 1 ? true : false; + } + + /** + * returns the overall entry count, including counting each stack-value + * individually + * + * @return + */ + public int getEntryCountStacks() { + return mEntryCountStacks; + } + + /** + * Sets the color used for drawing the bar-shadows. The bar shadows is a + * surface behind the bar that indicates the maximum value. Don't for get to + * use getResources().getColor(...) to set this. Or Color.rgb(...). + * + * @param color + */ + public void setBarShadowColor(int color) { + mBarShadowColor = color; + } + + @Override + public int getBarShadowColor() { + return mBarShadowColor; + } + + /** + * Sets the width used for drawing borders around the bars. + * If borderWidth == 0, no border will be drawn. + * + * @return + */ + public void setBarBorderWidth(float width) { + mBarBorderWidth = width; + } + + /** + * Returns the width used for drawing borders around the bars. + * If borderWidth == 0, no border will be drawn. + * + * @return + */ + @Override + public float getBarBorderWidth() { + return mBarBorderWidth; + } + + /** + * Sets the color drawing borders around the bars. + * + * @return + */ + public void setBarBorderColor(int color) { + mBarBorderColor = color; + } + + /** + * Returns the color drawing borders around the bars. + * + * @return + */ + @Override + public int getBarBorderColor() { + return mBarBorderColor; + } + + /** + * Set the alpha value (transparency) that is used for drawing the highlight + * indicator bar. min = 0 (fully transparent), max = 255 (fully opaque) + * + * @param alpha + */ + public void setHighLightAlpha(int alpha) { + mHighLightAlpha = alpha; + } + + @Override + public int getHighLightAlpha() { + return mHighLightAlpha; + } + + /** + * Sets labels for different values of bar-stacks, in case there are one. + * + * @param labels + */ + public void setStackLabels(String[] labels) { + mStackLabels = labels; + } + + @Override + public String[] getStackLabels() { + return mStackLabels; + } +} diff --git a/MPChartLib/src/main/java/com/github/mikephil/charting/data/BarEntry.java b/MPChartLib/src/main/java/com/github/mikephil/charting/data/BarEntry.java new file mode 100644 index 00000000..365ef51a --- /dev/null +++ b/MPChartLib/src/main/java/com/github/mikephil/charting/data/BarEntry.java @@ -0,0 +1,310 @@ +package com.github.mikephil.charting.data; + +import android.annotation.SuppressLint; +import android.graphics.drawable.Drawable; + +import com.github.mikephil.charting.highlight.Range; + +/** + * Entry class for the BarChart. (especially stacked bars) + * + * @author Philipp Jahoda + */ +@SuppressLint("ParcelCreator") +public class BarEntry extends Entry { + + /** + * the values the stacked barchart holds + */ + private float[] mYVals; + + /** + * the ranges for the individual stack values - automatically calculated + */ + private Range[] mRanges; + + /** + * the sum of all negative values this entry (if stacked) contains + */ + private float mNegativeSum; + + /** + * the sum of all positive values this entry (if stacked) contains + */ + private float mPositiveSum; + + /** + * Constructor for normal bars (not stacked). + * + * @param x + * @param y + */ + public BarEntry(float x, float y) { + super(x, y); + } + + /** + * Constructor for normal bars (not stacked). + * + * @param x + * @param y + * @param data - Spot for additional data this Entry represents. + */ + public BarEntry(float x, float y, Object data) { + super(x, y, data); + } + + /** + * Constructor for normal bars (not stacked). + * + * @param x + * @param y + * @param icon - icon image + */ + public BarEntry(float x, float y, Drawable icon) { + super(x, y, icon); + } + + /** + * Constructor for normal bars (not stacked). + * + * @param x + * @param y + * @param icon - icon image + * @param data - Spot for additional data this Entry represents. + */ + public BarEntry(float x, float y, Drawable icon, Object data) { + super(x, y, icon, data); + } + + /** + * Constructor for stacked bar entries. One data object for whole stack + * + * @param x + * @param vals - the stack values, use at least 2 + */ + public BarEntry(float x, float[] vals) { + super(x, calcSum(vals)); + + this.mYVals = vals; + calcPosNegSum(); + calcRanges(); + } + + /** + * Constructor for stacked bar entries. One data object for whole stack + * + * @param x + * @param vals - the stack values, use at least 2 + * @param data - Spot for additional data this Entry represents. + */ + public BarEntry(float x, float[] vals, Object data) { + super(x, calcSum(vals), data); + + this.mYVals = vals; + calcPosNegSum(); + calcRanges(); + } + + /** + * Constructor for stacked bar entries. One data object for whole stack + * + * @param x + * @param vals - the stack values, use at least 2 + * @param icon - icon image + */ + public BarEntry(float x, float[] vals, Drawable icon) { + super(x, calcSum(vals), icon); + + this.mYVals = vals; + calcPosNegSum(); + calcRanges(); + } + + /** + * Constructor for stacked bar entries. One data object for whole stack + * + * @param x + * @param vals - the stack values, use at least 2 + * @param icon - icon image + * @param data - Spot for additional data this Entry represents. + */ + public BarEntry(float x, float[] vals, Drawable icon, Object data) { + super(x, calcSum(vals), icon, data); + + this.mYVals = vals; + calcPosNegSum(); + calcRanges(); + } + + /** + * Returns an exact copy of the BarEntry. + */ + public BarEntry copy() { + + BarEntry copied = new BarEntry(getX(), getY(), getData()); + copied.setVals(mYVals); + return copied; + } + + /** + * Returns the stacked values this BarEntry represents, or null, if only a single value is represented (then, use + * getY()). + * + * @return + */ + public float[] getYVals() { + return mYVals; + } + + /** + * Set the array of values this BarEntry should represent. + * + * @param vals + */ + public void setVals(float[] vals) { + setY(calcSum(vals)); + mYVals = vals; + calcPosNegSum(); + calcRanges(); + } + + /** + * Returns the value of this BarEntry. If the entry is stacked, it returns the positive sum of all values. + * + * @return + */ + @Override + public float getY() { + return super.getY(); + } + + /** + * Returns the ranges of the individual stack-entries. Will return null if this entry is not stacked. + * + * @return + */ + public Range[] getRanges() { + return mRanges; + } + + /** + * Returns true if this BarEntry is stacked (has a values array), false if not. + * + * @return + */ + public boolean isStacked() { + return mYVals != null; + } + + /** + * Use `getSumBelow(stackIndex)` instead. + */ + @Deprecated + public float getBelowSum(int stackIndex) { + return getSumBelow(stackIndex); + } + + public float getSumBelow(int stackIndex) { + + if (mYVals == null) + return 0; + + float remainder = 0f; + int index = mYVals.length - 1; + + while (index > stackIndex && index >= 0) { + remainder += mYVals[index]; + index--; + } + + return remainder; + } + + /** + * Reuturns the sum of all positive values this entry (if stacked) contains. + * + * @return + */ + public float getPositiveSum() { + return mPositiveSum; + } + + /** + * Returns the sum of all negative values this entry (if stacked) contains. (this is a positive number) + * + * @return + */ + public float getNegativeSum() { + return mNegativeSum; + } + + private void calcPosNegSum() { + + if (mYVals == null) { + mNegativeSum = 0; + mPositiveSum = 0; + return; + } + + float sumNeg = 0f; + float sumPos = 0f; + + for (float f : mYVals) { + if (f <= 0f) + sumNeg += Math.abs(f); + else + sumPos += f; + } + + mNegativeSum = sumNeg; + mPositiveSum = sumPos; + } + + /** + * Calculates the sum across all values of the given stack. + * + * @param vals + * @return + */ + private static float calcSum(float[] vals) { + + if (vals == null) + return 0f; + + float sum = 0f; + + for (float f : vals) + sum += f; + + return sum; + } + + protected void calcRanges() { + + float[] values = getYVals(); + + if (values == null || values.length == 0) + return; + + mRanges = new Range[values.length]; + + float negRemain = -getNegativeSum(); + float posRemain = 0f; + + for (int i = 0; i < mRanges.length; i++) { + + float value = values[i]; + + if (value < 0) { + mRanges[i] = new Range(negRemain, negRemain - value); + negRemain -= value; + } else { + mRanges[i] = new Range(posRemain, posRemain + value); + posRemain += value; + } + } + } +} + + diff --git a/MPChartLib/src/main/java/com/github/mikephil/charting/data/BarLineScatterCandleBubbleData.java b/MPChartLib/src/main/java/com/github/mikephil/charting/data/BarLineScatterCandleBubbleData.java new file mode 100644 index 00000000..c09eadec --- /dev/null +++ b/MPChartLib/src/main/java/com/github/mikephil/charting/data/BarLineScatterCandleBubbleData.java @@ -0,0 +1,27 @@ + +package com.github.mikephil.charting.data; + +import com.github.mikephil.charting.interfaces.datasets.IBarLineScatterCandleBubbleDataSet; + +import java.util.List; + +/** + * Baseclass for all Line, Bar, Scatter, Candle and Bubble data. + * + * @author Philipp Jahoda + */ +public abstract class BarLineScatterCandleBubbleData<T extends IBarLineScatterCandleBubbleDataSet<? extends Entry>> + extends ChartData<T> { + + public BarLineScatterCandleBubbleData() { + super(); + } + + public BarLineScatterCandleBubbleData(T... sets) { + super(sets); + } + + public BarLineScatterCandleBubbleData(List<T> sets) { + super(sets); + } +} diff --git a/MPChartLib/src/main/java/com/github/mikephil/charting/data/BarLineScatterCandleBubbleDataSet.java b/MPChartLib/src/main/java/com/github/mikephil/charting/data/BarLineScatterCandleBubbleDataSet.java new file mode 100644 index 00000000..eab6dccc --- /dev/null +++ b/MPChartLib/src/main/java/com/github/mikephil/charting/data/BarLineScatterCandleBubbleDataSet.java @@ -0,0 +1,48 @@ + +package com.github.mikephil.charting.data; + +import android.graphics.Color; + +import com.github.mikephil.charting.interfaces.datasets.IBarLineScatterCandleBubbleDataSet; + +import java.util.List; + +/** + * Baseclass of all DataSets for Bar-, Line-, Scatter- and CandleStickChart. + * + * @author Philipp Jahoda + */ +public abstract class BarLineScatterCandleBubbleDataSet<T extends Entry> + extends DataSet<T> + implements IBarLineScatterCandleBubbleDataSet<T> { + + /** + * default highlight color + */ + protected int mHighLightColor = Color.rgb(255, 187, 115); + + public BarLineScatterCandleBubbleDataSet(List<T> yVals, String label) { + super(yVals, label); + } + + /** + * Sets the color that is used for drawing the highlight indicators. Dont + * forget to resolve the color using getResources().getColor(...) or + * Color.rgb(...). + * + * @param color + */ + public void setHighLightColor(int color) { + mHighLightColor = color; + } + + @Override + public int getHighLightColor() { + return mHighLightColor; + } + + protected void copy(BarLineScatterCandleBubbleDataSet barLineScatterCandleBubbleDataSet) { + super.copy(barLineScatterCandleBubbleDataSet); + barLineScatterCandleBubbleDataSet.mHighLightColor = mHighLightColor; + } +} diff --git a/MPChartLib/src/main/java/com/github/mikephil/charting/data/BaseDataSet.java b/MPChartLib/src/main/java/com/github/mikephil/charting/data/BaseDataSet.java new file mode 100644 index 00000000..7e7445ca --- /dev/null +++ b/MPChartLib/src/main/java/com/github/mikephil/charting/data/BaseDataSet.java @@ -0,0 +1,506 @@ +package com.github.mikephil.charting.data; + +import android.content.Context; +import android.graphics.Color; +import android.graphics.DashPathEffect; +import android.graphics.Typeface; + +import com.github.mikephil.charting.components.Legend; +import com.github.mikephil.charting.components.YAxis; +import com.github.mikephil.charting.formatter.IValueFormatter; +import com.github.mikephil.charting.interfaces.datasets.IDataSet; +import com.github.mikephil.charting.utils.ColorTemplate; +import com.github.mikephil.charting.utils.MPPointF; +import com.github.mikephil.charting.utils.Utils; + +import java.util.ArrayList; +import java.util.List; + +/** + * Created by Philipp Jahoda on 21/10/15. + * This is the base dataset of all DataSets. It's purpose is to implement critical methods + * provided by the IDataSet interface. + */ +public abstract class BaseDataSet<T extends Entry> implements IDataSet<T> { + + /** + * List representing all colors that are used for this DataSet + */ + protected List<Integer> mColors = null; + + /** + * List representing all colors that are used for drawing the actual values for this DataSet + */ + protected List<Integer> mValueColors = null; + + /** + * label that describes the DataSet or the data the DataSet represents + */ + private String mLabel = "DataSet"; + + /** + * this specifies which axis this DataSet should be plotted against + */ + protected YAxis.AxisDependency mAxisDependency = YAxis.AxisDependency.LEFT; + + /** + * if true, value highlightning is enabled + */ + protected boolean mHighlightEnabled = true; + + /** + * custom formatter that is used instead of the auto-formatter if set + */ + protected transient IValueFormatter mValueFormatter; + + /** + * the typeface used for the value text + */ + protected Typeface mValueTypeface; + + private Legend.LegendForm mForm = Legend.LegendForm.DEFAULT; + private float mFormSize = Float.NaN; + private float mFormLineWidth = Float.NaN; + private DashPathEffect mFormLineDashEffect = null; + + /** + * if true, y-values are drawn on the chart + */ + protected boolean mDrawValues = true; + + /** + * if true, y-icons are drawn on the chart + */ + protected boolean mDrawIcons = true; + + /** + * the offset for drawing icons (in dp) + */ + protected MPPointF mIconsOffset = new MPPointF(); + + /** + * the size of the value-text labels + */ + protected float mValueTextSize = 17f; + + /** + * flag that indicates if the DataSet is visible or not + */ + protected boolean mVisible = true; + + /** + * Default constructor. + */ + public BaseDataSet() { + mColors = new ArrayList<Integer>(); + mValueColors = new ArrayList<Integer>(); + + // default color + mColors.add(Color.rgb(140, 234, 255)); + mValueColors.add(Color.BLACK); + } + + /** + * Constructor with label. + * + * @param label + */ + public BaseDataSet(String label) { + this(); + this.mLabel = label; + } + + /** + * Use this method to tell the data set that the underlying data has changed. + */ + public void notifyDataSetChanged() { + calcMinMax(); + } + + + /** + * ###### ###### COLOR GETTING RELATED METHODS ##### ###### + */ + + @Override + public List<Integer> getColors() { + return mColors; + } + + public List<Integer> getValueColors() { + return mValueColors; + } + + @Override + public int getColor() { + return mColors.get(0); + } + + @Override + public int getColor(int index) { + return mColors.get(index % mColors.size()); + } + + /** + * ###### ###### COLOR SETTING RELATED METHODS ##### ###### + */ + + /** + * Sets the colors that should be used fore this DataSet. Colors are reused + * as soon as the number of Entries the DataSet represents is higher than + * the size of the colors array. If you are using colors from the resources, + * make sure that the colors are already prepared (by calling + * getResources().getColor(...)) before adding them to the DataSet. + * + * @param colors + */ + public void setColors(List<Integer> colors) { + this.mColors = colors; + } + + /** + * Sets the colors that should be used fore this DataSet. Colors are reused + * as soon as the number of Entries the DataSet represents is higher than + * the size of the colors array. If you are using colors from the resources, + * make sure that the colors are already prepared (by calling + * getResources().getColor(...)) before adding them to the DataSet. + * + * @param colors + */ + public void setColors(int... colors) { + this.mColors = ColorTemplate.createColors(colors); + } + + /** + * Sets the colors that should be used fore this DataSet. Colors are reused + * as soon as the number of Entries the DataSet represents is higher than + * the size of the colors array. You can use + * "new int[] { R.color.red, R.color.green, ... }" to provide colors for + * this method. Internally, the colors are resolved using + * getResources().getColor(...) + * + * @param colors + */ + public void setColors(int[] colors, Context c) { + + if (mColors == null) { + mColors = new ArrayList<>(); + } + + mColors.clear(); + + for (int color : colors) { + mColors.add(c.getResources().getColor(color)); + } + } + + /** + * Adds a new color to the colors array of the DataSet. + * + * @param color + */ + public void addColor(int color) { + if (mColors == null) + mColors = new ArrayList<Integer>(); + mColors.add(color); + } + + /** + * Sets the one and ONLY color that should be used for this DataSet. + * Internally, this recreates the colors array and adds the specified color. + * + * @param color + */ + public void setColor(int color) { + resetColors(); + mColors.add(color); + } + + /** + * Sets a color with a specific alpha value. + * + * @param color + * @param alpha from 0-255 + */ + public void setColor(int color, int alpha) { + setColor(Color.argb(alpha, Color.red(color), Color.green(color), Color.blue(color))); + } + + /** + * Sets colors with a specific alpha value. + * + * @param colors + * @param alpha + */ + public void setColors(int[] colors, int alpha) { + resetColors(); + for (int color : colors) { + addColor(Color.argb(alpha, Color.red(color), Color.green(color), Color.blue(color))); + } + } + + /** + * Resets all colors of this DataSet and recreates the colors array. + */ + public void resetColors() { + if (mColors == null) { + mColors = new ArrayList<Integer>(); + } + mColors.clear(); + } + + /** + * ###### ###### OTHER STYLING RELATED METHODS ##### ###### + */ + + @Override + public void setLabel(String label) { + mLabel = label; + } + + @Override + public String getLabel() { + return mLabel; + } + + @Override + public void setHighlightEnabled(boolean enabled) { + mHighlightEnabled = enabled; + } + + @Override + public boolean isHighlightEnabled() { + return mHighlightEnabled; + } + + @Override + public void setValueFormatter(IValueFormatter f) { + + if (f == null) + return; + else + mValueFormatter = f; + } + + @Override + public IValueFormatter getValueFormatter() { + if (needsFormatter()) + return Utils.getDefaultValueFormatter(); + return mValueFormatter; + } + + @Override + public boolean needsFormatter() { + return mValueFormatter == null; + } + + @Override + public void setValueTextColor(int color) { + mValueColors.clear(); + mValueColors.add(color); + } + + @Override + public void setValueTextColors(List<Integer> colors) { + mValueColors = colors; + } + + @Override + public void setValueTypeface(Typeface tf) { + mValueTypeface = tf; + } + + @Override + public void setValueTextSize(float size) { + mValueTextSize = Utils.convertDpToPixel(size); + } + + @Override + public int getValueTextColor() { + return mValueColors.get(0); + } + + @Override + public int getValueTextColor(int index) { + return mValueColors.get(index % mValueColors.size()); + } + + @Override + public Typeface getValueTypeface() { + return mValueTypeface; + } + + @Override + public float getValueTextSize() { + return mValueTextSize; + } + + public void setForm(Legend.LegendForm form) { + mForm = form; + } + + @Override + public Legend.LegendForm getForm() { + return mForm; + } + + public void setFormSize(float formSize) { + mFormSize = formSize; + } + + @Override + public float getFormSize() { + return mFormSize; + } + + public void setFormLineWidth(float formLineWidth) { + mFormLineWidth = formLineWidth; + } + + @Override + public float getFormLineWidth() { + return mFormLineWidth; + } + + public void setFormLineDashEffect(DashPathEffect dashPathEffect) { + mFormLineDashEffect = dashPathEffect; + } + + @Override + public DashPathEffect getFormLineDashEffect() { + return mFormLineDashEffect; + } + + @Override + public void setDrawValues(boolean enabled) { + this.mDrawValues = enabled; + } + + @Override + public boolean isDrawValuesEnabled() { + return mDrawValues; + } + + @Override + public void setDrawIcons(boolean enabled) { + mDrawIcons = enabled; + } + + @Override + public boolean isDrawIconsEnabled() { + return mDrawIcons; + } + + @Override + public void setIconsOffset(MPPointF offsetDp) { + + mIconsOffset.x = offsetDp.x; + mIconsOffset.y = offsetDp.y; + } + + @Override + public MPPointF getIconsOffset() { + return mIconsOffset; + } + + @Override + public void setVisible(boolean visible) { + mVisible = visible; + } + + @Override + public boolean isVisible() { + return mVisible; + } + + @Override + public YAxis.AxisDependency getAxisDependency() { + return mAxisDependency; + } + + @Override + public void setAxisDependency(YAxis.AxisDependency dependency) { + mAxisDependency = dependency; + } + + + /** + * ###### ###### DATA RELATED METHODS ###### ###### + */ + + @Override + public int getIndexInEntries(int xIndex) { + + for (int i = 0; i < getEntryCount(); i++) { + if (xIndex == getEntryForIndex(i).getX()) + return i; + } + + return -1; + } + + @Override + public boolean removeFirst() { + + if (getEntryCount() > 0) { + + T entry = getEntryForIndex(0); + return removeEntry(entry); + } else + return false; + } + + @Override + public boolean removeLast() { + + if (getEntryCount() > 0) { + + T e = getEntryForIndex(getEntryCount() - 1); + return removeEntry(e); + } else + return false; + } + + @Override + public boolean removeEntryByXValue(float xValue) { + + T e = getEntryForXValue(xValue, Float.NaN); + return removeEntry(e); + } + + @Override + public boolean removeEntry(int index) { + + T e = getEntryForIndex(index); + return removeEntry(e); + } + + @Override + public boolean contains(T e) { + + for (int i = 0; i < getEntryCount(); i++) { + if (getEntryForIndex(i).equals(e)) + return true; + } + + return false; + } + + protected void copy(BaseDataSet baseDataSet) { + baseDataSet.mAxisDependency = mAxisDependency; + baseDataSet.mColors = mColors; + baseDataSet.mDrawIcons = mDrawIcons; + baseDataSet.mDrawValues = mDrawValues; + baseDataSet.mForm = mForm; + baseDataSet.mFormLineDashEffect = mFormLineDashEffect; + baseDataSet.mFormLineWidth = mFormLineWidth; + baseDataSet.mFormSize = mFormSize; + baseDataSet.mHighlightEnabled = mHighlightEnabled; + baseDataSet.mIconsOffset = mIconsOffset; + baseDataSet.mValueColors = mValueColors; + baseDataSet.mValueFormatter = mValueFormatter; + baseDataSet.mValueColors = mValueColors; + baseDataSet.mValueTextSize = mValueTextSize; + baseDataSet.mVisible = mVisible; + } +} diff --git a/MPChartLib/src/main/java/com/github/mikephil/charting/data/BaseEntry.java b/MPChartLib/src/main/java/com/github/mikephil/charting/data/BaseEntry.java new file mode 100644 index 00000000..eb1ada84 --- /dev/null +++ b/MPChartLib/src/main/java/com/github/mikephil/charting/data/BaseEntry.java @@ -0,0 +1,97 @@ +package com.github.mikephil.charting.data; + +import android.graphics.drawable.Drawable; + +/** + * Created by Philipp Jahoda on 02/06/16. + */ +public abstract class BaseEntry { + + /** the y value */ + private float y = 0f; + + /** optional spot for additional data this Entry represents */ + private Object mData = null; + + /** optional icon image */ + private Drawable mIcon = null; + + public BaseEntry() { + + } + + public BaseEntry(float y) { + this.y = y; + } + + public BaseEntry(float y, Object data) { + this(y); + this.mData = data; + } + + public BaseEntry(float y, Drawable icon) { + this(y); + this.mIcon = icon; + } + + public BaseEntry(float y, Drawable icon, Object data) { + this(y); + this.mIcon = icon; + this.mData = data; + } + + /** + * Returns the y value of this Entry. + * + * @return + */ + public float getY() { + return y; + } + + /** + * Sets the icon drawable + * + * @param icon + */ + public void setIcon(Drawable icon) { + this.mIcon = icon; + } + + /** + * Returns the icon of this Entry. + * + * @return + */ + public Drawable getIcon() { + return mIcon; + } + + /** + * Sets the y-value for the Entry. + * + * @param y + */ + public void setY(float y) { + this.y = y; + } + + /** + * Returns the data, additional information that this Entry represents, or + * null, if no data has been specified. + * + * @return + */ + public Object getData() { + return mData; + } + + /** + * Sets additional data this Entry should represent. + * + * @param data + */ + public void setData(Object data) { + this.mData = data; + } +} diff --git a/MPChartLib/src/main/java/com/github/mikephil/charting/data/BubbleData.java b/MPChartLib/src/main/java/com/github/mikephil/charting/data/BubbleData.java new file mode 100644 index 00000000..8fb72f17 --- /dev/null +++ b/MPChartLib/src/main/java/com/github/mikephil/charting/data/BubbleData.java @@ -0,0 +1,34 @@ + +package com.github.mikephil.charting.data; + +import com.github.mikephil.charting.interfaces.datasets.IBubbleDataSet; + +import java.util.List; + +public class BubbleData extends BarLineScatterCandleBubbleData<IBubbleDataSet> { + + public BubbleData() { + super(); + } + + public BubbleData(IBubbleDataSet... dataSets) { + super(dataSets); + } + + public BubbleData(List<IBubbleDataSet> dataSets) { + super(dataSets); + } + + + /** + * Sets the width of the circle that surrounds the bubble when highlighted + * for all DataSet objects this data object contains, in dp. + * + * @param width + */ + public void setHighlightCircleWidth(float width) { + for (IBubbleDataSet set : mDataSets) { + set.setHighlightCircleWidth(width); + } + } +} diff --git a/MPChartLib/src/main/java/com/github/mikephil/charting/data/BubbleDataSet.java b/MPChartLib/src/main/java/com/github/mikephil/charting/data/BubbleDataSet.java new file mode 100644 index 00000000..9ef87fb2 --- /dev/null +++ b/MPChartLib/src/main/java/com/github/mikephil/charting/data/BubbleDataSet.java @@ -0,0 +1,71 @@ + +package com.github.mikephil.charting.data; + +import com.github.mikephil.charting.interfaces.datasets.IBubbleDataSet; +import com.github.mikephil.charting.utils.Utils; + +import java.util.ArrayList; +import java.util.List; + +public class BubbleDataSet extends BarLineScatterCandleBubbleDataSet<BubbleEntry> implements IBubbleDataSet { + + protected float mMaxSize; + protected boolean mNormalizeSize = true; + + private float mHighlightCircleWidth = 2.5f; + + public BubbleDataSet(List<BubbleEntry> yVals, String label) { + super(yVals, label); + } + + @Override + public void setHighlightCircleWidth(float width) { + mHighlightCircleWidth = Utils.convertDpToPixel(width); + } + + @Override + public float getHighlightCircleWidth() { + return mHighlightCircleWidth; + } + + @Override + protected void calcMinMax(BubbleEntry e) { + super.calcMinMax(e); + + final float size = e.getSize(); + + if (size > mMaxSize) { + mMaxSize = size; + } + } + + @Override + public DataSet<BubbleEntry> copy() { + List<BubbleEntry> entries = new ArrayList<BubbleEntry>(); + for (int i = 0; i < mEntries.size(); i++) { + entries.add(mEntries.get(i).copy()); + } + BubbleDataSet copied = new BubbleDataSet(entries, getLabel()); + copy(copied); + return copied; + } + + protected void copy(BubbleDataSet bubbleDataSet) { + bubbleDataSet.mHighlightCircleWidth = mHighlightCircleWidth; + bubbleDataSet.mNormalizeSize = mNormalizeSize; + } + + @Override + public float getMaxSize() { + return mMaxSize; + } + + @Override + public boolean isNormalizeSizeEnabled() { + return mNormalizeSize; + } + + public void setNormalizeSizeEnabled(boolean normalizeSize) { + mNormalizeSize = normalizeSize; + } +} diff --git a/MPChartLib/src/main/java/com/github/mikephil/charting/data/BubbleEntry.java b/MPChartLib/src/main/java/com/github/mikephil/charting/data/BubbleEntry.java new file mode 100644 index 00000000..35d8330a --- /dev/null +++ b/MPChartLib/src/main/java/com/github/mikephil/charting/data/BubbleEntry.java @@ -0,0 +1,91 @@ + +package com.github.mikephil.charting.data; + +import android.annotation.SuppressLint; +import android.graphics.drawable.Drawable; + +/** + * Subclass of Entry that holds a value for one entry in a BubbleChart. Bubble + * chart implementation: Copyright 2015 Pierre-Marc Airoldi Licensed under + * Apache License 2.0 + * + * @author Philipp Jahoda + */ +@SuppressLint("ParcelCreator") +public class BubbleEntry extends Entry { + + /** size value */ + private float mSize = 0f; + + /** + * Constructor. + * + * @param x The value on the x-axis. + * @param y The value on the y-axis. + * @param size The size of the bubble. + */ + public BubbleEntry(float x, float y, float size) { + super(x, y); + this.mSize = size; + } + + /** + * Constructor. + * + * @param x The value on the x-axis. + * @param y The value on the y-axis. + * @param size The size of the bubble. + * @param data Spot for additional data this Entry represents. + */ + public BubbleEntry(float x, float y, float size, Object data) { + super(x, y, data); + this.mSize = size; + } + + /** + * Constructor. + * + * @param x The value on the x-axis. + * @param y The value on the y-axis. + * @param size The size of the bubble. + * @param icon Icon image + */ + public BubbleEntry(float x, float y, float size, Drawable icon) { + super(x, y, icon); + this.mSize = size; + } + + /** + * Constructor. + * + * @param x The value on the x-axis. + * @param y The value on the y-axis. + * @param size The size of the bubble. + * @param icon Icon image + * @param data Spot for additional data this Entry represents. + */ + public BubbleEntry(float x, float y, float size, Drawable icon, Object data) { + super(x, y, icon, data); + this.mSize = size; + } + + public BubbleEntry copy() { + + BubbleEntry c = new BubbleEntry(getX(), getY(), mSize, getData()); + return c; + } + + /** + * Returns the size of this entry (the size of the bubble). + * + * @return + */ + public float getSize() { + return mSize; + } + + public void setSize(float size) { + this.mSize = size; + } + +} diff --git a/MPChartLib/src/main/java/com/github/mikephil/charting/data/CandleData.java b/MPChartLib/src/main/java/com/github/mikephil/charting/data/CandleData.java new file mode 100644 index 00000000..1e90db2b --- /dev/null +++ b/MPChartLib/src/main/java/com/github/mikephil/charting/data/CandleData.java @@ -0,0 +1,21 @@ +package com.github.mikephil.charting.data; + +import com.github.mikephil.charting.interfaces.datasets.ICandleDataSet; + +import java.util.ArrayList; +import java.util.List; + +public class CandleData extends BarLineScatterCandleBubbleData<ICandleDataSet> { + + public CandleData() { + super(); + } + + public CandleData(List<ICandleDataSet> dataSets) { + super(dataSets); + } + + public CandleData(ICandleDataSet... dataSets) { + super(dataSets); + } +} diff --git a/MPChartLib/src/main/java/com/github/mikephil/charting/data/CandleDataSet.java b/MPChartLib/src/main/java/com/github/mikephil/charting/data/CandleDataSet.java new file mode 100644 index 00000000..dcd5b76c --- /dev/null +++ b/MPChartLib/src/main/java/com/github/mikephil/charting/data/CandleDataSet.java @@ -0,0 +1,295 @@ + +package com.github.mikephil.charting.data; + +import android.graphics.Paint; + +import com.github.mikephil.charting.interfaces.datasets.ICandleDataSet; +import com.github.mikephil.charting.utils.ColorTemplate; +import com.github.mikephil.charting.utils.Utils; + +import java.util.ArrayList; +import java.util.List; + +/** + * DataSet for the CandleStickChart. + * + * @author Philipp Jahoda + */ +public class CandleDataSet extends LineScatterCandleRadarDataSet<CandleEntry> implements ICandleDataSet { + + /** + * the width of the shadow of the candle + */ + private float mShadowWidth = 3f; + + /** + * should the candle bars show? + * when false, only "ticks" will show + * <p/> + * - default: true + */ + private boolean mShowCandleBar = true; + + /** + * the space between the candle entries, default 0.1f (10%) + */ + private float mBarSpace = 0.1f; + + /** + * use candle color for the shadow + */ + private boolean mShadowColorSameAsCandle = false; + + /** + * paint style when open < close + * increasing candlesticks are traditionally hollow + */ + protected Paint.Style mIncreasingPaintStyle = Paint.Style.STROKE; + + /** + * paint style when open > close + * descreasing candlesticks are traditionally filled + */ + protected Paint.Style mDecreasingPaintStyle = Paint.Style.FILL; + + /** + * color for open == close + */ + protected int mNeutralColor = ColorTemplate.COLOR_SKIP; + + /** + * color for open < close + */ + protected int mIncreasingColor = ColorTemplate.COLOR_SKIP; + + /** + * color for open > close + */ + protected int mDecreasingColor = ColorTemplate.COLOR_SKIP; + + /** + * shadow line color, set -1 for backward compatibility and uses default + * color + */ + protected int mShadowColor = ColorTemplate.COLOR_SKIP; + + public CandleDataSet(List<CandleEntry> yVals, String label) { + super(yVals, label); + } + + @Override + public DataSet<CandleEntry> copy() { + List<CandleEntry> entries = new ArrayList<CandleEntry>(); + for (int i = 0; i < mEntries.size(); i++) { + entries.add(mEntries.get(i).copy()); + } + CandleDataSet copied = new CandleDataSet(entries, getLabel()); + copy(copied); + return copied; + } + + protected void copy(CandleDataSet candleDataSet) { + super.copy(candleDataSet); + candleDataSet.mShadowWidth = mShadowWidth; + candleDataSet.mShowCandleBar = mShowCandleBar; + candleDataSet.mBarSpace = mBarSpace; + candleDataSet.mShadowColorSameAsCandle = mShadowColorSameAsCandle; + candleDataSet.mHighLightColor = mHighLightColor; + candleDataSet.mIncreasingPaintStyle = mIncreasingPaintStyle; + candleDataSet.mDecreasingPaintStyle = mDecreasingPaintStyle; + candleDataSet.mNeutralColor = mNeutralColor; + candleDataSet.mIncreasingColor = mIncreasingColor; + candleDataSet.mDecreasingColor = mDecreasingColor; + candleDataSet.mShadowColor = mShadowColor; + } + + @Override + protected void calcMinMax(CandleEntry e) { + + if (e.getLow() < mYMin) + mYMin = e.getLow(); + + if (e.getHigh() > mYMax) + mYMax = e.getHigh(); + + calcMinMaxX(e); + } + + @Override + protected void calcMinMaxY(CandleEntry e) { + + if (e.getHigh() < mYMin) + mYMin = e.getHigh(); + + if (e.getHigh() > mYMax) + mYMax = e.getHigh(); + + if (e.getLow() < mYMin) + mYMin = e.getLow(); + + if (e.getLow() > mYMax) + mYMax = e.getLow(); + } + + /** + * Sets the space that is left out on the left and right side of each + * candle, default 0.1f (10%), max 0.45f, min 0f + * + * @param space + */ + public void setBarSpace(float space) { + + if (space < 0f) + space = 0f; + if (space > 0.45f) + space = 0.45f; + + mBarSpace = space; + } + + @Override + public float getBarSpace() { + return mBarSpace; + } + + /** + * Sets the width of the candle-shadow-line in pixels. Default 3f. + * + * @param width + */ + public void setShadowWidth(float width) { + mShadowWidth = Utils.convertDpToPixel(width); + } + + @Override + public float getShadowWidth() { + return mShadowWidth; + } + + /** + * Sets whether the candle bars should show? + * + * @param showCandleBar + */ + public void setShowCandleBar(boolean showCandleBar) { + mShowCandleBar = showCandleBar; + } + + @Override + public boolean getShowCandleBar() { + return mShowCandleBar; + } + + // TODO + /** + * It is necessary to implement ColorsList class that will encapsulate + * colors list functionality, because It's wrong to copy paste setColor, + * addColor, ... resetColors for each time when we want to add a coloring + * options for one of objects + * + * @author Mesrop + */ + + /** BELOW THIS COLOR HANDLING */ + + /** + * Sets the one and ONLY color that should be used for this DataSet when + * open == close. + * + * @param color + */ + public void setNeutralColor(int color) { + mNeutralColor = color; + } + + @Override + public int getNeutralColor() { + return mNeutralColor; + } + + /** + * Sets the one and ONLY color that should be used for this DataSet when + * open <= close. + * + * @param color + */ + public void setIncreasingColor(int color) { + mIncreasingColor = color; + } + + @Override + public int getIncreasingColor() { + return mIncreasingColor; + } + + /** + * Sets the one and ONLY color that should be used for this DataSet when + * open > close. + * + * @param color + */ + public void setDecreasingColor(int color) { + mDecreasingColor = color; + } + + @Override + public int getDecreasingColor() { + return mDecreasingColor; + } + + @Override + public Paint.Style getIncreasingPaintStyle() { + return mIncreasingPaintStyle; + } + + /** + * Sets paint style when open < close + * + * @param paintStyle + */ + public void setIncreasingPaintStyle(Paint.Style paintStyle) { + this.mIncreasingPaintStyle = paintStyle; + } + + @Override + public Paint.Style getDecreasingPaintStyle() { + return mDecreasingPaintStyle; + } + + /** + * Sets paint style when open > close + * + * @param decreasingPaintStyle + */ + public void setDecreasingPaintStyle(Paint.Style decreasingPaintStyle) { + this.mDecreasingPaintStyle = decreasingPaintStyle; + } + + @Override + public int getShadowColor() { + return mShadowColor; + } + + /** + * Sets shadow color for all entries + * + * @param shadowColor + */ + public void setShadowColor(int shadowColor) { + this.mShadowColor = shadowColor; + } + + @Override + public boolean getShadowColorSameAsCandle() { + return mShadowColorSameAsCandle; + } + + /** + * Sets shadow color to be the same color as the candle color + * + * @param shadowColorSameAsCandle + */ + public void setShadowColorSameAsCandle(boolean shadowColorSameAsCandle) { + this.mShadowColorSameAsCandle = shadowColorSameAsCandle; + } +} diff --git a/MPChartLib/src/main/java/com/github/mikephil/charting/data/CandleEntry.java b/MPChartLib/src/main/java/com/github/mikephil/charting/data/CandleEntry.java new file mode 100644 index 00000000..5a049957 --- /dev/null +++ b/MPChartLib/src/main/java/com/github/mikephil/charting/data/CandleEntry.java @@ -0,0 +1,193 @@ + +package com.github.mikephil.charting.data; + +import android.annotation.SuppressLint; +import android.graphics.drawable.Drawable; + +/** + * Subclass of Entry that holds all values for one entry in a CandleStickChart. + * + * @author Philipp Jahoda + */ +@SuppressLint("ParcelCreator") +public class CandleEntry extends Entry { + + /** shadow-high value */ + private float mShadowHigh = 0f; + + /** shadow-low value */ + private float mShadowLow = 0f; + + /** close value */ + private float mClose = 0f; + + /** open value */ + private float mOpen = 0f; + + /** + * Constructor. + * + * @param x The value on the x-axis + * @param shadowH The (shadow) high value + * @param shadowL The (shadow) low value + * @param open The open value + * @param close The close value + */ + public CandleEntry(float x, float shadowH, float shadowL, float open, float close) { + super(x, (shadowH + shadowL) / 2f); + + this.mShadowHigh = shadowH; + this.mShadowLow = shadowL; + this.mOpen = open; + this.mClose = close; + } + + /** + * Constructor. + * + * @param x The value on the x-axis + * @param shadowH The (shadow) high value + * @param shadowL The (shadow) low value + * @param open + * @param close + * @param data Spot for additional data this Entry represents + */ + public CandleEntry(float x, float shadowH, float shadowL, float open, float close, + Object data) { + super(x, (shadowH + shadowL) / 2f, data); + + this.mShadowHigh = shadowH; + this.mShadowLow = shadowL; + this.mOpen = open; + this.mClose = close; + } + + /** + * Constructor. + * + * @param x The value on the x-axis + * @param shadowH The (shadow) high value + * @param shadowL The (shadow) low value + * @param open + * @param close + * @param icon Icon image + */ + public CandleEntry(float x, float shadowH, float shadowL, float open, float close, + Drawable icon) { + super(x, (shadowH + shadowL) / 2f, icon); + + this.mShadowHigh = shadowH; + this.mShadowLow = shadowL; + this.mOpen = open; + this.mClose = close; + } + + /** + * Constructor. + * + * @param x The value on the x-axis + * @param shadowH The (shadow) high value + * @param shadowL The (shadow) low value + * @param open + * @param close + * @param icon Icon image + * @param data Spot for additional data this Entry represents + */ + public CandleEntry(float x, float shadowH, float shadowL, float open, float close, + Drawable icon, Object data) { + super(x, (shadowH + shadowL) / 2f, icon, data); + + this.mShadowHigh = shadowH; + this.mShadowLow = shadowL; + this.mOpen = open; + this.mClose = close; + } + + /** + * Returns the overall range (difference) between shadow-high and + * shadow-low. + * + * @return + */ + public float getShadowRange() { + return Math.abs(mShadowHigh - mShadowLow); + } + + /** + * Returns the body size (difference between open and close). + * + * @return + */ + public float getBodyRange() { + return Math.abs(mOpen - mClose); + } + + /** + * Returns the center value of the candle. (Middle value between high and + * low) + */ + @Override + public float getY() { + return super.getY(); + } + + public CandleEntry copy() { + + CandleEntry c = new CandleEntry(getX(), mShadowHigh, mShadowLow, mOpen, + mClose, getData()); + + return c; + } + + /** + * Returns the upper shadows highest value. + * + * @return + */ + public float getHigh() { + return mShadowHigh; + } + + public void setHigh(float mShadowHigh) { + this.mShadowHigh = mShadowHigh; + } + + /** + * Returns the lower shadows lowest value. + * + * @return + */ + public float getLow() { + return mShadowLow; + } + + public void setLow(float mShadowLow) { + this.mShadowLow = mShadowLow; + } + + /** + * Returns the bodys close value. + * + * @return + */ + public float getClose() { + return mClose; + } + + public void setClose(float mClose) { + this.mClose = mClose; + } + + /** + * Returns the bodys open value. + * + * @return + */ + public float getOpen() { + return mOpen; + } + + public void setOpen(float mOpen) { + this.mOpen = mOpen; + } +} diff --git a/MPChartLib/src/main/java/com/github/mikephil/charting/data/ChartData.java b/MPChartLib/src/main/java/com/github/mikephil/charting/data/ChartData.java new file mode 100644 index 00000000..bfc5ed70 --- /dev/null +++ b/MPChartLib/src/main/java/com/github/mikephil/charting/data/ChartData.java @@ -0,0 +1,821 @@ + +package com.github.mikephil.charting.data; + +import android.graphics.Typeface; +import android.util.Log; + +import com.github.mikephil.charting.components.YAxis.AxisDependency; +import com.github.mikephil.charting.formatter.IValueFormatter; +import com.github.mikephil.charting.highlight.Highlight; +import com.github.mikephil.charting.interfaces.datasets.IDataSet; + +import java.util.ArrayList; +import java.util.List; + +/** + * Class that holds all relevant data that represents the chart. That involves + * at least one (or more) DataSets, and an array of x-values. + * + * @author Philipp Jahoda + */ +public abstract class ChartData<T extends IDataSet<? extends Entry>> { + + /** + * maximum y-value in the value array across all axes + */ + protected float mYMax = -Float.MAX_VALUE; + + /** + * the minimum y-value in the value array across all axes + */ + protected float mYMin = Float.MAX_VALUE; + + /** + * maximum x-value in the value array + */ + protected float mXMax = -Float.MAX_VALUE; + + /** + * minimum x-value in the value array + */ + protected float mXMin = Float.MAX_VALUE; + + + protected float mLeftAxisMax = -Float.MAX_VALUE; + + protected float mLeftAxisMin = Float.MAX_VALUE; + + protected float mRightAxisMax = -Float.MAX_VALUE; + + protected float mRightAxisMin = Float.MAX_VALUE; + + /** + * array that holds all DataSets the ChartData object represents + */ + protected List<T> mDataSets; + + /** + * Default constructor. + */ + public ChartData() { + mDataSets = new ArrayList<T>(); + } + + /** + * Constructor taking single or multiple DataSet objects. + * + * @param dataSets + */ + public ChartData(T... dataSets) { + mDataSets = arrayToList(dataSets); + notifyDataChanged(); + } + + /** + * Created because Arrays.asList(...) does not support modification. + * + * @param array + * @return + */ + private List<T> arrayToList(T[] array) { + + List<T> list = new ArrayList<>(); + + for (T set : array) { + list.add(set); + } + + return list; + } + + /** + * constructor for chart data + * + * @param sets the dataset array + */ + public ChartData(List<T> sets) { + this.mDataSets = sets; + notifyDataChanged(); + } + + /** + * Call this method to let the ChartData know that the underlying data has + * changed. Calling this performs all necessary recalculations needed when + * the contained data has changed. + */ + public void notifyDataChanged() { + calcMinMax(); + } + + /** + * Calc minimum and maximum y-values over all DataSets. + * Tell DataSets to recalculate their min and max y-values, this is only needed for autoScaleMinMax. + * + * @param fromX the x-value to start the calculation from + * @param toX the x-value to which the calculation should be performed + */ + public void calcMinMaxY(float fromX, float toX) { + + for (T set : mDataSets) { + set.calcMinMaxY(fromX, toX); + } + + // apply the new data + calcMinMax(); + } + + /** + * Calc minimum and maximum values (both x and y) over all DataSets. + */ + protected void calcMinMax() { + + if (mDataSets == null) + return; + + mYMax = -Float.MAX_VALUE; + mYMin = Float.MAX_VALUE; + mXMax = -Float.MAX_VALUE; + mXMin = Float.MAX_VALUE; + + for (T set : mDataSets) { + calcMinMax(set); + } + + mLeftAxisMax = -Float.MAX_VALUE; + mLeftAxisMin = Float.MAX_VALUE; + mRightAxisMax = -Float.MAX_VALUE; + mRightAxisMin = Float.MAX_VALUE; + + // left axis + T firstLeft = getFirstLeft(mDataSets); + + if (firstLeft != null) { + + mLeftAxisMax = firstLeft.getYMax(); + mLeftAxisMin = firstLeft.getYMin(); + + for (T dataSet : mDataSets) { + if (dataSet.getAxisDependency() == AxisDependency.LEFT) { + if (dataSet.getYMin() < mLeftAxisMin) + mLeftAxisMin = dataSet.getYMin(); + + if (dataSet.getYMax() > mLeftAxisMax) + mLeftAxisMax = dataSet.getYMax(); + } + } + } + + // right axis + T firstRight = getFirstRight(mDataSets); + + if (firstRight != null) { + + mRightAxisMax = firstRight.getYMax(); + mRightAxisMin = firstRight.getYMin(); + + for (T dataSet : mDataSets) { + if (dataSet.getAxisDependency() == AxisDependency.RIGHT) { + if (dataSet.getYMin() < mRightAxisMin) + mRightAxisMin = dataSet.getYMin(); + + if (dataSet.getYMax() > mRightAxisMax) + mRightAxisMax = dataSet.getYMax(); + } + } + } + } + + /** ONLY GETTERS AND SETTERS BELOW THIS */ + + /** + * returns the number of LineDataSets this object contains + * + * @return + */ + public int getDataSetCount() { + if (mDataSets == null) + return 0; + return mDataSets.size(); + } + + /** + * Returns the smallest y-value the data object contains. + * + * @return + */ + public float getYMin() { + return mYMin; + } + + /** + * Returns the minimum y-value for the specified axis. + * + * @param axis + * @return + */ + public float getYMin(AxisDependency axis) { + if (axis == AxisDependency.LEFT) { + + if (mLeftAxisMin == Float.MAX_VALUE) { + return mRightAxisMin; + } else + return mLeftAxisMin; + } else { + if (mRightAxisMin == Float.MAX_VALUE) { + return mLeftAxisMin; + } else + return mRightAxisMin; + } + } + + /** + * Returns the greatest y-value the data object contains. + * + * @return + */ + public float getYMax() { + return mYMax; + } + + /** + * Returns the maximum y-value for the specified axis. + * + * @param axis + * @return + */ + public float getYMax(AxisDependency axis) { + if (axis == AxisDependency.LEFT) { + + if (mLeftAxisMax == -Float.MAX_VALUE) { + return mRightAxisMax; + } else + return mLeftAxisMax; + } else { + if (mRightAxisMax == -Float.MAX_VALUE) { + return mLeftAxisMax; + } else + return mRightAxisMax; + } + } + + /** + * Returns the minimum x-value this data object contains. + * + * @return + */ + public float getXMin() { + return mXMin; + } + + /** + * Returns the maximum x-value this data object contains. + * + * @return + */ + public float getXMax() { + return mXMax; + } + + /** + * Returns all DataSet objects this ChartData object holds. + * + * @return + */ + public List<T> getDataSets() { + return mDataSets; + } + + /** + * Retrieve the index of a DataSet with a specific label from the ChartData. + * Search can be case sensitive or not. IMPORTANT: This method does + * calculations at runtime, do not over-use in performance critical + * situations. + * + * @param dataSets the DataSet array to search + * @param label + * @param ignorecase if true, the search is not case-sensitive + * @return + */ + protected int getDataSetIndexByLabel(List<T> dataSets, String label, + boolean ignorecase) { + + if (ignorecase) { + for (int i = 0; i < dataSets.size(); i++) + if (label.equalsIgnoreCase(dataSets.get(i).getLabel())) + return i; + } else { + for (int i = 0; i < dataSets.size(); i++) + if (label.equals(dataSets.get(i).getLabel())) + return i; + } + + return -1; + } + + /** + * Returns the labels of all DataSets as a string array. + * + * @return + */ + public String[] getDataSetLabels() { + + String[] types = new String[mDataSets.size()]; + + for (int i = 0; i < mDataSets.size(); i++) { + types[i] = mDataSets.get(i).getLabel(); + } + + return types; + } + + /** + * Get the Entry for a corresponding highlight object + * + * @param highlight + * @return the entry that is highlighted + */ + public Entry getEntryForHighlight(Highlight highlight) { + if (highlight.getDataSetIndex() >= mDataSets.size()) + return null; + else { + return mDataSets.get(highlight.getDataSetIndex()).getEntryForXValue(highlight.getX(), highlight.getY()); + } + } + + /** + * Returns the DataSet object with the given label. Search can be case + * sensitive or not. IMPORTANT: This method does calculations at runtime. + * Use with care in performance critical situations. + * + * @param label + * @param ignorecase + * @return + */ + public T getDataSetByLabel(String label, boolean ignorecase) { + + int index = getDataSetIndexByLabel(mDataSets, label, ignorecase); + + if (index < 0 || index >= mDataSets.size()) + return null; + else + return mDataSets.get(index); + } + + public T getDataSetByIndex(int index) { + + if (mDataSets == null || index < 0 || index >= mDataSets.size()) + return null; + + return mDataSets.get(index); + } + + /** + * Adds a DataSet dynamically. + * + * @param d + */ + public void addDataSet(T d) { + + if (d == null) + return; + + calcMinMax(d); + + mDataSets.add(d); + } + + /** + * Removes the given DataSet from this data object. Also recalculates all + * minimum and maximum values. Returns true if a DataSet was removed, false + * if no DataSet could be removed. + * + * @param d + */ + public boolean removeDataSet(T d) { + + if (d == null) + return false; + + boolean removed = mDataSets.remove(d); + + // if a DataSet was removed + if (removed) { + notifyDataChanged(); + } + + return removed; + } + + /** + * Removes the DataSet at the given index in the DataSet array from the data + * object. Also recalculates all minimum and maximum values. Returns true if + * a DataSet was removed, false if no DataSet could be removed. + * + * @param index + */ + public boolean removeDataSet(int index) { + + if (index >= mDataSets.size() || index < 0) + return false; + + T set = mDataSets.get(index); + return removeDataSet(set); + } + + /** + * Adds an Entry to the DataSet at the specified index. + * Entries are added to the end of the list. + * + * @param e + * @param dataSetIndex + */ + public void addEntry(Entry e, int dataSetIndex) { + + if (mDataSets.size() > dataSetIndex && dataSetIndex >= 0) { + + IDataSet set = mDataSets.get(dataSetIndex); + // add the entry to the dataset + if (!set.addEntry(e)) + return; + + calcMinMax(e, set.getAxisDependency()); + + } else { + Log.e("addEntry", "Cannot add Entry because dataSetIndex too high or too low."); + } + } + + /** + * Adjusts the current minimum and maximum values based on the provided Entry object. + * + * @param e + * @param axis + */ + protected void calcMinMax(Entry e, AxisDependency axis) { + + if (mYMax < e.getY()) + mYMax = e.getY(); + if (mYMin > e.getY()) + mYMin = e.getY(); + + if (mXMax < e.getX()) + mXMax = e.getX(); + if (mXMin > e.getX()) + mXMin = e.getX(); + + if (axis == AxisDependency.LEFT) { + + if (mLeftAxisMax < e.getY()) + mLeftAxisMax = e.getY(); + if (mLeftAxisMin > e.getY()) + mLeftAxisMin = e.getY(); + } else { + if (mRightAxisMax < e.getY()) + mRightAxisMax = e.getY(); + if (mRightAxisMin > e.getY()) + mRightAxisMin = e.getY(); + } + } + + /** + * Adjusts the minimum and maximum values based on the given DataSet. + * + * @param d + */ + protected void calcMinMax(T d) { + + if (mYMax < d.getYMax()) + mYMax = d.getYMax(); + if (mYMin > d.getYMin()) + mYMin = d.getYMin(); + + if (mXMax < d.getXMax()) + mXMax = d.getXMax(); + if (mXMin > d.getXMin()) + mXMin = d.getXMin(); + + if (d.getAxisDependency() == AxisDependency.LEFT) { + + if (mLeftAxisMax < d.getYMax()) + mLeftAxisMax = d.getYMax(); + if (mLeftAxisMin > d.getYMin()) + mLeftAxisMin = d.getYMin(); + } else { + if (mRightAxisMax < d.getYMax()) + mRightAxisMax = d.getYMax(); + if (mRightAxisMin > d.getYMin()) + mRightAxisMin = d.getYMin(); + } + } + + /** + * Removes the given Entry object from the DataSet at the specified index. + * + * @param e + * @param dataSetIndex + */ + public boolean removeEntry(Entry e, int dataSetIndex) { + + // entry null, outofbounds + if (e == null || dataSetIndex >= mDataSets.size()) + return false; + + IDataSet set = mDataSets.get(dataSetIndex); + + if (set != null) { + // remove the entry from the dataset + boolean removed = set.removeEntry(e); + + if (removed) { + notifyDataChanged(); + } + + return removed; + } else + return false; + } + + /** + * Removes the Entry object closest to the given DataSet at the + * specified index. Returns true if an Entry was removed, false if no Entry + * was found that meets the specified requirements. + * + * @param xValue + * @param dataSetIndex + * @return + */ + public boolean removeEntry(float xValue, int dataSetIndex) { + + if (dataSetIndex >= mDataSets.size()) + return false; + + IDataSet dataSet = mDataSets.get(dataSetIndex); + Entry e = dataSet.getEntryForXValue(xValue, Float.NaN); + + if (e == null) + return false; + + return removeEntry(e, dataSetIndex); + } + + /** + * Returns the DataSet that contains the provided Entry, or null, if no + * DataSet contains this Entry. + * + * @param e + * @return + */ + public T getDataSetForEntry(Entry e) { + + if (e == null) + return null; + + for (int i = 0; i < mDataSets.size(); i++) { + + T set = mDataSets.get(i); + + for (int j = 0; j < set.getEntryCount(); j++) { + if (e.equalTo(set.getEntryForXValue(e.getX(), e.getY()))) + return set; + } + } + + return null; + } + + /** + * Returns all colors used across all DataSet objects this object + * represents. + * + * @return + */ + public int[] getColors() { + + if (mDataSets == null) + return null; + + int clrcnt = 0; + + for (int i = 0; i < mDataSets.size(); i++) { + clrcnt += mDataSets.get(i).getColors().size(); + } + + int[] colors = new int[clrcnt]; + int cnt = 0; + + for (int i = 0; i < mDataSets.size(); i++) { + + List<Integer> clrs = mDataSets.get(i).getColors(); + + for (Integer clr : clrs) { + colors[cnt] = clr; + cnt++; + } + } + + return colors; + } + + /** + * Returns the index of the provided DataSet in the DataSet array of this data object, or -1 if it does not exist. + * + * @param dataSet + * @return + */ + public int getIndexOfDataSet(T dataSet) { + return mDataSets.indexOf(dataSet); + } + + /** + * Returns the first DataSet from the datasets-array that has it's dependency on the left axis. + * Returns null if no DataSet with left dependency could be found. + * + * @return + */ + protected T getFirstLeft(List<T> sets) { + for (T dataSet : sets) { + if (dataSet.getAxisDependency() == AxisDependency.LEFT) + return dataSet; + } + return null; + } + + /** + * Returns the first DataSet from the datasets-array that has it's dependency on the right axis. + * Returns null if no DataSet with right dependency could be found. + * + * @return + */ + public T getFirstRight(List<T> sets) { + for (T dataSet : sets) { + if (dataSet.getAxisDependency() == AxisDependency.RIGHT) + return dataSet; + } + return null; + } + + /** + * Sets a custom IValueFormatter for all DataSets this data object contains. + * + * @param f + */ + public void setValueFormatter(IValueFormatter f) { + if (f == null) + return; + else { + for (IDataSet set : mDataSets) { + set.setValueFormatter(f); + } + } + } + + /** + * Sets the color of the value-text (color in which the value-labels are + * drawn) for all DataSets this data object contains. + * + * @param color + */ + public void setValueTextColor(int color) { + for (IDataSet set : mDataSets) { + set.setValueTextColor(color); + } + } + + /** + * Sets the same list of value-colors for all DataSets this + * data object contains. + * + * @param colors + */ + public void setValueTextColors(List<Integer> colors) { + for (IDataSet set : mDataSets) { + set.setValueTextColors(colors); + } + } + + /** + * Sets the Typeface for all value-labels for all DataSets this data object + * contains. + * + * @param tf + */ + public void setValueTypeface(Typeface tf) { + for (IDataSet set : mDataSets) { + set.setValueTypeface(tf); + } + } + + /** + * Sets the size (in dp) of the value-text for all DataSets this data object + * contains. + * + * @param size + */ + public void setValueTextSize(float size) { + for (IDataSet set : mDataSets) { + set.setValueTextSize(size); + } + } + + /** + * Enables / disables drawing values (value-text) for all DataSets this data + * object contains. + * + * @param enabled + */ + public void setDrawValues(boolean enabled) { + for (IDataSet set : mDataSets) { + set.setDrawValues(enabled); + } + } + + /** + * Enables / disables highlighting values for all DataSets this data object + * contains. If set to true, this means that values can + * be highlighted programmatically or by touch gesture. + */ + public void setHighlightEnabled(boolean enabled) { + for (IDataSet set : mDataSets) { + set.setHighlightEnabled(enabled); + } + } + + /** + * Returns true if highlighting of all underlying values is enabled, false + * if not. + * + * @return + */ + public boolean isHighlightEnabled() { + for (IDataSet set : mDataSets) { + if (!set.isHighlightEnabled()) + return false; + } + return true; + } + + /** + * Clears this data object from all DataSets and removes all Entries. Don't + * forget to invalidate the chart after this. + */ + public void clearValues() { + if (mDataSets != null) { + mDataSets.clear(); + } + notifyDataChanged(); + } + + /** + * Checks if this data object contains the specified DataSet. Returns true + * if so, false if not. + * + * @param dataSet + * @return + */ + public boolean contains(T dataSet) { + + for (T set : mDataSets) { + if (set.equals(dataSet)) + return true; + } + + return false; + } + + /** + * Returns the total entry count across all DataSet objects this data object contains. + * + * @return + */ + public int getEntryCount() { + + int count = 0; + + for (T set : mDataSets) { + count += set.getEntryCount(); + } + + return count; + } + + /** + * Returns the DataSet object with the maximum number of entries or null if there are no DataSets. + * + * @return + */ + public T getMaxEntryCountSet() { + + if (mDataSets == null || mDataSets.isEmpty()) + return null; + + T max = mDataSets.get(0); + + for (T set : mDataSets) { + + if (set.getEntryCount() > max.getEntryCount()) + max = set; + } + + return max; + } +} diff --git a/MPChartLib/src/main/java/com/github/mikephil/charting/data/CombinedData.java b/MPChartLib/src/main/java/com/github/mikephil/charting/data/CombinedData.java new file mode 100644 index 00000000..0b36aa3b --- /dev/null +++ b/MPChartLib/src/main/java/com/github/mikephil/charting/data/CombinedData.java @@ -0,0 +1,272 @@ + +package com.github.mikephil.charting.data; + +import android.util.Log; + +import com.github.mikephil.charting.components.YAxis; +import com.github.mikephil.charting.highlight.Highlight; +import com.github.mikephil.charting.interfaces.datasets.IBarLineScatterCandleBubbleDataSet; + +import java.util.ArrayList; +import java.util.List; + +/** + * Data object that allows the combination of Line-, Bar-, Scatter-, Bubble- and + * CandleData. Used in the CombinedChart class. + * + * @author Philipp Jahoda + */ +public class CombinedData extends BarLineScatterCandleBubbleData<IBarLineScatterCandleBubbleDataSet<? extends Entry>> { + + private LineData mLineData; + private BarData mBarData; + private ScatterData mScatterData; + private CandleData mCandleData; + private BubbleData mBubbleData; + + public CombinedData() { + super(); + } + + public void setData(LineData data) { + mLineData = data; + notifyDataChanged(); + } + + public void setData(BarData data) { + mBarData = data; + notifyDataChanged(); + } + + public void setData(ScatterData data) { + mScatterData = data; + notifyDataChanged(); + } + + public void setData(CandleData data) { + mCandleData = data; + notifyDataChanged(); + } + + public void setData(BubbleData data) { + mBubbleData = data; + notifyDataChanged(); + } + + @Override + public void calcMinMax() { + + if(mDataSets == null){ + mDataSets = new ArrayList<>(); + } + mDataSets.clear(); + + mYMax = -Float.MAX_VALUE; + mYMin = Float.MAX_VALUE; + mXMax = -Float.MAX_VALUE; + mXMin = Float.MAX_VALUE; + + mLeftAxisMax = -Float.MAX_VALUE; + mLeftAxisMin = Float.MAX_VALUE; + mRightAxisMax = -Float.MAX_VALUE; + mRightAxisMin = Float.MAX_VALUE; + + List<BarLineScatterCandleBubbleData> allData = getAllData(); + + for (ChartData data : allData) { + + data.calcMinMax(); + + List<IBarLineScatterCandleBubbleDataSet<? extends Entry>> sets = data.getDataSets(); + mDataSets.addAll(sets); + + if (data.getYMax() > mYMax) + mYMax = data.getYMax(); + + if (data.getYMin() < mYMin) + mYMin = data.getYMin(); + + if (data.getXMax() > mXMax) + mXMax = data.getXMax(); + + if (data.getXMin() < mXMin) + mXMin = data.getXMin(); + + for (IBarLineScatterCandleBubbleDataSet<? extends Entry> dataset : sets) { + if (dataset.getAxisDependency() == YAxis.AxisDependency.LEFT) { + if (dataset.getYMax() > mLeftAxisMax) { + mLeftAxisMax = dataset.getYMax(); + } + + if (dataset.getYMin() < mLeftAxisMin) { + mLeftAxisMin = dataset.getYMin(); + } + } + else { + if (dataset.getYMax() > mRightAxisMax) { + mRightAxisMax = dataset.getYMax(); + } + + if (dataset.getYMin() < mRightAxisMin) { + mRightAxisMin = dataset.getYMin(); + } + } + } + } + } + + public BubbleData getBubbleData() { + return mBubbleData; + } + + public LineData getLineData() { + return mLineData; + } + + public BarData getBarData() { + return mBarData; + } + + public ScatterData getScatterData() { + return mScatterData; + } + + public CandleData getCandleData() { + return mCandleData; + } + + /** + * Returns all data objects in row: line-bar-scatter-candle-bubble if not null. + * + * @return + */ + public List<BarLineScatterCandleBubbleData> getAllData() { + + List<BarLineScatterCandleBubbleData> data = new ArrayList<BarLineScatterCandleBubbleData>(); + if (mLineData != null) + data.add(mLineData); + if (mBarData != null) + data.add(mBarData); + if (mScatterData != null) + data.add(mScatterData); + if (mCandleData != null) + data.add(mCandleData); + if (mBubbleData != null) + data.add(mBubbleData); + + return data; + } + + public BarLineScatterCandleBubbleData getDataByIndex(int index) { + return getAllData().get(index); + } + + @Override + public void notifyDataChanged() { + if (mLineData != null) + mLineData.notifyDataChanged(); + if (mBarData != null) + mBarData.notifyDataChanged(); + if (mCandleData != null) + mCandleData.notifyDataChanged(); + if (mScatterData != null) + mScatterData.notifyDataChanged(); + if (mBubbleData != null) + mBubbleData.notifyDataChanged(); + + calcMinMax(); // recalculate everything + } + + /** + * Get the Entry for a corresponding highlight object + * + * @param highlight + * @return the entry that is highlighted + */ + @Override + public Entry getEntryForHighlight(Highlight highlight) { + + if (highlight.getDataIndex() >= getAllData().size()) + return null; + + ChartData data = getDataByIndex(highlight.getDataIndex()); + + if (highlight.getDataSetIndex() >= data.getDataSetCount()) + return null; + + // The value of the highlighted entry could be NaN - + // if we are not interested in highlighting a specific value. + + List<Entry> entries = data.getDataSetByIndex(highlight.getDataSetIndex()) + .getEntriesForXValue(highlight.getX()); + for (Entry entry : entries) + if (entry.getY() == highlight.getY() || + Float.isNaN(highlight.getY())) + return entry; + + return null; + } + + /** + * Get dataset for highlight + * + * @param highlight current highlight + * @return dataset related to highlight + */ + public IBarLineScatterCandleBubbleDataSet<? extends Entry> getDataSetByHighlight(Highlight highlight) { + if (highlight.getDataIndex() >= getAllData().size()) + return null; + + BarLineScatterCandleBubbleData data = getDataByIndex(highlight.getDataIndex()); + + if (highlight.getDataSetIndex() >= data.getDataSetCount()) + return null; + + return (IBarLineScatterCandleBubbleDataSet<? extends Entry>) + data.getDataSets().get(highlight.getDataSetIndex()); + } + + public int getDataIndex(ChartData data) { + return getAllData().indexOf(data); + } + + @Override + public boolean removeDataSet(IBarLineScatterCandleBubbleDataSet<? extends Entry> d) { + + List<BarLineScatterCandleBubbleData> datas = getAllData(); + + boolean success = false; + + for (ChartData data : datas) { + + success = data.removeDataSet(d); + + if (success) { + break; + } + } + + return success; + } + + @Deprecated + @Override + public boolean removeDataSet(int index) { + Log.e("MPAndroidChart", "removeDataSet(int index) not supported for CombinedData"); + return false; + } + + @Deprecated + @Override + public boolean removeEntry(Entry e, int dataSetIndex) { + Log.e("MPAndroidChart", "removeEntry(...) not supported for CombinedData"); + return false; + } + + @Deprecated + @Override + public boolean removeEntry(float xValue, int dataSetIndex) { + Log.e("MPAndroidChart", "removeEntry(...) not supported for CombinedData"); + return false; + } +} diff --git a/MPChartLib/src/main/java/com/github/mikephil/charting/data/DataSet.java b/MPChartLib/src/main/java/com/github/mikephil/charting/data/DataSet.java new file mode 100644 index 00000000..fda07efe --- /dev/null +++ b/MPChartLib/src/main/java/com/github/mikephil/charting/data/DataSet.java @@ -0,0 +1,456 @@ + +package com.github.mikephil.charting.data; + +import java.util.ArrayList; +import java.util.List; + +/** + * The DataSet class represents one group or type of entries (Entry) in the + * Chart that belong together. It is designed to logically separate different + * groups of values inside the Chart (e.g. the values for a specific line in the + * LineChart, or the values of a specific group of bars in the BarChart). + * + * @author Philipp Jahoda + */ +public abstract class DataSet<T extends Entry> extends BaseDataSet<T> { + + /** + * the entries that this DataSet represents / holds together + */ + protected List<T> mEntries; + + /** + * maximum y-value in the value array + */ + protected float mYMax = -Float.MAX_VALUE; + + /** + * minimum y-value in the value array + */ + protected float mYMin = Float.MAX_VALUE; + + /** + * maximum x-value in the value array + */ + protected float mXMax = -Float.MAX_VALUE; + + /** + * minimum x-value in the value array + */ + protected float mXMin = Float.MAX_VALUE; + + + /** + * Creates a new DataSet object with the given values (entries) it represents. Also, a + * label that describes the DataSet can be specified. The label can also be + * used to retrieve the DataSet from a ChartData object. + * + * @param entries + * @param label + */ + public DataSet(List<T> entries, String label) { + super(label); + this.mEntries = entries; + + if (mEntries == null) + mEntries = new ArrayList<T>(); + + calcMinMax(); + } + + @Override + public void calcMinMax() { + + mYMax = -Float.MAX_VALUE; + mYMin = Float.MAX_VALUE; + mXMax = -Float.MAX_VALUE; + mXMin = Float.MAX_VALUE; + + if (mEntries == null || mEntries.isEmpty()) + return; + + for (T e : mEntries) { + calcMinMax(e); + } + } + + @Override + public void calcMinMaxY(float fromX, float toX) { + mYMax = -Float.MAX_VALUE; + mYMin = Float.MAX_VALUE; + + if (mEntries == null || mEntries.isEmpty()) + return; + + int indexFrom = getEntryIndex(fromX, Float.NaN, Rounding.DOWN); + int indexTo = getEntryIndex(toX, Float.NaN, Rounding.UP); + + if (indexTo < indexFrom) return; + + for (int i = indexFrom; i <= indexTo; i++) { + + // only recalculate y + calcMinMaxY(mEntries.get(i)); + } + } + + /** + * Updates the min and max x and y value of this DataSet based on the given Entry. + * + * @param e + */ + protected void calcMinMax(T e) { + + if (e == null) + return; + + calcMinMaxX(e); + + calcMinMaxY(e); + } + + protected void calcMinMaxX(T e) { + + if (e.getX() < mXMin) + mXMin = e.getX(); + + if (e.getX() > mXMax) + mXMax = e.getX(); + } + + protected void calcMinMaxY(T e) { + + if (e.getY() < mYMin) + mYMin = e.getY(); + + if (e.getY() > mYMax) + mYMax = e.getY(); + } + + @Override + public int getEntryCount() { + return mEntries.size(); + } + + /** + * This method is deprecated. + * Use getEntries() instead. + * + * @return + */ + @Deprecated + public List<T> getValues() { + return mEntries; + } + + /** + * Returns the array of entries that this DataSet represents. + * + * @return + */ + public List<T> getEntries() { + return mEntries; + } + + /** + * This method is deprecated. + * Use setEntries(...) instead. + * + * @param values + */ + @Deprecated + public void setValues(List<T> values) { + setEntries(values); + } + + /** + * Sets the array of entries that this DataSet represents, and calls notifyDataSetChanged() + * + * @return + */ + public void setEntries(List<T> entries) { + mEntries = entries; + notifyDataSetChanged(); + } + + /** + * Provides an exact copy of the DataSet this method is used on. + * + * @return + */ + public abstract DataSet<T> copy(); + + /** + * + * @param dataSet + */ + protected void copy(DataSet dataSet) { + super.copy(dataSet); + } + + @Override + public String toString() { + StringBuffer buffer = new StringBuffer(); + buffer.append(toSimpleString()); + for (int i = 0; i < mEntries.size(); i++) { + buffer.append(mEntries.get(i).toString() + " "); + } + return buffer.toString(); + } + + /** + * Returns a simple string representation of the DataSet with the type and + * the number of Entries. + * + * @return + */ + public String toSimpleString() { + StringBuffer buffer = new StringBuffer(); + buffer.append("DataSet, label: " + (getLabel() == null ? "" : getLabel()) + ", entries: " + mEntries.size() + + "\n"); + return buffer.toString(); + } + + @Override + public float getYMin() { + return mYMin; + } + + @Override + public float getYMax() { + return mYMax; + } + + @Override + public float getXMin() { + return mXMin; + } + + @Override + public float getXMax() { + return mXMax; + } + + @Override + public void addEntryOrdered(T e) { + + if (e == null) + return; + + if (mEntries == null) { + mEntries = new ArrayList<T>(); + } + + calcMinMax(e); + + if (mEntries.size() > 0 && mEntries.get(mEntries.size() - 1).getX() > e.getX()) { + int closestIndex = getEntryIndex(e.getX(), e.getY(), Rounding.UP); + mEntries.add(closestIndex, e); + } else { + mEntries.add(e); + } + } + + @Override + public void clear() { + mEntries.clear(); + notifyDataSetChanged(); + } + + @Override + public boolean addEntry(T e) { + + if (e == null) + return false; + + List<T> values = getEntries(); + if (values == null) { + values = new ArrayList<>(); + } + + calcMinMax(e); + + // add the entry + return values.add(e); + } + + @Override + public boolean removeEntry(T e) { + + if (e == null) + return false; + + if (mEntries == null) + return false; + + // remove the entry + boolean removed = mEntries.remove(e); + + if (removed) { + calcMinMax(); + } + + return removed; + } + + @Override + public int getEntryIndex(Entry e) { + return mEntries.indexOf(e); + } + + @Override + public T getEntryForXValue(float xValue, float closestToY, Rounding rounding) { + + int index = getEntryIndex(xValue, closestToY, rounding); + if (index > -1) + return mEntries.get(index); + return null; + } + + @Override + public T getEntryForXValue(float xValue, float closestToY) { + return getEntryForXValue(xValue, closestToY, Rounding.CLOSEST); + } + + @Override + public T getEntryForIndex(int index) { + return mEntries.get(index); + } + + @Override + public int getEntryIndex(float xValue, float closestToY, Rounding rounding) { + + if (mEntries == null || mEntries.isEmpty()) + return -1; + + int low = 0; + int high = mEntries.size() - 1; + int closest = high; + + while (low < high) { + int m = (low + high) / 2; + + final float d1 = mEntries.get(m).getX() - xValue, + d2 = mEntries.get(m + 1).getX() - xValue, + ad1 = Math.abs(d1), ad2 = Math.abs(d2); + + if (ad2 < ad1) { + // [m + 1] is closer to xValue + // Search in an higher place + low = m + 1; + } else if (ad1 < ad2) { + // [m] is closer to xValue + // Search in a lower place + high = m; + } else { + // We have multiple sequential x-value with same distance + + if (d1 >= 0.0) { + // Search in a lower place + high = m; + } else if (d1 < 0.0) { + // Search in an higher place + low = m + 1; + } + } + + closest = high; + } + + if (closest != -1) { + float closestXValue = mEntries.get(closest).getX(); + if (rounding == Rounding.UP) { + // If rounding up, and found x-value is lower than specified x, and we can go upper... + if (closestXValue < xValue && closest < mEntries.size() - 1) { + ++closest; + } + } else if (rounding == Rounding.DOWN) { + // If rounding down, and found x-value is upper than specified x, and we can go lower... + if (closestXValue > xValue && closest > 0) { + --closest; + } + } + + // Search by closest to y-value + if (!Float.isNaN(closestToY)) { + while (closest > 0 && mEntries.get(closest - 1).getX() == closestXValue) + closest -= 1; + + float closestYValue = mEntries.get(closest).getY(); + int closestYIndex = closest; + + while (true) { + closest += 1; + if (closest >= mEntries.size()) + break; + + final Entry value = mEntries.get(closest); + + if (value.getX() != closestXValue) + break; + + if (Math.abs(value.getY() - closestToY) <= Math.abs(closestYValue - closestToY)) { + closestYValue = closestToY; + closestYIndex = closest; + } + } + + closest = closestYIndex; + } + } + + return closest; + } + + @Override + public List<T> getEntriesForXValue(float xValue) { + + List<T> entries = new ArrayList<T>(); + + int low = 0; + int high = mEntries.size() - 1; + + while (low <= high) { + int m = (high + low) / 2; + T entry = mEntries.get(m); + + // if we have a match + if (xValue == entry.getX()) { + while (m > 0 && mEntries.get(m - 1).getX() == xValue) + m--; + + high = mEntries.size(); + + // loop over all "equal" entries + for (; m < high; m++) { + entry = mEntries.get(m); + if (entry.getX() == xValue) { + entries.add(entry); + } else { + break; + } + } + + break; + } else { + if (xValue > entry.getX()) + low = m + 1; + else + high = m - 1; + } + } + + return entries; + } + + /** + * Determines how to round DataSet index values for + * {@link DataSet#getEntryIndex(float, float, Rounding)} DataSet.getEntryIndex()} + * when an exact x-index is not found. + */ + public enum Rounding { + UP, + DOWN, + CLOSEST, + } +}
\ No newline at end of file diff --git a/MPChartLib/src/main/java/com/github/mikephil/charting/data/Entry.java b/MPChartLib/src/main/java/com/github/mikephil/charting/data/Entry.java new file mode 100644 index 00000000..b7a88799 --- /dev/null +++ b/MPChartLib/src/main/java/com/github/mikephil/charting/data/Entry.java @@ -0,0 +1,173 @@ + +package com.github.mikephil.charting.data; + +import android.graphics.drawable.Drawable; +import android.os.Parcel; +import android.os.ParcelFormatException; +import android.os.Parcelable; + +import com.github.mikephil.charting.utils.Utils; + +/** + * Class representing one entry in the chart. Might contain multiple values. + * Might only contain a single value depending on the used constructor. + * + * @author Philipp Jahoda + */ +public class Entry extends BaseEntry implements Parcelable { + + /** the x value */ + private float x = 0f; + + public Entry() { + + } + + /** + * A Entry represents one single entry in the chart. + * + * @param x the x value + * @param y the y value (the actual value of the entry) + */ + public Entry(float x, float y) { + super(y); + this.x = x; + } + + /** + * A Entry represents one single entry in the chart. + * + * @param x the x value + * @param y the y value (the actual value of the entry) + * @param data Spot for additional data this Entry represents. + */ + public Entry(float x, float y, Object data) { + super(y, data); + this.x = x; + } + + /** + * A Entry represents one single entry in the chart. + * + * @param x the x value + * @param y the y value (the actual value of the entry) + * @param icon icon image + */ + public Entry(float x, float y, Drawable icon) { + super(y, icon); + this.x = x; + } + + /** + * A Entry represents one single entry in the chart. + * + * @param x the x value + * @param y the y value (the actual value of the entry) + * @param icon icon image + * @param data Spot for additional data this Entry represents. + */ + public Entry(float x, float y, Drawable icon, Object data) { + super(y, icon, data); + this.x = x; + } + + /** + * Returns the x-value of this Entry object. + * + * @return + */ + public float getX() { + return x; + } + + /** + * Sets the x-value of this Entry object. + * + * @param x + */ + public void setX(float x) { + this.x = x; + } + + /** + * returns an exact copy of the entry + * + * @return + */ + public Entry copy() { + Entry e = new Entry(x, getY(), getData()); + return e; + } + + /** + * Compares value, xIndex and data of the entries. Returns true if entries + * are equal in those points, false if not. Does not check by hash-code like + * it's done by the "equals" method. + * + * @param e + * @return + */ + public boolean equalTo(Entry e) { + + if (e == null) + return false; + + if (e.getData() != this.getData()) + return false; + + if (Math.abs(e.x - this.x) > Utils.FLOAT_EPSILON) + return false; + + if (Math.abs(e.getY() - this.getY()) > Utils.FLOAT_EPSILON) + return false; + + return true; + } + + /** + * returns a string representation of the entry containing x-index and value + */ + @Override + public String toString() { + return "Entry, x: " + x + " y: " + getY(); + } + + @Override + public int describeContents() { + return 0; + } + + @Override + public void writeToParcel(Parcel dest, int flags) { + dest.writeFloat(this.x); + dest.writeFloat(this.getY()); + if (getData() != null) { + if (getData() instanceof Parcelable) { + dest.writeInt(1); + dest.writeParcelable((Parcelable) this.getData(), flags); + } else { + throw new ParcelFormatException("Cannot parcel an Entry with non-parcelable data"); + } + } else { + dest.writeInt(0); + } + } + + protected Entry(Parcel in) { + this.x = in.readFloat(); + this.setY(in.readFloat()); + if (in.readInt() == 1) { + this.setData(in.readParcelable(Object.class.getClassLoader())); + } + } + + public static final Parcelable.Creator<Entry> CREATOR = new Parcelable.Creator<Entry>() { + public Entry createFromParcel(Parcel source) { + return new Entry(source); + } + + public Entry[] newArray(int size) { + return new Entry[size]; + } + }; +} diff --git a/MPChartLib/src/main/java/com/github/mikephil/charting/data/LineData.java b/MPChartLib/src/main/java/com/github/mikephil/charting/data/LineData.java new file mode 100644 index 00000000..4cf54487 --- /dev/null +++ b/MPChartLib/src/main/java/com/github/mikephil/charting/data/LineData.java @@ -0,0 +1,27 @@ + +package com.github.mikephil.charting.data; + +import com.github.mikephil.charting.interfaces.datasets.ILineDataSet; + +import java.util.ArrayList; +import java.util.List; + +/** + * Data object that encapsulates all data associated with a LineChart. + * + * @author Philipp Jahoda + */ +public class LineData extends BarLineScatterCandleBubbleData<ILineDataSet> { + + public LineData() { + super(); + } + + public LineData(ILineDataSet... dataSets) { + super(dataSets); + } + + public LineData(List<ILineDataSet> dataSets) { + super(dataSets); + } +} diff --git a/MPChartLib/src/main/java/com/github/mikephil/charting/data/LineDataSet.java b/MPChartLib/src/main/java/com/github/mikephil/charting/data/LineDataSet.java new file mode 100644 index 00000000..10d1837e --- /dev/null +++ b/MPChartLib/src/main/java/com/github/mikephil/charting/data/LineDataSet.java @@ -0,0 +1,417 @@ + +package com.github.mikephil.charting.data; + +import android.content.Context; +import android.graphics.Color; +import android.graphics.DashPathEffect; +import android.util.Log; + +import com.github.mikephil.charting.formatter.DefaultFillFormatter; +import com.github.mikephil.charting.formatter.IFillFormatter; +import com.github.mikephil.charting.interfaces.datasets.ILineDataSet; +import com.github.mikephil.charting.utils.ColorTemplate; +import com.github.mikephil.charting.utils.Utils; + +import java.util.ArrayList; +import java.util.List; + +public class LineDataSet extends LineRadarDataSet<Entry> implements ILineDataSet { + + /** + * Drawing mode for this line dataset + **/ + private LineDataSet.Mode mMode = Mode.LINEAR; + + /** + * List representing all colors that are used for the circles + */ + private List<Integer> mCircleColors = null; + + /** + * the color of the inner circles + */ + private int mCircleHoleColor = Color.WHITE; + + /** + * the radius of the circle-shaped value indicators + */ + private float mCircleRadius = 8f; + + /** + * the hole radius of the circle-shaped value indicators + */ + private float mCircleHoleRadius = 4f; + + /** + * sets the intensity of the cubic lines + */ + private float mCubicIntensity = 0.2f; + + /** + * the path effect of this DataSet that makes dashed lines possible + */ + private DashPathEffect mDashPathEffect = null; + + /** + * formatter for customizing the position of the fill-line + */ + private IFillFormatter mFillFormatter = new DefaultFillFormatter(); + + /** + * if true, drawing circles is enabled + */ + private boolean mDrawCircles = true; + + private boolean mDrawCircleHole = true; + + + public LineDataSet(List<Entry> yVals, String label) { + super(yVals, label); + + // mCircleRadius = Utils.convertDpToPixel(4f); + // mLineWidth = Utils.convertDpToPixel(1f); + + if (mCircleColors == null) { + mCircleColors = new ArrayList<Integer>(); + } + mCircleColors.clear(); + + // default colors + // mColors.add(Color.rgb(192, 255, 140)); + // mColors.add(Color.rgb(255, 247, 140)); + mCircleColors.add(Color.rgb(140, 234, 255)); + } + + @Override + public DataSet<Entry> copy() { + List<Entry> entries = new ArrayList<Entry>(); + for (int i = 0; i < mEntries.size(); i++) { + entries.add(mEntries.get(i).copy()); + } + LineDataSet copied = new LineDataSet(entries, getLabel()); + copy(copied); + return copied; + } + + protected void copy(LineDataSet lineDataSet) { + super.copy(lineDataSet); + lineDataSet.mCircleColors = mCircleColors; + lineDataSet.mCircleHoleColor = mCircleHoleColor; + lineDataSet.mCircleHoleRadius = mCircleHoleRadius; + lineDataSet.mCircleRadius = mCircleRadius; + lineDataSet.mCubicIntensity = mCubicIntensity; + lineDataSet.mDashPathEffect = mDashPathEffect; + lineDataSet.mDrawCircleHole = mDrawCircleHole; + lineDataSet.mDrawCircles = mDrawCircleHole; + lineDataSet.mFillFormatter = mFillFormatter; + lineDataSet.mMode = mMode; + } + + /** + * Returns the drawing mode for this line dataset + * + * @return + */ + @Override + public LineDataSet.Mode getMode() { + return mMode; + } + + /** + * Returns the drawing mode for this LineDataSet + * + * @return + */ + public void setMode(LineDataSet.Mode mode) { + mMode = mode; + } + + /** + * Sets the intensity for cubic lines (if enabled). Max = 1f = very cubic, + * Min = 0.05f = low cubic effect, Default: 0.2f + * + * @param intensity + */ + public void setCubicIntensity(float intensity) { + + if (intensity > 1f) + intensity = 1f; + if (intensity < 0.05f) + intensity = 0.05f; + + mCubicIntensity = intensity; + } + + @Override + public float getCubicIntensity() { + return mCubicIntensity; + } + + + /** + * Sets the radius of the drawn circles. + * Default radius = 4f, Min = 1f + * + * @param radius + */ + public void setCircleRadius(float radius) { + + if (radius >= 1f) { + mCircleRadius = Utils.convertDpToPixel(radius); + } else { + Log.e("LineDataSet", "Circle radius cannot be < 1"); + } + } + + @Override + public float getCircleRadius() { + return mCircleRadius; + } + + /** + * Sets the hole radius of the drawn circles. + * Default radius = 2f, Min = 0.5f + * + * @param holeRadius + */ + public void setCircleHoleRadius(float holeRadius) { + + if (holeRadius >= 0.5f) { + mCircleHoleRadius = Utils.convertDpToPixel(holeRadius); + } else { + Log.e("LineDataSet", "Circle radius cannot be < 0.5"); + } + } + + @Override + public float getCircleHoleRadius() { + return mCircleHoleRadius; + } + + /** + * sets the size (radius) of the circle shpaed value indicators, + * default size = 4f + * <p/> + * This method is deprecated because of unclarity. Use setCircleRadius instead. + * + * @param size + */ + @Deprecated + public void setCircleSize(float size) { + setCircleRadius(size); + } + + /** + * This function is deprecated because of unclarity. Use getCircleRadius instead. + */ + @Deprecated + public float getCircleSize() { + return getCircleRadius(); + } + + /** + * Enables the line to be drawn in dashed mode, e.g. like this + * "- - - - - -". THIS ONLY WORKS IF HARDWARE-ACCELERATION IS TURNED OFF. + * Keep in mind that hardware acceleration boosts performance. + * + * @param lineLength the length of the line pieces + * @param spaceLength the length of space in between the pieces + * @param phase offset, in degrees (normally, use 0) + */ + public void enableDashedLine(float lineLength, float spaceLength, float phase) { + mDashPathEffect = new DashPathEffect(new float[]{ + lineLength, spaceLength + }, phase); + } + + /** + * Disables the line to be drawn in dashed mode. + */ + public void disableDashedLine() { + mDashPathEffect = null; + } + + @Override + public boolean isDashedLineEnabled() { + return mDashPathEffect == null ? false : true; + } + + @Override + public DashPathEffect getDashPathEffect() { + return mDashPathEffect; + } + + /** + * set this to true to enable the drawing of circle indicators for this + * DataSet, default true + * + * @param enabled + */ + public void setDrawCircles(boolean enabled) { + this.mDrawCircles = enabled; + } + + @Override + public boolean isDrawCirclesEnabled() { + return mDrawCircles; + } + + @Deprecated + @Override + public boolean isDrawCubicEnabled() { + return mMode == Mode.CUBIC_BEZIER; + } + + @Deprecated + @Override + public boolean isDrawSteppedEnabled() { + return mMode == Mode.STEPPED; + } + + /** ALL CODE BELOW RELATED TO CIRCLE-COLORS */ + + /** + * returns all colors specified for the circles + * + * @return + */ + public List<Integer> getCircleColors() { + return mCircleColors; + } + + @Override + public int getCircleColor(int index) { + return mCircleColors.get(index); + } + + @Override + public int getCircleColorCount() { + return mCircleColors.size(); + } + + /** + * Sets the colors that should be used for the circles of this DataSet. + * Colors are reused as soon as the number of Entries the DataSet represents + * is higher than the size of the colors array. Make sure that the colors + * are already prepared (by calling getResources().getColor(...)) before + * adding them to the DataSet. + * + * @param colors + */ + public void setCircleColors(List<Integer> colors) { + mCircleColors = colors; + } + + /** + * Sets the colors that should be used for the circles of this DataSet. + * Colors are reused as soon as the number of Entries the DataSet represents + * is higher than the size of the colors array. Make sure that the colors + * are already prepared (by calling getResources().getColor(...)) before + * adding them to the DataSet. + * + * @param colors + */ + public void setCircleColors(int... colors) { + this.mCircleColors = ColorTemplate.createColors(colors); + } + + /** + * ets the colors that should be used for the circles of this DataSet. + * Colors are reused as soon as the number of Entries the DataSet represents + * is higher than the size of the colors array. You can use + * "new String[] { R.color.red, R.color.green, ... }" to provide colors for + * this method. Internally, the colors are resolved using + * getResources().getColor(...) + * + * @param colors + */ + public void setCircleColors(int[] colors, Context c) { + + List<Integer> clrs = mCircleColors; + if (clrs == null) { + clrs = new ArrayList<>(); + } + clrs.clear(); + + for (int color : colors) { + clrs.add(c.getResources().getColor(color)); + } + + mCircleColors = clrs; + } + + /** + * Sets the one and ONLY color that should be used for this DataSet. + * Internally, this recreates the colors array and adds the specified color. + * + * @param color + */ + public void setCircleColor(int color) { + resetCircleColors(); + mCircleColors.add(color); + } + + /** + * resets the circle-colors array and creates a new one + */ + public void resetCircleColors() { + if (mCircleColors == null) { + mCircleColors = new ArrayList<Integer>(); + } + mCircleColors.clear(); + } + + /** + * Sets the color of the inner circle of the line-circles. + * + * @param color + */ + public void setCircleHoleColor(int color) { + mCircleHoleColor = color; + } + + @Override + public int getCircleHoleColor() { + return mCircleHoleColor; + } + + /** + * Set this to true to allow drawing a hole in each data circle. + * + * @param enabled + */ + public void setDrawCircleHole(boolean enabled) { + mDrawCircleHole = enabled; + } + + @Override + public boolean isDrawCircleHoleEnabled() { + return mDrawCircleHole; + } + + /** + * Sets a custom IFillFormatter to the chart that handles the position of the + * filled-line for each DataSet. Set this to null to use the default logic. + * + * @param formatter + */ + public void setFillFormatter(IFillFormatter formatter) { + + if (formatter == null) + mFillFormatter = new DefaultFillFormatter(); + else + mFillFormatter = formatter; + } + + @Override + public IFillFormatter getFillFormatter() { + return mFillFormatter; + } + + public enum Mode { + LINEAR, + STEPPED, + CUBIC_BEZIER, + HORIZONTAL_BEZIER + } +} diff --git a/MPChartLib/src/main/java/com/github/mikephil/charting/data/LineRadarDataSet.java b/MPChartLib/src/main/java/com/github/mikephil/charting/data/LineRadarDataSet.java new file mode 100644 index 00000000..b4347e46 --- /dev/null +++ b/MPChartLib/src/main/java/com/github/mikephil/charting/data/LineRadarDataSet.java @@ -0,0 +1,135 @@ + +package com.github.mikephil.charting.data; + +import android.annotation.TargetApi; +import android.graphics.Color; +import android.graphics.drawable.Drawable; + +import com.github.mikephil.charting.interfaces.datasets.ILineRadarDataSet; +import com.github.mikephil.charting.utils.Utils; + +import java.util.List; + +/** + * Base dataset for line and radar DataSets. + * + * @author Philipp Jahoda + */ +public abstract class LineRadarDataSet<T extends Entry> extends LineScatterCandleRadarDataSet<T> implements ILineRadarDataSet<T> { + + // TODO: Move to using `Fill` class + /** + * the color that is used for filling the line surface + */ + private int mFillColor = Color.rgb(140, 234, 255); + + /** + * the drawable to be used for filling the line surface + */ + protected Drawable mFillDrawable; + + /** + * transparency used for filling line surface + */ + private int mFillAlpha = 85; + + /** + * the width of the drawn data lines + */ + private float mLineWidth = 2.5f; + + /** + * if true, the data will also be drawn filled + */ + private boolean mDrawFilled = false; + + + public LineRadarDataSet(List<T> yVals, String label) { + super(yVals, label); + } + + @Override + public int getFillColor() { + return mFillColor; + } + + /** + * Sets the color that is used for filling the area below the line. + * Resets an eventually set "fillDrawable". + * + * @param color + */ + public void setFillColor(int color) { + mFillColor = color; + mFillDrawable = null; + } + + @Override + public Drawable getFillDrawable() { + return mFillDrawable; + } + + /** + * Sets the drawable to be used to fill the area below the line. + * + * @param drawable + */ + @TargetApi(18) + public void setFillDrawable(Drawable drawable) { + this.mFillDrawable = drawable; + } + + @Override + public int getFillAlpha() { + return mFillAlpha; + } + + /** + * sets the alpha value (transparency) that is used for filling the line + * surface (0-255), default: 85 + * + * @param alpha + */ + public void setFillAlpha(int alpha) { + mFillAlpha = alpha; + } + + /** + * set the line width of the chart (min = 0.2f, max = 10f); default 1f NOTE: + * thinner line == better performance, thicker line == worse performance + * + * @param width + */ + public void setLineWidth(float width) { + + if (width < 0.0f) + width = 0.0f; + if (width > 10.0f) + width = 10.0f; + mLineWidth = Utils.convertDpToPixel(width); + } + + @Override + public float getLineWidth() { + return mLineWidth; + } + + @Override + public void setDrawFilled(boolean filled) { + mDrawFilled = filled; + } + + @Override + public boolean isDrawFilledEnabled() { + return mDrawFilled; + } + + protected void copy(LineRadarDataSet lineRadarDataSet) { + super.copy(lineRadarDataSet); + lineRadarDataSet.mDrawFilled = mDrawFilled; + lineRadarDataSet.mFillAlpha = mFillAlpha; + lineRadarDataSet.mFillColor = mFillColor; + lineRadarDataSet.mFillDrawable = mFillDrawable; + lineRadarDataSet.mLineWidth = mLineWidth; + } +} diff --git a/MPChartLib/src/main/java/com/github/mikephil/charting/data/LineScatterCandleRadarDataSet.java b/MPChartLib/src/main/java/com/github/mikephil/charting/data/LineScatterCandleRadarDataSet.java new file mode 100644 index 00000000..d4618d80 --- /dev/null +++ b/MPChartLib/src/main/java/com/github/mikephil/charting/data/LineScatterCandleRadarDataSet.java @@ -0,0 +1,120 @@ +package com.github.mikephil.charting.data; + +import android.graphics.DashPathEffect; + +import com.github.mikephil.charting.interfaces.datasets.ILineScatterCandleRadarDataSet; +import com.github.mikephil.charting.utils.Utils; + +import java.util.List; + +/** + * Created by Philipp Jahoda on 11/07/15. + */ +public abstract class LineScatterCandleRadarDataSet<T extends Entry> extends BarLineScatterCandleBubbleDataSet<T> implements ILineScatterCandleRadarDataSet<T> { + + protected boolean mDrawVerticalHighlightIndicator = true; + protected boolean mDrawHorizontalHighlightIndicator = true; + + /** the width of the highlight indicator lines */ + protected float mHighlightLineWidth = 0.5f; + + /** the path effect for dashed highlight-lines */ + protected DashPathEffect mHighlightDashPathEffect = null; + + + public LineScatterCandleRadarDataSet(List<T> yVals, String label) { + super(yVals, label); + mHighlightLineWidth = Utils.convertDpToPixel(0.5f); + } + + /** + * Enables / disables the horizontal highlight-indicator. If disabled, the indicator is not drawn. + * @param enabled + */ + public void setDrawHorizontalHighlightIndicator(boolean enabled) { + this.mDrawHorizontalHighlightIndicator = enabled; + } + + /** + * Enables / disables the vertical highlight-indicator. If disabled, the indicator is not drawn. + * @param enabled + */ + public void setDrawVerticalHighlightIndicator(boolean enabled) { + this.mDrawVerticalHighlightIndicator = enabled; + } + + /** + * Enables / disables both vertical and horizontal highlight-indicators. + * @param enabled + */ + public void setDrawHighlightIndicators(boolean enabled) { + setDrawVerticalHighlightIndicator(enabled); + setDrawHorizontalHighlightIndicator(enabled); + } + + @Override + public boolean isVerticalHighlightIndicatorEnabled() { + return mDrawVerticalHighlightIndicator; + } + + @Override + public boolean isHorizontalHighlightIndicatorEnabled() { + return mDrawHorizontalHighlightIndicator; + } + + /** + * Sets the width of the highlight line in dp. + * @param width + */ + public void setHighlightLineWidth(float width) { + mHighlightLineWidth = Utils.convertDpToPixel(width); + } + + @Override + public float getHighlightLineWidth() { + return mHighlightLineWidth; + } + + /** + * Enables the highlight-line to be drawn in dashed mode, e.g. like this "- - - - - -" + * + * @param lineLength the length of the line pieces + * @param spaceLength the length of space inbetween the line-pieces + * @param phase offset, in degrees (normally, use 0) + */ + public void enableDashedHighlightLine(float lineLength, float spaceLength, float phase) { + mHighlightDashPathEffect = new DashPathEffect(new float[] { + lineLength, spaceLength + }, phase); + } + + /** + * Disables the highlight-line to be drawn in dashed mode. + */ + public void disableDashedHighlightLine() { + mHighlightDashPathEffect = null; + } + + /** + * Returns true if the dashed-line effect is enabled for highlight lines, false if not. + * Default: disabled + * + * @return + */ + public boolean isDashedHighlightLineEnabled() { + return mHighlightDashPathEffect == null ? false : true; + } + + @Override + public DashPathEffect getDashPathEffectHighlight() { + return mHighlightDashPathEffect; + } + + protected void copy(LineScatterCandleRadarDataSet lineScatterCandleRadarDataSet) { + super.copy(lineScatterCandleRadarDataSet); + lineScatterCandleRadarDataSet.mDrawHorizontalHighlightIndicator = mDrawHorizontalHighlightIndicator; + lineScatterCandleRadarDataSet.mDrawVerticalHighlightIndicator = mDrawVerticalHighlightIndicator; + lineScatterCandleRadarDataSet.mHighlightLineWidth = mHighlightLineWidth; + lineScatterCandleRadarDataSet.mHighlightDashPathEffect = mHighlightDashPathEffect; + } +} diff --git a/MPChartLib/src/main/java/com/github/mikephil/charting/data/PieData.java b/MPChartLib/src/main/java/com/github/mikephil/charting/data/PieData.java new file mode 100644 index 00000000..423ce19b --- /dev/null +++ b/MPChartLib/src/main/java/com/github/mikephil/charting/data/PieData.java @@ -0,0 +1,100 @@ + +package com.github.mikephil.charting.data; + +import android.util.Log; + +import com.github.mikephil.charting.highlight.Highlight; +import com.github.mikephil.charting.interfaces.datasets.IPieDataSet; + +import java.util.ArrayList; +import java.util.List; + +/** + * A PieData object can only represent one DataSet. Unlike all other charts, the + * legend labels of the PieChart are created from the x-values array, and not + * from the DataSet labels. Each PieData object can only represent one + * PieDataSet (multiple PieDataSets inside a single PieChart are not possible). + * + * @author Philipp Jahoda + */ +public class PieData extends ChartData<IPieDataSet> { + + public PieData() { + super(); + } + + public PieData(IPieDataSet dataSet) { + super(dataSet); + } + + /** + * Sets the PieDataSet this data object should represent. + * + * @param dataSet + */ + public void setDataSet(IPieDataSet dataSet) { + mDataSets.clear(); + mDataSets.add(dataSet); + notifyDataChanged(); + } + + /** + * Returns the DataSet this PieData object represents. A PieData object can + * only contain one DataSet. + * + * @return + */ + public IPieDataSet getDataSet() { + return mDataSets.get(0); + } + + @Override + public List<IPieDataSet> getDataSets() { + List<IPieDataSet> dataSets = super.getDataSets(); + + if (dataSets.size() < 1) { + Log.e("MPAndroidChart", + "Found multiple data sets while pie chart only allows one"); + } + + return dataSets; + } + + /** + * The PieData object can only have one DataSet. Use getDataSet() method instead. + * + * @param index + * @return + */ + @Override + public IPieDataSet getDataSetByIndex(int index) { + return index == 0 ? getDataSet() : null; + } + + @Override + public IPieDataSet getDataSetByLabel(String label, boolean ignorecase) { + return ignorecase ? label.equalsIgnoreCase(mDataSets.get(0).getLabel()) ? mDataSets.get(0) + : null : label.equals(mDataSets.get(0).getLabel()) ? mDataSets.get(0) : null; + } + + @Override + public Entry getEntryForHighlight(Highlight highlight) { + return getDataSet().getEntryForIndex((int) highlight.getX()); + } + + /** + * Returns the sum of all values in this PieData object. + * + * @return + */ + public float getYValueSum() { + + float sum = 0; + + for (int i = 0; i < getDataSet().getEntryCount(); i++) + sum += getDataSet().getEntryForIndex(i).getY(); + + + return sum; + } +} diff --git a/MPChartLib/src/main/java/com/github/mikephil/charting/data/PieDataSet.java b/MPChartLib/src/main/java/com/github/mikephil/charting/data/PieDataSet.java new file mode 100644 index 00000000..c83b2454 --- /dev/null +++ b/MPChartLib/src/main/java/com/github/mikephil/charting/data/PieDataSet.java @@ -0,0 +1,261 @@ + +package com.github.mikephil.charting.data; + +import com.github.mikephil.charting.interfaces.datasets.IPieDataSet; +import com.github.mikephil.charting.utils.Utils; +import androidx.annotation.Nullable; + +import java.util.ArrayList; +import java.util.List; + +public class PieDataSet extends DataSet<PieEntry> implements IPieDataSet { + + /** + * the space in pixels between the chart-slices, default 0f + */ + private float mSliceSpace = 0f; + private boolean mAutomaticallyDisableSliceSpacing; + + /** + * indicates the selection distance of a pie slice + */ + private float mShift = 18f; + + private ValuePosition mXValuePosition = ValuePosition.INSIDE_SLICE; + private ValuePosition mYValuePosition = ValuePosition.INSIDE_SLICE; + private int mValueLineColor = 0xff000000; + private boolean mUseValueColorForLine = false; + private float mValueLineWidth = 1.0f; + private float mValueLinePart1OffsetPercentage = 75.f; + private float mValueLinePart1Length = 0.3f; + private float mValueLinePart2Length = 0.4f; + private boolean mValueLineVariableLength = true; + private Integer mHighlightColor = null; + + public PieDataSet(List<PieEntry> yVals, String label) { + super(yVals, label); +// mShift = Utils.convertDpToPixel(12f); + } + + @Override + public DataSet<PieEntry> copy() { + List<PieEntry> entries = new ArrayList<>(); + for (int i = 0; i < mEntries.size(); i++) { + entries.add(mEntries.get(i).copy()); + } + PieDataSet copied = new PieDataSet(entries, getLabel()); + copy(copied); + return copied; + } + + protected void copy(PieDataSet pieDataSet) { + super.copy(pieDataSet); + } + + @Override + protected void calcMinMax(PieEntry e) { + + if (e == null) + return; + + calcMinMaxY(e); + } + + /** + * Sets the space that is left out between the piechart-slices in dp. + * Default: 0 --> no space, maximum 20f + * + * @param spaceDp + */ + public void setSliceSpace(float spaceDp) { + + if (spaceDp > 20) + spaceDp = 20f; + if (spaceDp < 0) + spaceDp = 0f; + + mSliceSpace = Utils.convertDpToPixel(spaceDp); + } + + @Override + public float getSliceSpace() { + return mSliceSpace; + } + + /** + * When enabled, slice spacing will be 0.0 when the smallest value is going to be + * smaller than the slice spacing itself. + * + * @param autoDisable + */ + public void setAutomaticallyDisableSliceSpacing(boolean autoDisable) { + mAutomaticallyDisableSliceSpacing = autoDisable; + } + + /** + * When enabled, slice spacing will be 0.0 when the smallest value is going to be + * smaller than the slice spacing itself. + * + * @return + */ + @Override + public boolean isAutomaticallyDisableSliceSpacingEnabled() { + return mAutomaticallyDisableSliceSpacing; + } + + /** + * sets the distance the highlighted piechart-slice of this DataSet is + * "shifted" away from the center of the chart, default 12f + * + * @param shift + */ + public void setSelectionShift(float shift) { + mShift = Utils.convertDpToPixel(shift); + } + + @Override + public float getSelectionShift() { + return mShift; + } + + @Override + public ValuePosition getXValuePosition() { + return mXValuePosition; + } + + public void setXValuePosition(ValuePosition xValuePosition) { + this.mXValuePosition = xValuePosition; + } + + @Override + public ValuePosition getYValuePosition() { + return mYValuePosition; + } + + public void setYValuePosition(ValuePosition yValuePosition) { + this.mYValuePosition = yValuePosition; + } + + /** + * This method is deprecated. + * Use isUseValueColorForLineEnabled() instead. + */ + @Deprecated + public boolean isUsingSliceColorAsValueLineColor() { + return isUseValueColorForLineEnabled(); + } + + /** + * This method is deprecated. + * Use setUseValueColorForLine(...) instead. + * + * @param enabled + */ + @Deprecated + public void setUsingSliceColorAsValueLineColor(boolean enabled) { + setUseValueColorForLine(enabled); + } + + /** + * When valuePosition is OutsideSlice, indicates line color + */ + @Override + public int getValueLineColor() { + return mValueLineColor; + } + + public void setValueLineColor(int valueLineColor) { + this.mValueLineColor = valueLineColor; + } + + @Override + public boolean isUseValueColorForLineEnabled() + { + return mUseValueColorForLine; + } + + public void setUseValueColorForLine(boolean enabled) + { + mUseValueColorForLine = enabled; + } + + /** + * When valuePosition is OutsideSlice, indicates line width + */ + @Override + public float getValueLineWidth() { + return mValueLineWidth; + } + + public void setValueLineWidth(float valueLineWidth) { + this.mValueLineWidth = valueLineWidth; + } + + /** + * When valuePosition is OutsideSlice, indicates offset as percentage out of the slice size + */ + @Override + public float getValueLinePart1OffsetPercentage() { + return mValueLinePart1OffsetPercentage; + } + + public void setValueLinePart1OffsetPercentage(float valueLinePart1OffsetPercentage) { + this.mValueLinePart1OffsetPercentage = valueLinePart1OffsetPercentage; + } + + /** + * When valuePosition is OutsideSlice, indicates length of first half of the line + */ + @Override + public float getValueLinePart1Length() { + return mValueLinePart1Length; + } + + public void setValueLinePart1Length(float valueLinePart1Length) { + this.mValueLinePart1Length = valueLinePart1Length; + } + + /** + * When valuePosition is OutsideSlice, indicates length of second half of the line + */ + @Override + public float getValueLinePart2Length() { + return mValueLinePart2Length; + } + + public void setValueLinePart2Length(float valueLinePart2Length) { + this.mValueLinePart2Length = valueLinePart2Length; + } + + /** + * When valuePosition is OutsideSlice, this allows variable line length + */ + @Override + public boolean isValueLineVariableLength() { + return mValueLineVariableLength; + } + + public void setValueLineVariableLength(boolean valueLineVariableLength) { + this.mValueLineVariableLength = valueLineVariableLength; + } + + /** Gets the color for the highlighted sector */ + @Override + @Nullable + public Integer getHighlightColor() + { + return mHighlightColor; + } + + /** Sets the color for the highlighted sector (null for using entry color) */ + public void setHighlightColor(@Nullable Integer color) + { + this.mHighlightColor = color; + } + + + public enum ValuePosition { + INSIDE_SLICE, + OUTSIDE_SLICE + } +} diff --git a/MPChartLib/src/main/java/com/github/mikephil/charting/data/PieEntry.java b/MPChartLib/src/main/java/com/github/mikephil/charting/data/PieEntry.java new file mode 100644 index 00000000..65741ef1 --- /dev/null +++ b/MPChartLib/src/main/java/com/github/mikephil/charting/data/PieEntry.java @@ -0,0 +1,86 @@ +package com.github.mikephil.charting.data; + +import android.annotation.SuppressLint; +import android.graphics.drawable.Drawable; +import android.util.Log; + +/** + * @author Philipp Jahoda + */ +@SuppressLint("ParcelCreator") +public class PieEntry extends Entry { + + private String label; + + public PieEntry(float value) { + super(0f, value); + } + + public PieEntry(float value, Object data) { + super(0f, value, data); + } + + public PieEntry(float value, Drawable icon) { + super(0f, value, icon); + } + + public PieEntry(float value, Drawable icon, Object data) { + super(0f, value, icon, data); + } + + public PieEntry(float value, String label) { + super(0f, value); + this.label = label; + } + + public PieEntry(float value, String label, Object data) { + super(0f, value, data); + this.label = label; + } + + public PieEntry(float value, String label, Drawable icon) { + super(0f, value, icon); + this.label = label; + } + + public PieEntry(float value, String label, Drawable icon, Object data) { + super(0f, value, icon, data); + this.label = label; + } + + /** + * This is the same as getY(). Returns the value of the PieEntry. + * + * @return + */ + public float getValue() { + return getY(); + } + + public String getLabel() { + return label; + } + + public void setLabel(String label) { + this.label = label; + } + + @Deprecated + @Override + public void setX(float x) { + super.setX(x); + Log.i("DEPRECATED", "Pie entries do not have x values"); + } + + @Deprecated + @Override + public float getX() { + Log.i("DEPRECATED", "Pie entries do not have x values"); + return super.getX(); + } + + public PieEntry copy() { + PieEntry e = new PieEntry(getY(), label, getData()); + return e; + } +} diff --git a/MPChartLib/src/main/java/com/github/mikephil/charting/data/RadarData.java b/MPChartLib/src/main/java/com/github/mikephil/charting/data/RadarData.java new file mode 100644 index 00000000..0c1dbe55 --- /dev/null +++ b/MPChartLib/src/main/java/com/github/mikephil/charting/data/RadarData.java @@ -0,0 +1,58 @@ + +package com.github.mikephil.charting.data; + +import com.github.mikephil.charting.highlight.Highlight; +import com.github.mikephil.charting.interfaces.datasets.IRadarDataSet; + +import java.util.ArrayList; +import java.util.Arrays; +import java.util.List; + +/** + * Data container for the RadarChart. + * + * @author Philipp Jahoda + */ +public class RadarData extends ChartData<IRadarDataSet> { + + private List<String> mLabels; + + public RadarData() { + super(); + } + + public RadarData(List<IRadarDataSet> dataSets) { + super(dataSets); + } + + public RadarData(IRadarDataSet... dataSets) { + super(dataSets); + } + + /** + * Sets the labels that should be drawn around the RadarChart at the end of each web line. + * + * @param labels + */ + public void setLabels(List<String> labels) { + this.mLabels = labels; + } + + /** + * Sets the labels that should be drawn around the RadarChart at the end of each web line. + * + * @param labels + */ + public void setLabels(String... labels) { + this.mLabels = Arrays.asList(labels); + } + + public List<String> getLabels() { + return mLabels; + } + + @Override + public Entry getEntryForHighlight(Highlight highlight) { + return getDataSetByIndex(highlight.getDataSetIndex()).getEntryForIndex((int) highlight.getX()); + } +} diff --git a/MPChartLib/src/main/java/com/github/mikephil/charting/data/RadarDataSet.java b/MPChartLib/src/main/java/com/github/mikephil/charting/data/RadarDataSet.java new file mode 100644 index 00000000..8a9740b6 --- /dev/null +++ b/MPChartLib/src/main/java/com/github/mikephil/charting/data/RadarDataSet.java @@ -0,0 +1,122 @@ + +package com.github.mikephil.charting.data; + +import android.graphics.Color; + +import com.github.mikephil.charting.interfaces.datasets.IRadarDataSet; +import com.github.mikephil.charting.utils.ColorTemplate; + +import java.util.ArrayList; +import java.util.List; + +public class RadarDataSet extends LineRadarDataSet<RadarEntry> implements IRadarDataSet { + + /// flag indicating whether highlight circle should be drawn or not + protected boolean mDrawHighlightCircleEnabled = false; + + protected int mHighlightCircleFillColor = Color.WHITE; + + /// The stroke color for highlight circle. + /// If Utils.COLOR_NONE, the color of the dataset is taken. + protected int mHighlightCircleStrokeColor = ColorTemplate.COLOR_NONE; + + protected int mHighlightCircleStrokeAlpha = (int) (0.3 * 255); + protected float mHighlightCircleInnerRadius = 3.0f; + protected float mHighlightCircleOuterRadius = 4.0f; + protected float mHighlightCircleStrokeWidth = 2.0f; + + public RadarDataSet(List<RadarEntry> yVals, String label) { + super(yVals, label); + } + + /// Returns true if highlight circle should be drawn, false if not + @Override + public boolean isDrawHighlightCircleEnabled() { + return mDrawHighlightCircleEnabled; + } + + /// Sets whether highlight circle should be drawn or not + @Override + public void setDrawHighlightCircleEnabled(boolean enabled) { + mDrawHighlightCircleEnabled = enabled; + } + + @Override + public int getHighlightCircleFillColor() { + return mHighlightCircleFillColor; + } + + public void setHighlightCircleFillColor(int color) { + mHighlightCircleFillColor = color; + } + + /// Returns the stroke color for highlight circle. + /// If Utils.COLOR_NONE, the color of the dataset is taken. + @Override + public int getHighlightCircleStrokeColor() { + return mHighlightCircleStrokeColor; + } + + /// Sets the stroke color for highlight circle. + /// Set to Utils.COLOR_NONE in order to use the color of the dataset; + public void setHighlightCircleStrokeColor(int color) { + mHighlightCircleStrokeColor = color; + } + + @Override + public int getHighlightCircleStrokeAlpha() { + return mHighlightCircleStrokeAlpha; + } + + public void setHighlightCircleStrokeAlpha(int alpha) { + mHighlightCircleStrokeAlpha = alpha; + } + + @Override + public float getHighlightCircleInnerRadius() { + return mHighlightCircleInnerRadius; + } + + public void setHighlightCircleInnerRadius(float radius) { + mHighlightCircleInnerRadius = radius; + } + + @Override + public float getHighlightCircleOuterRadius() { + return mHighlightCircleOuterRadius; + } + + public void setHighlightCircleOuterRadius(float radius) { + mHighlightCircleOuterRadius = radius; + } + + @Override + public float getHighlightCircleStrokeWidth() { + return mHighlightCircleStrokeWidth; + } + + public void setHighlightCircleStrokeWidth(float strokeWidth) { + mHighlightCircleStrokeWidth = strokeWidth; + } + + @Override + public DataSet<RadarEntry> copy() { + List<RadarEntry> entries = new ArrayList<RadarEntry>(); + for (int i = 0; i < mEntries.size(); i++) { + entries.add(mEntries.get(i).copy()); + } + RadarDataSet copied = new RadarDataSet(entries, getLabel()); + copy(copied); + return copied; + } + + protected void copy(RadarDataSet radarDataSet) { + super.copy(radarDataSet); + radarDataSet.mDrawHighlightCircleEnabled = mDrawHighlightCircleEnabled; + radarDataSet.mHighlightCircleFillColor = mHighlightCircleFillColor; + radarDataSet.mHighlightCircleInnerRadius = mHighlightCircleInnerRadius; + radarDataSet.mHighlightCircleStrokeAlpha = mHighlightCircleStrokeAlpha; + radarDataSet.mHighlightCircleStrokeColor = mHighlightCircleStrokeColor; + radarDataSet.mHighlightCircleStrokeWidth = mHighlightCircleStrokeWidth; + } +} diff --git a/MPChartLib/src/main/java/com/github/mikephil/charting/data/RadarEntry.java b/MPChartLib/src/main/java/com/github/mikephil/charting/data/RadarEntry.java new file mode 100644 index 00000000..02fdce7d --- /dev/null +++ b/MPChartLib/src/main/java/com/github/mikephil/charting/data/RadarEntry.java @@ -0,0 +1,44 @@ +package com.github.mikephil.charting.data; + +import android.annotation.SuppressLint; + +/** + * Created by philipp on 13/06/16. + */ +@SuppressLint("ParcelCreator") +public class RadarEntry extends Entry { + + public RadarEntry(float value) { + super(0f, value); + } + + public RadarEntry(float value, Object data) { + super(0f, value, data); + } + + /** + * This is the same as getY(). Returns the value of the RadarEntry. + * + * @return + */ + public float getValue() { + return getY(); + } + + public RadarEntry copy() { + RadarEntry e = new RadarEntry(getY(), getData()); + return e; + } + + @Deprecated + @Override + public void setX(float x) { + super.setX(x); + } + + @Deprecated + @Override + public float getX() { + return super.getX(); + } +} diff --git a/MPChartLib/src/main/java/com/github/mikephil/charting/data/ScatterData.java b/MPChartLib/src/main/java/com/github/mikephil/charting/data/ScatterData.java new file mode 100644 index 00000000..ba142360 --- /dev/null +++ b/MPChartLib/src/main/java/com/github/mikephil/charting/data/ScatterData.java @@ -0,0 +1,40 @@ + +package com.github.mikephil.charting.data; + +import com.github.mikephil.charting.interfaces.datasets.IScatterDataSet; + +import java.util.List; + +public class ScatterData extends BarLineScatterCandleBubbleData<IScatterDataSet> { + + public ScatterData() { + super(); + } + + public ScatterData(List<IScatterDataSet> dataSets) { + super(dataSets); + } + + public ScatterData(IScatterDataSet... dataSets) { + super(dataSets); + } + + /** + * Returns the maximum shape-size across all DataSets. + * + * @return + */ + public float getGreatestShapeSize() { + + float max = 0f; + + for (IScatterDataSet set : mDataSets) { + float size = set.getScatterShapeSize(); + + if (size > max) + max = size; + } + + return max; + } +} diff --git a/MPChartLib/src/main/java/com/github/mikephil/charting/data/ScatterDataSet.java b/MPChartLib/src/main/java/com/github/mikephil/charting/data/ScatterDataSet.java new file mode 100644 index 00000000..85ed8081 --- /dev/null +++ b/MPChartLib/src/main/java/com/github/mikephil/charting/data/ScatterDataSet.java @@ -0,0 +1,157 @@ + +package com.github.mikephil.charting.data; + +import com.github.mikephil.charting.charts.ScatterChart; +import com.github.mikephil.charting.interfaces.datasets.IScatterDataSet; +import com.github.mikephil.charting.renderer.scatter.ChevronDownShapeRenderer; +import com.github.mikephil.charting.renderer.scatter.ChevronUpShapeRenderer; +import com.github.mikephil.charting.renderer.scatter.CircleShapeRenderer; +import com.github.mikephil.charting.renderer.scatter.CrossShapeRenderer; +import com.github.mikephil.charting.renderer.scatter.IShapeRenderer; +import com.github.mikephil.charting.renderer.scatter.SquareShapeRenderer; +import com.github.mikephil.charting.renderer.scatter.TriangleShapeRenderer; +import com.github.mikephil.charting.renderer.scatter.XShapeRenderer; +import com.github.mikephil.charting.utils.ColorTemplate; + +import java.util.ArrayList; +import java.util.List; + +public class ScatterDataSet extends LineScatterCandleRadarDataSet<Entry> implements IScatterDataSet { + + /** + * the size the scattershape will have, in density pixels + */ + private float mShapeSize = 15f; + + /** + * Renderer responsible for rendering this DataSet, default: square + */ + protected IShapeRenderer mShapeRenderer = new SquareShapeRenderer(); + + /** + * The radius of the hole in the shape (applies to Square, Circle and Triangle) + * - default: 0.0 + */ + private float mScatterShapeHoleRadius = 0f; + + /** + * Color for the hole in the shape. + * Setting to `ColorTemplate.COLOR_NONE` will behave as transparent. + * - default: ColorTemplate.COLOR_NONE + */ + private int mScatterShapeHoleColor = ColorTemplate.COLOR_NONE; + + public ScatterDataSet(List<Entry> yVals, String label) { + super(yVals, label); + } + + @Override + public DataSet<Entry> copy() { + List<Entry> entries = new ArrayList<Entry>(); + for (int i = 0; i < mEntries.size(); i++) { + entries.add(mEntries.get(i).copy()); + } + ScatterDataSet copied = new ScatterDataSet(entries, getLabel()); + copy(copied); + return copied; + } + + protected void copy(ScatterDataSet scatterDataSet) { + super.copy(scatterDataSet); + scatterDataSet.mShapeSize = mShapeSize; + scatterDataSet.mShapeRenderer = mShapeRenderer; + scatterDataSet.mScatterShapeHoleRadius = mScatterShapeHoleRadius; + scatterDataSet.mScatterShapeHoleColor = mScatterShapeHoleColor; + } + + /** + * Sets the size in density pixels the drawn scattershape will have. This + * only applies for non custom shapes. + * + * @param size + */ + public void setScatterShapeSize(float size) { + mShapeSize = size; + } + + @Override + public float getScatterShapeSize() { + return mShapeSize; + } + + /** + * Sets the ScatterShape this DataSet should be drawn with. This will search for an available IShapeRenderer and set this + * renderer for the DataSet. + * + * @param shape + */ + public void setScatterShape(ScatterChart.ScatterShape shape) { + mShapeRenderer = getRendererForShape(shape); + } + + /** + * Sets a new IShapeRenderer responsible for drawing this DataSet. + * This can also be used to set a custom IShapeRenderer aside from the default ones. + * + * @param shapeRenderer + */ + public void setShapeRenderer(IShapeRenderer shapeRenderer) { + mShapeRenderer = shapeRenderer; + } + + @Override + public IShapeRenderer getShapeRenderer() { + return mShapeRenderer; + } + + /** + * Sets the radius of the hole in the shape (applies to Square, Circle and Triangle) + * Set this to <= 0 to remove holes. + * + * @param holeRadius + */ + public void setScatterShapeHoleRadius(float holeRadius) { + mScatterShapeHoleRadius = holeRadius; + } + + @Override + public float getScatterShapeHoleRadius() { + return mScatterShapeHoleRadius; + } + + /** + * Sets the color for the hole in the shape. + * + * @param holeColor + */ + public void setScatterShapeHoleColor(int holeColor) { + mScatterShapeHoleColor = holeColor; + } + + @Override + public int getScatterShapeHoleColor() { + return mScatterShapeHoleColor; + } + + public static IShapeRenderer getRendererForShape(ScatterChart.ScatterShape shape) { + + switch (shape) { + case SQUARE: + return new SquareShapeRenderer(); + case CIRCLE: + return new CircleShapeRenderer(); + case TRIANGLE: + return new TriangleShapeRenderer(); + case CROSS: + return new CrossShapeRenderer(); + case X: + return new XShapeRenderer(); + case CHEVRON_UP: + return new ChevronUpShapeRenderer(); + case CHEVRON_DOWN: + return new ChevronDownShapeRenderer(); + } + + return null; + } +} diff --git a/MPChartLib/src/main/java/com/github/mikephil/charting/data/filter/Approximator.java b/MPChartLib/src/main/java/com/github/mikephil/charting/data/filter/Approximator.java new file mode 100644 index 00000000..542188e6 --- /dev/null +++ b/MPChartLib/src/main/java/com/github/mikephil/charting/data/filter/Approximator.java @@ -0,0 +1,102 @@ + +package com.github.mikephil.charting.data.filter; + +import android.annotation.TargetApi; +import android.os.Build; + +import java.util.Arrays; + +/** + * Implemented according to Wiki-Pseudocode {@link} + * http://en.wikipedia.org/wiki/Ramer�Douglas�Peucker_algorithm + * + * @author Philipp Baldauf & Phliipp Jahoda + */ +public class Approximator { + + @TargetApi(Build.VERSION_CODES.GINGERBREAD) + public float[] reduceWithDouglasPeucker(float[] points, float tolerance) { + + int greatestIndex = 0; + float greatestDistance = 0f; + + Line line = new Line(points[0], points[1], points[points.length - 2], points[points.length - 1]); + + for (int i = 2; i < points.length - 2; i += 2) { + + float distance = line.distance(points[i], points[i + 1]); + + if (distance > greatestDistance) { + greatestDistance = distance; + greatestIndex = i; + } + } + + if (greatestDistance > tolerance) { + + float[] reduced1 = reduceWithDouglasPeucker(Arrays.copyOfRange(points, 0, greatestIndex + 2), tolerance); + float[] reduced2 = reduceWithDouglasPeucker(Arrays.copyOfRange(points, greatestIndex, points.length), + tolerance); + + float[] result1 = reduced1; + float[] result2 = Arrays.copyOfRange(reduced2, 2, reduced2.length); + + return concat(result1, result2); + } else { + return line.getPoints(); + } + } + + /** + * Combine arrays. + * + * @param arrays + * @return + */ + float[] concat(float[]... arrays) { + int length = 0; + for (float[] array : arrays) { + length += array.length; + } + float[] result = new float[length]; + int pos = 0; + for (float[] array : arrays) { + for (float element : array) { + result[pos] = element; + pos++; + } + } + return result; + } + + private class Line { + + private float[] points; + + private float sxey; + private float exsy; + + private float dx; + private float dy; + + private float length; + + public Line(float x1, float y1, float x2, float y2) { + dx = x1 - x2; + dy = y1 - y2; + sxey = x1 * y2; + exsy = x2 * y1; + length = (float) Math.sqrt(dx * dx + dy * dy); + + points = new float[]{x1, y1, x2, y2}; + } + + public float distance(float x, float y) { + return Math.abs(dy * x - dx * y + sxey - exsy) / length; + } + + public float[] getPoints() { + return points; + } + } +} diff --git a/MPChartLib/src/main/java/com/github/mikephil/charting/data/filter/ApproximatorN.java b/MPChartLib/src/main/java/com/github/mikephil/charting/data/filter/ApproximatorN.java new file mode 100644 index 00000000..9351341c --- /dev/null +++ b/MPChartLib/src/main/java/com/github/mikephil/charting/data/filter/ApproximatorN.java @@ -0,0 +1,146 @@ + +package com.github.mikephil.charting.data.filter; + +import java.util.ArrayList; + +/** + * Implemented according to modified Douglas Peucker {@link} + * http://psimpl.sourceforge.net/douglas-peucker.html + */ +public class ApproximatorN +{ + public float[] reduceWithDouglasPeucker(float[] points, float resultCount) { + + int pointCount = points.length / 2; + + // if a shape has 2 or less points it cannot be reduced + if (resultCount <= 2 || resultCount >= pointCount) + return points; + + boolean[] keep = new boolean[pointCount]; + + // first and last always stay + keep[0] = true; + keep[pointCount - 1] = true; + + int currentStoredPoints = 2; + + ArrayList<Line> queue = new ArrayList<>(); + Line line = new Line(0, pointCount - 1, points); + queue.add(line); + + do { + line = queue.remove(queue.size() - 1); + + // store the key + keep[line.index] = true; + + // check point count tolerance + currentStoredPoints += 1; + + if (currentStoredPoints == resultCount) + break; + + // split the polyline at the key and recurse + Line left = new Line(line.start, line.index, points); + if (left.index > 0) { + int insertionIndex = insertionIndex(left, queue); + queue.add(insertionIndex, left); + } + + Line right = new Line(line.index, line.end, points); + if (right.index > 0) { + int insertionIndex = insertionIndex(right, queue); + queue.add(insertionIndex, right); + } + } while (queue.isEmpty()); + + float[] reducedEntries = new float[currentStoredPoints * 2]; + + for (int i = 0, i2 = 0, r2 = 0; i < currentStoredPoints; i++, r2 += 2) { + if (keep[i]) { + reducedEntries[i2++] = points[r2]; + reducedEntries[i2++] = points[r2 + 1]; + } + } + + return reducedEntries; + } + + private static float distanceToLine( + float ptX, float ptY, float[] + fromLinePoint1, float[] fromLinePoint2) { + float dx = fromLinePoint2[0] - fromLinePoint1[0]; + float dy = fromLinePoint2[1] - fromLinePoint1[1]; + + float dividend = Math.abs( + dy * ptX - + dx * ptY - + fromLinePoint1[0] * fromLinePoint2[1] + + fromLinePoint2[0] * fromLinePoint1[1]); + double divisor = Math.sqrt(dx * dx + dy * dy); + + return (float)(dividend / divisor); + } + + private static class Line { + int start; + int end; + + float distance = 0; + int index = 0; + + Line(int start, int end, float[] points) { + this.start = start; + this.end = end; + + float[] startPoint = new float[]{points[start * 2], points[start * 2 + 1]}; + float[] endPoint = new float[]{points[end * 2], points[end * 2 + 1]}; + + if (end <= start + 1) return; + + for (int i = start + 1, i2 = i * 2; i < end; i++, i2 += 2) { + float distance = distanceToLine( + points[i2], points[i2 + 1], + startPoint, endPoint); + + if (distance > this.distance) { + this.index = i; + this.distance = distance; + } + } + } + + boolean equals(final Line rhs) { + return (start == rhs.start) && (end == rhs.end) && index == rhs.index; + } + + boolean lessThan(final Line rhs) { + return distance < rhs.distance; + } + } + + private static int insertionIndex(Line line, ArrayList<Line> queue) { + int min = 0; + int max = queue.size(); + + while (!queue.isEmpty()) { + int midIndex = min + (max - min) / 2; + Line midLine = queue.get(midIndex); + + if (midLine.equals(line)) { + return midIndex; + } + else if (line.lessThan(midLine)) { + // perform search in left half + max = midIndex; + } + else { + // perform search in right half + min = midIndex + 1; + } + } + + return min; + } +} diff --git a/MPChartLib/src/main/java/com/github/mikephil/charting/exception/DrawingDataSetNotCreatedException.java b/MPChartLib/src/main/java/com/github/mikephil/charting/exception/DrawingDataSetNotCreatedException.java new file mode 100644 index 00000000..d6c1237c --- /dev/null +++ b/MPChartLib/src/main/java/com/github/mikephil/charting/exception/DrawingDataSetNotCreatedException.java @@ -0,0 +1,14 @@ +package com.github.mikephil.charting.exception; + +public class DrawingDataSetNotCreatedException extends RuntimeException { + + /** + * + */ + private static final long serialVersionUID = 1L; + + public DrawingDataSetNotCreatedException() { + super("Have to create a new drawing set first. Call ChartData's createNewDrawingDataSet() method"); + } + +} diff --git a/MPChartLib/src/main/java/com/github/mikephil/charting/formatter/ColorFormatter.java b/MPChartLib/src/main/java/com/github/mikephil/charting/formatter/ColorFormatter.java new file mode 100644 index 00000000..2db66fd4 --- /dev/null +++ b/MPChartLib/src/main/java/com/github/mikephil/charting/formatter/ColorFormatter.java @@ -0,0 +1,24 @@ +package com.github.mikephil.charting.formatter; + +import com.github.mikephil.charting.data.DataSet; +import com.github.mikephil.charting.data.Entry; +import com.github.mikephil.charting.interfaces.datasets.IDataSet; + +/** + * Interface that can be used to return a customized color instead of setting + * colors via the setColor(...) method of the DataSet. + * + * @author Philipp Jahoda + */ +public interface ColorFormatter { + + /** + * Returns the color to be used for the given Entry at the given index (in the entries array) + * + * @param index index in the entries array + * @param e the entry to color + * @param set the DataSet the entry belongs to + * @return + */ + int getColor(int index, Entry e, IDataSet set); +}
\ No newline at end of file diff --git a/MPChartLib/src/main/java/com/github/mikephil/charting/formatter/DefaultAxisValueFormatter.java b/MPChartLib/src/main/java/com/github/mikephil/charting/formatter/DefaultAxisValueFormatter.java new file mode 100644 index 00000000..552c150e --- /dev/null +++ b/MPChartLib/src/main/java/com/github/mikephil/charting/formatter/DefaultAxisValueFormatter.java @@ -0,0 +1,56 @@ +package com.github.mikephil.charting.formatter; + +import com.github.mikephil.charting.components.AxisBase; + +import java.text.DecimalFormat; + +/** + * Created by philipp on 02/06/16. + */ +public class DefaultAxisValueFormatter implements IAxisValueFormatter +{ + + /** + * decimalformat for formatting + */ + protected DecimalFormat mFormat; + + /** + * the number of decimal digits this formatter uses + */ + protected int digits = 0; + + /** + * Constructor that specifies to how many digits the value should be + * formatted. + * + * @param digits + */ + public DefaultAxisValueFormatter(int digits) { + this.digits = digits; + + StringBuffer b = new StringBuffer(); + for (int i = 0; i < digits; i++) { + if (i == 0) + b.append("."); + b.append("0"); + } + + mFormat = new DecimalFormat("###,###,###,##0" + b.toString()); + } + + @Override + public String getFormattedValue(float value, AxisBase axis) { + // avoid memory allocations here (for performance) + return mFormat.format(value); + } + + /** + * Returns the number of decimal digits this formatter uses or -1, if unspecified. + * + * @return + */ + public int getDecimalDigits() { + return digits; + } +} diff --git a/MPChartLib/src/main/java/com/github/mikephil/charting/formatter/DefaultFillFormatter.java b/MPChartLib/src/main/java/com/github/mikephil/charting/formatter/DefaultFillFormatter.java new file mode 100644 index 00000000..851faeb3 --- /dev/null +++ b/MPChartLib/src/main/java/com/github/mikephil/charting/formatter/DefaultFillFormatter.java @@ -0,0 +1,45 @@ +package com.github.mikephil.charting.formatter; + + +import com.github.mikephil.charting.data.LineData; +import com.github.mikephil.charting.interfaces.dataprovider.LineDataProvider; +import com.github.mikephil.charting.interfaces.datasets.ILineDataSet; + +/** + * Default formatter that calculates the position of the filled line. + * + * @author Philipp Jahoda + */ +public class DefaultFillFormatter implements IFillFormatter +{ + + @Override + public float getFillLinePosition(ILineDataSet dataSet, LineDataProvider dataProvider) { + + float fillMin = 0f; + float chartMaxY = dataProvider.getYChartMax(); + float chartMinY = dataProvider.getYChartMin(); + + LineData data = dataProvider.getLineData(); + + if (dataSet.getYMax() > 0 && dataSet.getYMin() < 0) { + fillMin = 0f; + } else { + + float max, min; + + if (data.getYMax() > 0) + max = 0f; + else + max = chartMaxY; + if (data.getYMin() < 0) + min = 0f; + else + min = chartMinY; + + fillMin = dataSet.getYMin() >= 0 ? min : max; + } + + return fillMin; + } +}
\ No newline at end of file diff --git a/MPChartLib/src/main/java/com/github/mikephil/charting/formatter/DefaultValueFormatter.java b/MPChartLib/src/main/java/com/github/mikephil/charting/formatter/DefaultValueFormatter.java new file mode 100644 index 00000000..e2fea4b0 --- /dev/null +++ b/MPChartLib/src/main/java/com/github/mikephil/charting/formatter/DefaultValueFormatter.java @@ -0,0 +1,71 @@ + +package com.github.mikephil.charting.formatter; + +import com.github.mikephil.charting.data.Entry; +import com.github.mikephil.charting.utils.ViewPortHandler; + +import java.text.DecimalFormat; + +/** + * Default formatter used for formatting values inside the chart. Uses a DecimalFormat with + * pre-calculated number of digits (depending on max and min value). + * + * @author Philipp Jahoda + */ +public class DefaultValueFormatter implements IValueFormatter +{ + + /** + * DecimalFormat for formatting + */ + protected DecimalFormat mFormat; + + protected int mDecimalDigits; + + /** + * Constructor that specifies to how many digits the value should be + * formatted. + * + * @param digits + */ + public DefaultValueFormatter(int digits) { + setup(digits); + } + + /** + * Sets up the formatter with a given number of decimal digits. + * + * @param digits + */ + public void setup(int digits) { + + this.mDecimalDigits = digits; + + StringBuffer b = new StringBuffer(); + for (int i = 0; i < digits; i++) { + if (i == 0) + b.append("."); + b.append("0"); + } + + mFormat = new DecimalFormat("###,###,###,##0" + b.toString()); + } + + @Override + public String getFormattedValue(float value, Entry entry, int dataSetIndex, ViewPortHandler viewPortHandler) { + + // put more logic here ... + // avoid memory allocations here (for performance reasons) + + return mFormat.format(value); + } + + /** + * Returns the number of decimal digits this formatter uses. + * + * @return + */ + public int getDecimalDigits() { + return mDecimalDigits; + } +} diff --git a/MPChartLib/src/main/java/com/github/mikephil/charting/formatter/IAxisValueFormatter.java b/MPChartLib/src/main/java/com/github/mikephil/charting/formatter/IAxisValueFormatter.java new file mode 100644 index 00000000..51939b54 --- /dev/null +++ b/MPChartLib/src/main/java/com/github/mikephil/charting/formatter/IAxisValueFormatter.java @@ -0,0 +1,23 @@ +package com.github.mikephil.charting.formatter; + +import com.github.mikephil.charting.components.AxisBase; + +/** + * Created by Philipp Jahoda on 20/09/15. + * Custom formatter interface that allows formatting of + * axis labels before they are being drawn. + */ +public interface IAxisValueFormatter +{ + + /** + * Called when a value from an axis is to be formatted + * before being drawn. For performance reasons, avoid excessive calculations + * and memory allocations inside this method. + * + * @param value the value to be formatted + * @param axis the axis the value belongs to + * @return + */ + String getFormattedValue(float value, AxisBase axis); +} diff --git a/MPChartLib/src/main/java/com/github/mikephil/charting/formatter/IFillFormatter.java b/MPChartLib/src/main/java/com/github/mikephil/charting/formatter/IFillFormatter.java new file mode 100644 index 00000000..e096cc65 --- /dev/null +++ b/MPChartLib/src/main/java/com/github/mikephil/charting/formatter/IFillFormatter.java @@ -0,0 +1,24 @@ +package com.github.mikephil.charting.formatter; + +import com.github.mikephil.charting.interfaces.datasets.ILineDataSet; +import com.github.mikephil.charting.interfaces.dataprovider.LineDataProvider; + +/** + * Interface for providing a custom logic to where the filling line of a LineDataSet + * should end. This of course only works if setFillEnabled(...) is set to true. + * + * @author Philipp Jahoda + */ +public interface IFillFormatter +{ + + /** + * Returns the vertical (y-axis) position where the filled-line of the + * LineDataSet should end. + * + * @param dataSet the ILineDataSet that is currently drawn + * @param dataProvider + * @return + */ + float getFillLinePosition(ILineDataSet dataSet, LineDataProvider dataProvider); +} diff --git a/MPChartLib/src/main/java/com/github/mikephil/charting/formatter/IValueFormatter.java b/MPChartLib/src/main/java/com/github/mikephil/charting/formatter/IValueFormatter.java new file mode 100644 index 00000000..75d2363f --- /dev/null +++ b/MPChartLib/src/main/java/com/github/mikephil/charting/formatter/IValueFormatter.java @@ -0,0 +1,29 @@ +package com.github.mikephil.charting.formatter; + +import com.github.mikephil.charting.data.Entry; +import com.github.mikephil.charting.utils.ViewPortHandler; + +/** + * Interface that allows custom formatting of all values inside the chart before they are + * being drawn to the screen. Simply create your own formatting class and let + * it implement IValueFormatter. Then override the getFormattedValue(...) method + * and return whatever you want. + * + * @author Philipp Jahoda + */ +public interface IValueFormatter +{ + + /** + * Called when a value (from labels inside the chart) is formatted + * before being drawn. For performance reasons, avoid excessive calculations + * and memory allocations inside this method. + * + * @param value the value to be formatted + * @param entry the entry the value belongs to - in e.g. BarChart, this is of class BarEntry + * @param dataSetIndex the index of the DataSet the entry in focus belongs to + * @param viewPortHandler provides information about the current chart state (scale, translation, ...) + * @return the formatted label ready for being drawn + */ + String getFormattedValue(float value, Entry entry, int dataSetIndex, ViewPortHandler viewPortHandler); +} diff --git a/MPChartLib/src/main/java/com/github/mikephil/charting/formatter/IndexAxisValueFormatter.java b/MPChartLib/src/main/java/com/github/mikephil/charting/formatter/IndexAxisValueFormatter.java new file mode 100644 index 00000000..07349a6a --- /dev/null +++ b/MPChartLib/src/main/java/com/github/mikephil/charting/formatter/IndexAxisValueFormatter.java @@ -0,0 +1,69 @@ + +package com.github.mikephil.charting.formatter; + +import com.github.mikephil.charting.components.AxisBase; +import com.github.mikephil.charting.data.Entry; +import com.github.mikephil.charting.utils.ViewPortHandler; + +import java.text.DecimalFormat; +import java.util.Arrays; +import java.util.Collection; + +/** + * This formatter is used for passing an array of x-axis labels, on whole x steps. + */ +public class IndexAxisValueFormatter implements IAxisValueFormatter +{ + private String[] mValues = new String[] {}; + private int mValueCount = 0; + + /** + * An empty constructor. + * Use `setValues` to set the axis labels. + */ + public IndexAxisValueFormatter() { + } + + /** + * Constructor that specifies axis labels. + * + * @param values The values string array + */ + public IndexAxisValueFormatter(String[] values) { + if (values != null) + setValues(values); + } + + /** + * Constructor that specifies axis labels. + * + * @param values The values string array + */ + public IndexAxisValueFormatter(Collection<String> values) { + if (values != null) + setValues(values.toArray(new String[values.size()])); + } + + public String getFormattedValue(float value, AxisBase axis) { + int index = Math.round(value); + + if (index < 0 || index >= mValueCount || index != (int)value) + return ""; + + return mValues[index]; + } + + public String[] getValues() + { + return mValues; + } + + public void setValues(String[] values) + { + if (values == null) + values = new String[] {}; + + this.mValues = values; + this.mValueCount = values.length; + } +} diff --git a/MPChartLib/src/main/java/com/github/mikephil/charting/formatter/LargeValueFormatter.java b/MPChartLib/src/main/java/com/github/mikephil/charting/formatter/LargeValueFormatter.java new file mode 100644 index 00000000..211401ad --- /dev/null +++ b/MPChartLib/src/main/java/com/github/mikephil/charting/formatter/LargeValueFormatter.java @@ -0,0 +1,103 @@ + +package com.github.mikephil.charting.formatter; + +import com.github.mikephil.charting.components.AxisBase; +import com.github.mikephil.charting.data.Entry; +import com.github.mikephil.charting.utils.ViewPortHandler; + +import java.text.DecimalFormat; + +/** + * Predefined value-formatter that formats large numbers in a pretty way. + * Outputs: 856 = 856; 1000 = 1k; 5821 = 5.8k; 10500 = 10k; 101800 = 102k; + * 2000000 = 2m; 7800000 = 7.8m; 92150000 = 92m; 123200000 = 123m; 9999999 = + * 10m; 1000000000 = 1b; Special thanks to Roman Gromov + * (https://github.com/romangromov) for this piece of code. + * + * @author Philipp Jahoda + * @author Oleksandr Tyshkovets <olexandr.tyshkovets@gmail.com> + */ +public class LargeValueFormatter implements IValueFormatter, IAxisValueFormatter +{ + + private String[] mSuffix = new String[]{ + "", "k", "m", "b", "t" + }; + private int mMaxLength = 5; + private DecimalFormat mFormat; + private String mText = ""; + + public LargeValueFormatter() { + mFormat = new DecimalFormat("###E00"); + } + + /** + * Creates a formatter that appends a specified text to the result string + * + * @param appendix a text that will be appended + */ + public LargeValueFormatter(String appendix) { + this(); + mText = appendix; + } + + // IValueFormatter + @Override + public String getFormattedValue(float value, Entry entry, int dataSetIndex, ViewPortHandler viewPortHandler) { + return makePretty(value) + mText; + } + + // IAxisValueFormatter + @Override + public String getFormattedValue(float value, AxisBase axis) { + return makePretty(value) + mText; + } + + /** + * Set an appendix text to be added at the end of the formatted value. + * + * @param appendix + */ + public void setAppendix(String appendix) { + this.mText = appendix; + } + + /** + * Set custom suffix to be appended after the values. + * Default suffix: ["", "k", "m", "b", "t"] + * + * @param suffix new suffix + */ + public void setSuffix(String[] suffix) { + this.mSuffix = suffix; + } + + public void setMaxLength(int maxLength) { + this.mMaxLength = maxLength; + } + + /** + * Formats each number properly. Special thanks to Roman Gromov + * (https://github.com/romangromov) for this piece of code. + */ + private String makePretty(double number) { + + String r = mFormat.format(number); + + int numericValue1 = Character.getNumericValue(r.charAt(r.length() - 1)); + int numericValue2 = Character.getNumericValue(r.charAt(r.length() - 2)); + int combined = Integer.valueOf(numericValue2 + "" + numericValue1); + + r = r.replaceAll("E[0-9][0-9]", mSuffix[combined / 3]); + + while (r.length() > mMaxLength || r.matches("[0-9]+\\.[a-z]")) { + r = r.substring(0, r.length() - 2) + r.substring(r.length() - 1); + } + + return r; + } + + public int getDecimalDigits() { + return 0; + } +} diff --git a/MPChartLib/src/main/java/com/github/mikephil/charting/formatter/PercentFormatter.java b/MPChartLib/src/main/java/com/github/mikephil/charting/formatter/PercentFormatter.java new file mode 100644 index 00000000..de8a1025 --- /dev/null +++ b/MPChartLib/src/main/java/com/github/mikephil/charting/formatter/PercentFormatter.java @@ -0,0 +1,49 @@ + +package com.github.mikephil.charting.formatter; + +import com.github.mikephil.charting.components.AxisBase; +import com.github.mikephil.charting.data.Entry; +import com.github.mikephil.charting.utils.ViewPortHandler; + +import java.text.DecimalFormat; + +/** + * This IValueFormatter is just for convenience and simply puts a "%" sign after + * each value. (Recommeded for PieChart) + * + * @author Philipp Jahoda + */ +public class PercentFormatter implements IValueFormatter, IAxisValueFormatter +{ + + protected DecimalFormat mFormat; + + public PercentFormatter() { + mFormat = new DecimalFormat("###,###,##0.0"); + } + + /** + * Allow a custom decimalformat + * + * @param format + */ + public PercentFormatter(DecimalFormat format) { + this.mFormat = format; + } + + // IValueFormatter + @Override + public String getFormattedValue(float value, Entry entry, int dataSetIndex, ViewPortHandler viewPortHandler) { + return mFormat.format(value) + " %"; + } + + // IAxisValueFormatter + @Override + public String getFormattedValue(float value, AxisBase axis) { + return mFormat.format(value) + " %"; + } + + public int getDecimalDigits() { + return 1; + } +} diff --git a/MPChartLib/src/main/java/com/github/mikephil/charting/formatter/StackedValueFormatter.java b/MPChartLib/src/main/java/com/github/mikephil/charting/formatter/StackedValueFormatter.java new file mode 100644 index 00000000..0e835163 --- /dev/null +++ b/MPChartLib/src/main/java/com/github/mikephil/charting/formatter/StackedValueFormatter.java @@ -0,0 +1,75 @@ +package com.github.mikephil.charting.formatter; + +import com.github.mikephil.charting.data.BarEntry; +import com.github.mikephil.charting.data.Entry; +import com.github.mikephil.charting.utils.ViewPortHandler; + +import java.text.DecimalFormat; + +/** + * Created by Philipp Jahoda on 28/01/16. + * <p/> + * A formatter specifically for stacked BarChart that allows to specify whether the all stack values + * or just the top value should be drawn. + */ +public class StackedValueFormatter implements IValueFormatter +{ + + /** + * if true, all stack values of the stacked bar entry are drawn, else only top + */ + private boolean mDrawWholeStack; + + /** + * a string that should be appended behind the value + */ + private String mAppendix; + + private DecimalFormat mFormat; + + /** + * Constructor. + * + * @param drawWholeStack if true, all stack values of the stacked bar entry are drawn, else only top + * @param appendix a string that should be appended behind the value + * @param decimals the number of decimal digits to use + */ + public StackedValueFormatter(boolean drawWholeStack, String appendix, int decimals) { + this.mDrawWholeStack = drawWholeStack; + this.mAppendix = appendix; + + StringBuffer b = new StringBuffer(); + for (int i = 0; i < decimals; i++) { + if (i == 0) + b.append("."); + b.append("0"); + } + + this.mFormat = new DecimalFormat("###,###,###,##0" + b.toString()); + } + + @Override + public String getFormattedValue(float value, Entry entry, int dataSetIndex, ViewPortHandler viewPortHandler) { + + if (!mDrawWholeStack && entry instanceof BarEntry) { + + BarEntry barEntry = (BarEntry) entry; + float[] vals = barEntry.getYVals(); + + if (vals != null) { + + // find out if we are on top of the stack + if (vals[vals.length - 1] == value) { + + // return the "sum" across all stack values + return mFormat.format(barEntry.getY()) + mAppendix; + } else { + return ""; // return empty + } + } + } + + // return the "proposed" value + return mFormat.format(value) + mAppendix; + } +} diff --git a/MPChartLib/src/main/java/com/github/mikephil/charting/highlight/BarHighlighter.java b/MPChartLib/src/main/java/com/github/mikephil/charting/highlight/BarHighlighter.java new file mode 100644 index 00000000..af83a453 --- /dev/null +++ b/MPChartLib/src/main/java/com/github/mikephil/charting/highlight/BarHighlighter.java @@ -0,0 +1,163 @@ +package com.github.mikephil.charting.highlight; + +import com.github.mikephil.charting.data.BarData; +import com.github.mikephil.charting.data.BarEntry; +import com.github.mikephil.charting.data.BarLineScatterCandleBubbleData; +import com.github.mikephil.charting.interfaces.dataprovider.BarDataProvider; +import com.github.mikephil.charting.interfaces.datasets.IBarDataSet; +import com.github.mikephil.charting.utils.MPPointD; + +/** + * Created by Philipp Jahoda on 22/07/15. + */ +public class BarHighlighter extends ChartHighlighter<BarDataProvider> { + + public BarHighlighter(BarDataProvider chart) { + super(chart); + } + + @Override + public Highlight getHighlight(float x, float y) { + Highlight high = super.getHighlight(x, y); + + if(high == null) { + return null; + } + + MPPointD pos = getValsForTouch(x, y); + + BarData barData = mChart.getBarData(); + + IBarDataSet set = barData.getDataSetByIndex(high.getDataSetIndex()); + if (set.isStacked()) { + + return getStackedHighlight(high, + set, + (float) pos.x, + (float) pos.y); + } + + MPPointD.recycleInstance(pos); + + return high; + } + + /** + * This method creates the Highlight object that also indicates which value of a stacked BarEntry has been + * selected. + * + * @param high the Highlight to work with looking for stacked values + * @param set + * @param xVal + * @param yVal + * @return + */ + public Highlight getStackedHighlight(Highlight high, IBarDataSet set, float xVal, float yVal) { + + BarEntry entry = set.getEntryForXValue(xVal, yVal); + + if (entry == null) + return null; + + // not stacked + if (entry.getYVals() == null) { + return high; + } else { + Range[] ranges = entry.getRanges(); + + if (ranges.length > 0) { + int stackIndex = getClosestStackIndex(ranges, yVal); + + MPPointD pixels = mChart.getTransformer(set.getAxisDependency()).getPixelForValues(high.getX(), ranges[stackIndex].to); + + Highlight stackedHigh = new Highlight( + entry.getX(), + entry.getY(), + (float) pixels.x, + (float) pixels.y, + high.getDataSetIndex(), + stackIndex, + high.getAxis() + ); + + MPPointD.recycleInstance(pixels); + + return stackedHigh; + } + } + + return null; + } + + /** + * Returns the index of the closest value inside the values array / ranges (stacked barchart) to the value + * given as + * a parameter. + * + * @param ranges + * @param value + * @return + */ + protected int getClosestStackIndex(Range[] ranges, float value) { + + if (ranges == null || ranges.length == 0) + return 0; + + int stackIndex = 0; + + for (Range range : ranges) { + if (range.contains(value)) + return stackIndex; + else + stackIndex++; + } + + int length = Math.max(ranges.length - 1, 0); + + return (value > ranges[length].to) ? length : 0; + } + +// /** +// * Splits up the stack-values of the given bar-entry into Range objects. +// * +// * @param entry +// * @return +// */ +// protected Range[] getRanges(BarEntry entry) { +// +// float[] values = entry.getYVals(); +// +// if (values == null || values.length == 0) +// return new Range[0]; +// +// Range[] ranges = new Range[values.length]; +// +// float negRemain = -entry.getNegativeSum(); +// float posRemain = 0f; +// +// for (int i = 0; i < ranges.length; i++) { +// +// float value = values[i]; +// +// if (value < 0) { +// ranges[i] = new Range(negRemain, negRemain + Math.abs(value)); +// negRemain += Math.abs(value); +// } else { +// ranges[i] = new Range(posRemain, posRemain + value); +// posRemain += value; +// } +// } +// +// return ranges; +// } + + @Override + protected float getDistance(float x1, float y1, float x2, float y2) { + return Math.abs(x1 - x2); + } + + @Override + protected BarLineScatterCandleBubbleData getData() { + return mChart.getBarData(); + } +} diff --git a/MPChartLib/src/main/java/com/github/mikephil/charting/highlight/ChartHighlighter.java b/MPChartLib/src/main/java/com/github/mikephil/charting/highlight/ChartHighlighter.java new file mode 100644 index 00000000..f889bf19 --- /dev/null +++ b/MPChartLib/src/main/java/com/github/mikephil/charting/highlight/ChartHighlighter.java @@ -0,0 +1,246 @@ +package com.github.mikephil.charting.highlight; + +import com.github.mikephil.charting.components.YAxis; +import com.github.mikephil.charting.data.BarLineScatterCandleBubbleData; +import com.github.mikephil.charting.data.DataSet; +import com.github.mikephil.charting.data.Entry; +import com.github.mikephil.charting.interfaces.dataprovider.BarLineScatterCandleBubbleDataProvider; +import com.github.mikephil.charting.interfaces.datasets.IDataSet; +import com.github.mikephil.charting.utils.MPPointD; + +import java.util.ArrayList; +import java.util.List; + +/** + * Created by Philipp Jahoda on 21/07/15. + */ +public class ChartHighlighter<T extends BarLineScatterCandleBubbleDataProvider> implements IHighlighter +{ + + /** + * instance of the data-provider + */ + protected T mChart; + + /** + * buffer for storing previously highlighted values + */ + protected List<Highlight> mHighlightBuffer = new ArrayList<Highlight>(); + + public ChartHighlighter(T chart) { + this.mChart = chart; + } + + @Override + public Highlight getHighlight(float x, float y) { + + MPPointD pos = getValsForTouch(x, y); + float xVal = (float) pos.x; + MPPointD.recycleInstance(pos); + + Highlight high = getHighlightForX(xVal, x, y); + return high; + } + + /** + * Returns a recyclable MPPointD instance. + * Returns the corresponding xPos for a given touch-position in pixels. + * + * @param x + * @param y + * @return + */ + protected MPPointD getValsForTouch(float x, float y) { + + // take any transformer to determine the x-axis value + MPPointD pos = mChart.getTransformer(YAxis.AxisDependency.LEFT).getValuesByTouchPoint(x, y); + return pos; + } + + /** + * Returns the corresponding Highlight for a given xVal and x- and y-touch position in pixels. + * + * @param xVal + * @param x + * @param y + * @return + */ + protected Highlight getHighlightForX(float xVal, float x, float y) { + + List<Highlight> closestValues = getHighlightsAtXValue(xVal, x, y); + + if(closestValues.isEmpty()) { + return null; + } + + float leftAxisMinDist = getMinimumDistance(closestValues, y, YAxis.AxisDependency.LEFT); + float rightAxisMinDist = getMinimumDistance(closestValues, y, YAxis.AxisDependency.RIGHT); + + YAxis.AxisDependency axis = leftAxisMinDist < rightAxisMinDist ? YAxis.AxisDependency.LEFT : YAxis.AxisDependency.RIGHT; + + Highlight detail = getClosestHighlightByPixel(closestValues, x, y, axis, mChart.getMaxHighlightDistance()); + + return detail; + } + + /** + * Returns the minimum distance from a touch value (in pixels) to the + * closest value (in pixels) that is displayed in the chart. + * + * @param closestValues + * @param pos + * @param axis + * @return + */ + protected float getMinimumDistance(List<Highlight> closestValues, float pos, YAxis.AxisDependency axis) { + + float distance = Float.MAX_VALUE; + + for (int i = 0; i < closestValues.size(); i++) { + + Highlight high = closestValues.get(i); + + if (high.getAxis() == axis) { + + float tempDistance = Math.abs(getHighlightPos(high) - pos); + if (tempDistance < distance) { + distance = tempDistance; + } + } + } + + return distance; + } + + protected float getHighlightPos(Highlight h) { + return h.getYPx(); + } + + /** + * Returns a list of Highlight objects representing the entries closest to the given xVal. + * The returned list contains two objects per DataSet (closest rounding up, closest rounding down). + * + * @param xVal the transformed x-value of the x-touch position + * @param x touch position + * @param y touch position + * @return + */ + protected List<Highlight> getHighlightsAtXValue(float xVal, float x, float y) { + + mHighlightBuffer.clear(); + + BarLineScatterCandleBubbleData data = getData(); + + if (data == null) + return mHighlightBuffer; + + for (int i = 0, dataSetCount = data.getDataSetCount(); i < dataSetCount; i++) { + + IDataSet dataSet = data.getDataSetByIndex(i); + + // don't include DataSets that cannot be highlighted + if (!dataSet.isHighlightEnabled()) + continue; + + mHighlightBuffer.addAll(buildHighlights(dataSet, i, xVal, DataSet.Rounding.CLOSEST)); + } + + return mHighlightBuffer; + } + + /** + * An array of `Highlight` objects corresponding to the selected xValue and dataSetIndex. + * + * @param set + * @param dataSetIndex + * @param xVal + * @param rounding + * @return + */ + protected List<Highlight> buildHighlights(IDataSet set, int dataSetIndex, float xVal, DataSet.Rounding rounding) { + + ArrayList<Highlight> highlights = new ArrayList<>(); + + //noinspection unchecked + List<Entry> entries = set.getEntriesForXValue(xVal); + if (entries.size() == 0) { + // Try to find closest x-value and take all entries for that x-value + final Entry closest = set.getEntryForXValue(xVal, Float.NaN, rounding); + if (closest != null) + { + //noinspection unchecked + entries = set.getEntriesForXValue(closest.getX()); + } + } + + if (entries.size() == 0) + return highlights; + + for (Entry e : entries) { + MPPointD pixels = mChart.getTransformer( + set.getAxisDependency()).getPixelForValues(e.getX(), e.getY()); + + highlights.add(new Highlight( + e.getX(), e.getY(), + (float) pixels.x, (float) pixels.y, + dataSetIndex, set.getAxisDependency())); + } + + return highlights; + } + + /** + * Returns the Highlight of the DataSet that contains the closest value on the + * y-axis. + * + * @param closestValues contains two Highlight objects per DataSet closest to the selected x-position (determined by + * rounding up an down) + * @param x + * @param y + * @param axis the closest axis + * @param minSelectionDistance + * @return + */ + public Highlight getClosestHighlightByPixel(List<Highlight> closestValues, float x, float y, + YAxis.AxisDependency axis, float minSelectionDistance) { + + Highlight closest = null; + float distance = minSelectionDistance; + + for (int i = 0; i < closestValues.size(); i++) { + + Highlight high = closestValues.get(i); + + if (axis == null || high.getAxis() == axis) { + + float cDistance = getDistance(x, y, high.getXPx(), high.getYPx()); + + if (cDistance < distance) { + closest = high; + distance = cDistance; + } + } + } + + return closest; + } + + /** + * Calculates the distance between the two given points. + * + * @param x1 + * @param y1 + * @param x2 + * @param y2 + * @return + */ + protected float getDistance(float x1, float y1, float x2, float y2) { + //return Math.abs(y1 - y2); + //return Math.abs(x1 - x2); + return (float) Math.hypot(x1 - x2, y1 - y2); + } + + protected BarLineScatterCandleBubbleData getData() { + return mChart.getData(); + } +} diff --git a/MPChartLib/src/main/java/com/github/mikephil/charting/highlight/CombinedHighlighter.java b/MPChartLib/src/main/java/com/github/mikephil/charting/highlight/CombinedHighlighter.java new file mode 100644 index 00000000..76788af6 --- /dev/null +++ b/MPChartLib/src/main/java/com/github/mikephil/charting/highlight/CombinedHighlighter.java @@ -0,0 +1,93 @@ +package com.github.mikephil.charting.highlight; + +import com.github.mikephil.charting.data.BarData; +import com.github.mikephil.charting.data.BarLineScatterCandleBubbleData; +import com.github.mikephil.charting.data.ChartData; +import com.github.mikephil.charting.data.DataSet; +import com.github.mikephil.charting.interfaces.dataprovider.BarDataProvider; +import com.github.mikephil.charting.interfaces.dataprovider.CombinedDataProvider; +import com.github.mikephil.charting.interfaces.datasets.IDataSet; + +import java.util.List; + +/** + * Created by Philipp Jahoda on 12/09/15. + */ +public class CombinedHighlighter extends ChartHighlighter<CombinedDataProvider> implements IHighlighter +{ + + /** + * bar highlighter for supporting stacked highlighting + */ + protected BarHighlighter barHighlighter; + + public CombinedHighlighter(CombinedDataProvider chart, BarDataProvider barChart) { + super(chart); + + // if there is BarData, create a BarHighlighter + barHighlighter = barChart.getBarData() == null ? null : new BarHighlighter(barChart); + } + + @Override + protected List<Highlight> getHighlightsAtXValue(float xVal, float x, float y) { + + mHighlightBuffer.clear(); + + List<BarLineScatterCandleBubbleData> dataObjects = mChart.getCombinedData().getAllData(); + + for (int i = 0; i < dataObjects.size(); i++) { + + ChartData dataObject = dataObjects.get(i); + + // in case of BarData, let the BarHighlighter take over + if (barHighlighter != null && dataObject instanceof BarData) { + Highlight high = barHighlighter.getHighlight(x, y); + + if (high != null) { + high.setDataIndex(i); + mHighlightBuffer.add(high); + } + } else { + + for (int j = 0, dataSetCount = dataObject.getDataSetCount(); j < dataSetCount; j++) { + + IDataSet dataSet = dataObjects.get(i).getDataSetByIndex(j); + + // don't include datasets that cannot be highlighted + if (!dataSet.isHighlightEnabled()) + continue; + + List<Highlight> highs = buildHighlights(dataSet, j, xVal, DataSet.Rounding.CLOSEST); + for (Highlight high : highs) + { + high.setDataIndex(i); + mHighlightBuffer.add(high); + } + } + } + } + + return mHighlightBuffer; + } + +// protected Highlight getClosest(float x, float y, Highlight... highs) { +// +// Highlight closest = null; +// float minDistance = Float.MAX_VALUE; +// +// for (Highlight high : highs) { +// +// if (high == null) +// continue; +// +// float tempDistance = getDistance(x, y, high.getXPx(), high.getYPx()); +// +// if (tempDistance < minDistance) { +// minDistance = tempDistance; +// closest = high; +// } +// } +// +// return closest; +// } +} diff --git a/MPChartLib/src/main/java/com/github/mikephil/charting/highlight/Highlight.java b/MPChartLib/src/main/java/com/github/mikephil/charting/highlight/Highlight.java new file mode 100644 index 00000000..62307cbe --- /dev/null +++ b/MPChartLib/src/main/java/com/github/mikephil/charting/highlight/Highlight.java @@ -0,0 +1,243 @@ + +package com.github.mikephil.charting.highlight; + +import com.github.mikephil.charting.components.YAxis; + +/** + * Contains information needed to determine the highlighted value. + * + * @author Philipp Jahoda + */ +public class Highlight { + + /** + * the x-value of the highlighted value + */ + private float mX = Float.NaN; + + /** + * the y-value of the highlighted value + */ + private float mY = Float.NaN; + + /** + * the x-pixel of the highlight + */ + private float mXPx; + + /** + * the y-pixel of the highlight + */ + private float mYPx; + + /** + * the index of the data object - in case it refers to more than one + */ + private int mDataIndex = -1; + + /** + * the index of the dataset the highlighted value is in + */ + private int mDataSetIndex; + + /** + * index which value of a stacked bar entry is highlighted, default -1 + */ + private int mStackIndex = -1; + + /** + * the axis the highlighted value belongs to + */ + private YAxis.AxisDependency axis; + + /** + * the x-position (pixels) on which this highlight object was last drawn + */ + private float mDrawX; + + /** + * the y-position (pixels) on which this highlight object was last drawn + */ + private float mDrawY; + + public Highlight(float x, float y, int dataSetIndex, int dataIndex) { + this.mX = x; + this.mY = y; + this.mDataSetIndex = dataSetIndex; + this.mDataIndex = dataIndex; + } + + public Highlight(float x, float y, int dataSetIndex) { + this.mX = x; + this.mY = y; + this.mDataSetIndex = dataSetIndex; + this.mDataIndex = -1; + } + + public Highlight(float x, int dataSetIndex, int stackIndex) { + this(x, Float.NaN, dataSetIndex); + this.mStackIndex = stackIndex; + } + + /** + * constructor + * + * @param x the x-value of the highlighted value + * @param y the y-value of the highlighted value + * @param dataSetIndex the index of the DataSet the highlighted value belongs to + */ + public Highlight(float x, float y, float xPx, float yPx, int dataSetIndex, YAxis.AxisDependency axis) { + this.mX = x; + this.mY = y; + this.mXPx = xPx; + this.mYPx = yPx; + this.mDataSetIndex = dataSetIndex; + this.axis = axis; + } + + /** + * Constructor, only used for stacked-barchart. + * + * @param x the index of the highlighted value on the x-axis + * @param y the y-value of the highlighted value + * @param dataSetIndex the index of the DataSet the highlighted value belongs to + * @param stackIndex references which value of a stacked-bar entry has been + * selected + */ + public Highlight(float x, float y, float xPx, float yPx, int dataSetIndex, int stackIndex, YAxis.AxisDependency axis) { + this(x, y, xPx, yPx, dataSetIndex, axis); + this.mStackIndex = stackIndex; + } + + /** + * returns the x-value of the highlighted value + * + * @return + */ + public float getX() { + return mX; + } + + /** + * returns the y-value of the highlighted value + * + * @return + */ + public float getY() { + return mY; + } + + /** + * returns the x-position of the highlight in pixels + */ + public float getXPx() { + return mXPx; + } + + /** + * returns the y-position of the highlight in pixels + */ + public float getYPx() { + return mYPx; + } + + /** + * the index of the data object - in case it refers to more than one + * + * @return + */ + public int getDataIndex() { + return mDataIndex; + } + + public void setDataIndex(int mDataIndex) { + this.mDataIndex = mDataIndex; + } + + /** + * returns the index of the DataSet the highlighted value is in + * + * @return + */ + public int getDataSetIndex() { + return mDataSetIndex; + } + + /** + * Only needed if a stacked-barchart entry was highlighted. References the + * selected value within the stacked-entry. + * + * @return + */ + public int getStackIndex() { + return mStackIndex; + } + + public boolean isStacked() { + return mStackIndex >= 0; + } + + /** + * Returns the axis the highlighted value belongs to. + * + * @return + */ + public YAxis.AxisDependency getAxis() { + return axis; + } + + /** + * Sets the x- and y-position (pixels) where this highlight was last drawn. + * + * @param x + * @param y + */ + public void setDraw(float x, float y) { + this.mDrawX = x; + this.mDrawY = y; + } + + /** + * Returns the x-position in pixels where this highlight object was last drawn. + * + * @return + */ + public float getDrawX() { + return mDrawX; + } + + /** + * Returns the y-position in pixels where this highlight object was last drawn. + * + * @return + */ + public float getDrawY() { + return mDrawY; + } + + /** + * Returns true if this highlight object is equal to the other (compares + * xIndex and dataSetIndex) + * + * @param h + * @return + */ + public boolean equalTo(Highlight h) { + + if (h == null) + return false; + else { + if (this.mDataSetIndex == h.mDataSetIndex && this.mX == h.mX + && this.mStackIndex == h.mStackIndex && this.mDataIndex == h.mDataIndex) + return true; + else + return false; + } + } + + @Override + public String toString() { + return "Highlight, x: " + mX + ", y: " + mY + ", dataSetIndex: " + mDataSetIndex + + ", stackIndex (only stacked barentry): " + mStackIndex; + } +} diff --git a/MPChartLib/src/main/java/com/github/mikephil/charting/highlight/HorizontalBarHighlighter.java b/MPChartLib/src/main/java/com/github/mikephil/charting/highlight/HorizontalBarHighlighter.java new file mode 100644 index 00000000..d96298e0 --- /dev/null +++ b/MPChartLib/src/main/java/com/github/mikephil/charting/highlight/HorizontalBarHighlighter.java @@ -0,0 +1,85 @@ +package com.github.mikephil.charting.highlight; + +import com.github.mikephil.charting.data.BarData; +import com.github.mikephil.charting.data.DataSet; +import com.github.mikephil.charting.data.Entry; +import com.github.mikephil.charting.interfaces.dataprovider.BarDataProvider; +import com.github.mikephil.charting.interfaces.datasets.IBarDataSet; +import com.github.mikephil.charting.interfaces.datasets.IDataSet; +import com.github.mikephil.charting.utils.MPPointD; + +import java.util.ArrayList; +import java.util.List; + +/** + * Created by Philipp Jahoda on 22/07/15. + */ +public class HorizontalBarHighlighter extends BarHighlighter { + + public HorizontalBarHighlighter(BarDataProvider chart) { + super(chart); + } + + @Override + public Highlight getHighlight(float x, float y) { + + BarData barData = mChart.getBarData(); + + MPPointD pos = getValsForTouch(y, x); + + Highlight high = getHighlightForX((float) pos.y, y, x); + if (high == null) + return null; + + IBarDataSet set = barData.getDataSetByIndex(high.getDataSetIndex()); + if (set.isStacked()) { + + return getStackedHighlight(high, + set, + (float) pos.y, + (float) pos.x); + } + + MPPointD.recycleInstance(pos); + + return high; + } + + @Override + protected List<Highlight> buildHighlights(IDataSet set, int dataSetIndex, float xVal, DataSet.Rounding rounding) { + + ArrayList<Highlight> highlights = new ArrayList<>(); + + //noinspection unchecked + List<Entry> entries = set.getEntriesForXValue(xVal); + if (entries.size() == 0) { + // Try to find closest x-value and take all entries for that x-value + final Entry closest = set.getEntryForXValue(xVal, Float.NaN, rounding); + if (closest != null) + { + //noinspection unchecked + entries = set.getEntriesForXValue(closest.getX()); + } + } + + if (entries.size() == 0) + return highlights; + + for (Entry e : entries) { + MPPointD pixels = mChart.getTransformer( + set.getAxisDependency()).getPixelForValues(e.getY(), e.getX()); + + highlights.add(new Highlight( + e.getX(), e.getY(), + (float) pixels.x, (float) pixels.y, + dataSetIndex, set.getAxisDependency())); + } + + return highlights; + } + + @Override + protected float getDistance(float x1, float y1, float x2, float y2) { + return Math.abs(y1 - y2); + } +} diff --git a/MPChartLib/src/main/java/com/github/mikephil/charting/highlight/IHighlighter.java b/MPChartLib/src/main/java/com/github/mikephil/charting/highlight/IHighlighter.java new file mode 100644 index 00000000..d0ca0cfe --- /dev/null +++ b/MPChartLib/src/main/java/com/github/mikephil/charting/highlight/IHighlighter.java @@ -0,0 +1,17 @@ +package com.github.mikephil.charting.highlight; + +/** + * Created by philipp on 10/06/16. + */ +public interface IHighlighter +{ + + /** + * Returns a Highlight object corresponding to the given x- and y- touch positions in pixels. + * + * @param x + * @param y + * @return + */ + Highlight getHighlight(float x, float y); +} diff --git a/MPChartLib/src/main/java/com/github/mikephil/charting/highlight/PieHighlighter.java b/MPChartLib/src/main/java/com/github/mikephil/charting/highlight/PieHighlighter.java new file mode 100644 index 00000000..b4c5a1b2 --- /dev/null +++ b/MPChartLib/src/main/java/com/github/mikephil/charting/highlight/PieHighlighter.java @@ -0,0 +1,25 @@ +package com.github.mikephil.charting.highlight; + +import com.github.mikephil.charting.charts.PieChart; +import com.github.mikephil.charting.data.Entry; +import com.github.mikephil.charting.interfaces.datasets.IPieDataSet; + +/** + * Created by philipp on 12/06/16. + */ +public class PieHighlighter extends PieRadarHighlighter<PieChart> { + + public PieHighlighter(PieChart chart) { + super(chart); + } + + @Override + protected Highlight getClosestHighlight(int index, float x, float y) { + + IPieDataSet set = mChart.getData().getDataSet(); + + final Entry entry = set.getEntryForIndex(index); + + return new Highlight(index, entry.getY(), x, y, 0, set.getAxisDependency()); + } +} diff --git a/MPChartLib/src/main/java/com/github/mikephil/charting/highlight/PieRadarHighlighter.java b/MPChartLib/src/main/java/com/github/mikephil/charting/highlight/PieRadarHighlighter.java new file mode 100644 index 00000000..a19906d7 --- /dev/null +++ b/MPChartLib/src/main/java/com/github/mikephil/charting/highlight/PieRadarHighlighter.java @@ -0,0 +1,66 @@ +package com.github.mikephil.charting.highlight; + +import com.github.mikephil.charting.charts.PieChart; +import com.github.mikephil.charting.charts.PieRadarChartBase; + +import java.util.ArrayList; +import java.util.List; + +/** + * Created by philipp on 12/06/16. + */ +public abstract class PieRadarHighlighter<T extends PieRadarChartBase> implements IHighlighter +{ + + protected T mChart; + + /** + * buffer for storing previously highlighted values + */ + protected List<Highlight> mHighlightBuffer = new ArrayList<Highlight>(); + + public PieRadarHighlighter(T chart) { + this.mChart = chart; + } + + @Override + public Highlight getHighlight(float x, float y) { + + float touchDistanceToCenter = mChart.distanceToCenter(x, y); + + // check if a slice was touched + if (touchDistanceToCenter > mChart.getRadius()) { + + // if no slice was touched, highlight nothing + return null; + + } else { + + float angle = mChart.getAngleForPoint(x, y); + + if (mChart instanceof PieChart) { + angle /= mChart.getAnimator().getPhaseY(); + } + + int index = mChart.getIndexForAngle(angle); + + // check if the index could be found + if (index < 0 || index >= mChart.getData().getMaxEntryCountSet().getEntryCount()) { + return null; + + } else { + return getClosestHighlight(index, x, y); + } + } + } + + /** + * Returns the closest Highlight object of the given objects based on the touch position inside the chart. + * + * @param index + * @param x + * @param y + * @return + */ + protected abstract Highlight getClosestHighlight(int index, float x, float y); +} diff --git a/MPChartLib/src/main/java/com/github/mikephil/charting/highlight/RadarHighlighter.java b/MPChartLib/src/main/java/com/github/mikephil/charting/highlight/RadarHighlighter.java new file mode 100644 index 00000000..3c4f6d03 --- /dev/null +++ b/MPChartLib/src/main/java/com/github/mikephil/charting/highlight/RadarHighlighter.java @@ -0,0 +1,79 @@ +package com.github.mikephil.charting.highlight; + +import com.github.mikephil.charting.charts.RadarChart; +import com.github.mikephil.charting.data.Entry; +import com.github.mikephil.charting.interfaces.datasets.IDataSet; +import com.github.mikephil.charting.utils.MPPointF; +import com.github.mikephil.charting.utils.Utils; + +import java.util.List; + +/** + * Created by philipp on 12/06/16. + */ +public class RadarHighlighter extends PieRadarHighlighter<RadarChart> { + + public RadarHighlighter(RadarChart chart) { + super(chart); + } + + @Override + protected Highlight getClosestHighlight(int index, float x, float y) { + + List<Highlight> highlights = getHighlightsAtIndex(index); + + float distanceToCenter = mChart.distanceToCenter(x, y) / mChart.getFactor(); + + Highlight closest = null; + float distance = Float.MAX_VALUE; + + for (int i = 0; i < highlights.size(); i++) { + + Highlight high = highlights.get(i); + + float cdistance = Math.abs(high.getY() - distanceToCenter); + if (cdistance < distance) { + closest = high; + distance = cdistance; + } + } + + return closest; + } + /** + * Returns an array of Highlight objects for the given index. The Highlight + * objects give information about the value at the selected index and the + * DataSet it belongs to. INFORMATION: This method does calculations at + * runtime. Do not over-use in performance critical situations. + * + * @param index + * @return + */ + protected List<Highlight> getHighlightsAtIndex(int index) { + + mHighlightBuffer.clear(); + + float phaseX = mChart.getAnimator().getPhaseX(); + float phaseY = mChart.getAnimator().getPhaseY(); + float sliceangle = mChart.getSliceAngle(); + float factor = mChart.getFactor(); + + MPPointF pOut = MPPointF.getInstance(0,0); + for (int i = 0; i < mChart.getData().getDataSetCount(); i++) { + + IDataSet<?> dataSet = mChart.getData().getDataSetByIndex(i); + + final Entry entry = dataSet.getEntryForIndex(index); + + float y = (entry.getY() - mChart.getYChartMin()); + + Utils.getPosition( + mChart.getCenterOffsets(), y * factor * phaseY, + sliceangle * index * phaseX + mChart.getRotationAngle(), pOut); + + mHighlightBuffer.add(new Highlight(index, entry.getY(), pOut.x, pOut.y, i, dataSet.getAxisDependency())); + } + + return mHighlightBuffer; + } +} diff --git a/MPChartLib/src/main/java/com/github/mikephil/charting/highlight/Range.java b/MPChartLib/src/main/java/com/github/mikephil/charting/highlight/Range.java new file mode 100644 index 00000000..96dd592b --- /dev/null +++ b/MPChartLib/src/main/java/com/github/mikephil/charting/highlight/Range.java @@ -0,0 +1,38 @@ +package com.github.mikephil.charting.highlight; + +/** + * Created by Philipp Jahoda on 24/07/15. Class that represents the range of one value in a stacked bar entry. e.g. + * stack values are -10, 5, 20 -> then ranges are (-10 - 0, 0 - 5, 5 - 25). + */ +public final class Range { + + public float from; + public float to; + + public Range(float from, float to) { + this.from = from; + this.to = to; + } + + /** + * Returns true if this range contains (if the value is in between) the given value, false if not. + * + * @param value + * @return + */ + public boolean contains(float value) { + + if (value > from && value <= to) + return true; + else + return false; + } + + public boolean isLarger(float value) { + return value > to; + } + + public boolean isSmaller(float value) { + return value < from; + } +}
\ No newline at end of file diff --git a/MPChartLib/src/main/java/com/github/mikephil/charting/interfaces/dataprovider/BarDataProvider.java b/MPChartLib/src/main/java/com/github/mikephil/charting/interfaces/dataprovider/BarDataProvider.java new file mode 100644 index 00000000..9dfee07f --- /dev/null +++ b/MPChartLib/src/main/java/com/github/mikephil/charting/interfaces/dataprovider/BarDataProvider.java @@ -0,0 +1,11 @@ +package com.github.mikephil.charting.interfaces.dataprovider; + +import com.github.mikephil.charting.data.BarData; + +public interface BarDataProvider extends BarLineScatterCandleBubbleDataProvider { + + BarData getBarData(); + boolean isDrawBarShadowEnabled(); + boolean isDrawValueAboveBarEnabled(); + boolean isHighlightFullBarEnabled(); +} diff --git a/MPChartLib/src/main/java/com/github/mikephil/charting/interfaces/dataprovider/BarLineScatterCandleBubbleDataProvider.java b/MPChartLib/src/main/java/com/github/mikephil/charting/interfaces/dataprovider/BarLineScatterCandleBubbleDataProvider.java new file mode 100644 index 00000000..68beeb8d --- /dev/null +++ b/MPChartLib/src/main/java/com/github/mikephil/charting/interfaces/dataprovider/BarLineScatterCandleBubbleDataProvider.java @@ -0,0 +1,16 @@ +package com.github.mikephil.charting.interfaces.dataprovider; + +import com.github.mikephil.charting.components.YAxis.AxisDependency; +import com.github.mikephil.charting.data.BarLineScatterCandleBubbleData; +import com.github.mikephil.charting.utils.Transformer; + +public interface BarLineScatterCandleBubbleDataProvider extends ChartInterface { + + Transformer getTransformer(AxisDependency axis); + boolean isInverted(AxisDependency axis); + + float getLowestVisibleX(); + float getHighestVisibleX(); + + BarLineScatterCandleBubbleData getData(); +} diff --git a/MPChartLib/src/main/java/com/github/mikephil/charting/interfaces/dataprovider/BubbleDataProvider.java b/MPChartLib/src/main/java/com/github/mikephil/charting/interfaces/dataprovider/BubbleDataProvider.java new file mode 100644 index 00000000..82ee30ad --- /dev/null +++ b/MPChartLib/src/main/java/com/github/mikephil/charting/interfaces/dataprovider/BubbleDataProvider.java @@ -0,0 +1,8 @@ +package com.github.mikephil.charting.interfaces.dataprovider; + +import com.github.mikephil.charting.data.BubbleData; + +public interface BubbleDataProvider extends BarLineScatterCandleBubbleDataProvider { + + BubbleData getBubbleData(); +} diff --git a/MPChartLib/src/main/java/com/github/mikephil/charting/interfaces/dataprovider/CandleDataProvider.java b/MPChartLib/src/main/java/com/github/mikephil/charting/interfaces/dataprovider/CandleDataProvider.java new file mode 100644 index 00000000..357403f9 --- /dev/null +++ b/MPChartLib/src/main/java/com/github/mikephil/charting/interfaces/dataprovider/CandleDataProvider.java @@ -0,0 +1,8 @@ +package com.github.mikephil.charting.interfaces.dataprovider; + +import com.github.mikephil.charting.data.CandleData; + +public interface CandleDataProvider extends BarLineScatterCandleBubbleDataProvider { + + CandleData getCandleData(); +} diff --git a/MPChartLib/src/main/java/com/github/mikephil/charting/interfaces/dataprovider/ChartInterface.java b/MPChartLib/src/main/java/com/github/mikephil/charting/interfaces/dataprovider/ChartInterface.java new file mode 100644 index 00000000..219b46bd --- /dev/null +++ b/MPChartLib/src/main/java/com/github/mikephil/charting/interfaces/dataprovider/ChartInterface.java @@ -0,0 +1,69 @@ +package com.github.mikephil.charting.interfaces.dataprovider; + +import android.graphics.RectF; + +import com.github.mikephil.charting.data.ChartData; +import com.github.mikephil.charting.formatter.IValueFormatter; +import com.github.mikephil.charting.utils.MPPointF; + +/** + * Interface that provides everything there is to know about the dimensions, + * bounds, and range of the chart. + * + * @author Philipp Jahoda + */ +public interface ChartInterface { + + /** + * Returns the minimum x value of the chart, regardless of zoom or translation. + * + * @return + */ + float getXChartMin(); + + /** + * Returns the maximum x value of the chart, regardless of zoom or translation. + * + * @return + */ + float getXChartMax(); + + float getXRange(); + + /** + * Returns the minimum y value of the chart, regardless of zoom or translation. + * + * @return + */ + float getYChartMin(); + + /** + * Returns the maximum y value of the chart, regardless of zoom or translation. + * + * @return + */ + float getYChartMax(); + + /** + * Returns the maximum distance in scren dp a touch can be away from an entry to cause it to get highlighted. + * + * @return + */ + float getMaxHighlightDistance(); + + int getWidth(); + + int getHeight(); + + MPPointF getCenterOfView(); + + MPPointF getCenterOffsets(); + + RectF getContentRect(); + + IValueFormatter getDefaultValueFormatter(); + + ChartData getData(); + + int getMaxVisibleCount(); +} diff --git a/MPChartLib/src/main/java/com/github/mikephil/charting/interfaces/dataprovider/CombinedDataProvider.java b/MPChartLib/src/main/java/com/github/mikephil/charting/interfaces/dataprovider/CombinedDataProvider.java new file mode 100644 index 00000000..574d26a2 --- /dev/null +++ b/MPChartLib/src/main/java/com/github/mikephil/charting/interfaces/dataprovider/CombinedDataProvider.java @@ -0,0 +1,11 @@ +package com.github.mikephil.charting.interfaces.dataprovider; + +import com.github.mikephil.charting.data.CombinedData; + +/** + * Created by philipp on 11/06/16. + */ +public interface CombinedDataProvider extends LineDataProvider, BarDataProvider, BubbleDataProvider, CandleDataProvider, ScatterDataProvider { + + CombinedData getCombinedData(); +} diff --git a/MPChartLib/src/main/java/com/github/mikephil/charting/interfaces/dataprovider/LineDataProvider.java b/MPChartLib/src/main/java/com/github/mikephil/charting/interfaces/dataprovider/LineDataProvider.java new file mode 100644 index 00000000..5c23ac27 --- /dev/null +++ b/MPChartLib/src/main/java/com/github/mikephil/charting/interfaces/dataprovider/LineDataProvider.java @@ -0,0 +1,11 @@ +package com.github.mikephil.charting.interfaces.dataprovider; + +import com.github.mikephil.charting.components.YAxis; +import com.github.mikephil.charting.data.LineData; + +public interface LineDataProvider extends BarLineScatterCandleBubbleDataProvider { + + LineData getLineData(); + + YAxis getAxis(YAxis.AxisDependency dependency); +} diff --git a/MPChartLib/src/main/java/com/github/mikephil/charting/interfaces/dataprovider/ScatterDataProvider.java b/MPChartLib/src/main/java/com/github/mikephil/charting/interfaces/dataprovider/ScatterDataProvider.java new file mode 100644 index 00000000..b58d5af9 --- /dev/null +++ b/MPChartLib/src/main/java/com/github/mikephil/charting/interfaces/dataprovider/ScatterDataProvider.java @@ -0,0 +1,8 @@ +package com.github.mikephil.charting.interfaces.dataprovider; + +import com.github.mikephil.charting.data.ScatterData; + +public interface ScatterDataProvider extends BarLineScatterCandleBubbleDataProvider { + + ScatterData getScatterData(); +} diff --git a/MPChartLib/src/main/java/com/github/mikephil/charting/interfaces/datasets/IBarDataSet.java b/MPChartLib/src/main/java/com/github/mikephil/charting/interfaces/datasets/IBarDataSet.java new file mode 100644 index 00000000..5e82a484 --- /dev/null +++ b/MPChartLib/src/main/java/com/github/mikephil/charting/interfaces/datasets/IBarDataSet.java @@ -0,0 +1,71 @@ +package com.github.mikephil.charting.interfaces.datasets; + +import com.github.mikephil.charting.data.BarEntry; +import com.github.mikephil.charting.utils.Fill; + +import java.util.List; + +/** + * Created by philipp on 21/10/15. + */ +public interface IBarDataSet extends IBarLineScatterCandleBubbleDataSet<BarEntry> { + + List<Fill> getFills(); + + Fill getFill(int index); + + /** + * Returns true if this DataSet is stacked (stacksize > 1) or not. + * + * @return + */ + boolean isStacked(); + + /** + * Returns the maximum number of bars that can be stacked upon another in + * this DataSet. This should return 1 for non stacked bars, and > 1 for stacked bars. + * + * @return + */ + int getStackSize(); + + /** + * Returns the color used for drawing the bar-shadows. The bar shadows is a + * surface behind the bar that indicates the maximum value. + * + * @return + */ + int getBarShadowColor(); + + /** + * Returns the width used for drawing borders around the bars. + * If borderWidth == 0, no border will be drawn. + * + * @return + */ + float getBarBorderWidth(); + + /** + * Returns the color drawing borders around the bars. + * + * @return + */ + int getBarBorderColor(); + + /** + * Returns the alpha value (transparency) that is used for drawing the + * highlight indicator. + * + * @return + */ + int getHighLightAlpha(); + + + /** + * Returns the labels used for the different value-stacks in the legend. + * This is only relevant for stacked bar entries. + * + * @return + */ + String[] getStackLabels(); +} diff --git a/MPChartLib/src/main/java/com/github/mikephil/charting/interfaces/datasets/IBarLineScatterCandleBubbleDataSet.java b/MPChartLib/src/main/java/com/github/mikephil/charting/interfaces/datasets/IBarLineScatterCandleBubbleDataSet.java new file mode 100644 index 00000000..0f9454b2 --- /dev/null +++ b/MPChartLib/src/main/java/com/github/mikephil/charting/interfaces/datasets/IBarLineScatterCandleBubbleDataSet.java @@ -0,0 +1,16 @@ +package com.github.mikephil.charting.interfaces.datasets; + +import com.github.mikephil.charting.data.Entry; + +/** + * Created by philipp on 21/10/15. + */ +public interface IBarLineScatterCandleBubbleDataSet<T extends Entry> extends IDataSet<T> { + + /** + * Returns the color that is used for drawing the highlight indicators. + * + * @return + */ + int getHighLightColor(); +} diff --git a/MPChartLib/src/main/java/com/github/mikephil/charting/interfaces/datasets/IBubbleDataSet.java b/MPChartLib/src/main/java/com/github/mikephil/charting/interfaces/datasets/IBubbleDataSet.java new file mode 100644 index 00000000..e284aac2 --- /dev/null +++ b/MPChartLib/src/main/java/com/github/mikephil/charting/interfaces/datasets/IBubbleDataSet.java @@ -0,0 +1,27 @@ +package com.github.mikephil.charting.interfaces.datasets; + +import com.github.mikephil.charting.data.BubbleEntry; + +/** + * Created by philipp on 21/10/15. + */ +public interface IBubbleDataSet extends IBarLineScatterCandleBubbleDataSet<BubbleEntry> { + + /** + * Sets the width of the circle that surrounds the bubble when highlighted, + * in dp. + * + * @param width + */ + void setHighlightCircleWidth(float width); + + float getMaxSize(); + + boolean isNormalizeSizeEnabled(); + + /** + * Returns the width of the highlight-circle that surrounds the bubble + * @return + */ + float getHighlightCircleWidth(); +} diff --git a/MPChartLib/src/main/java/com/github/mikephil/charting/interfaces/datasets/ICandleDataSet.java b/MPChartLib/src/main/java/com/github/mikephil/charting/interfaces/datasets/ICandleDataSet.java new file mode 100644 index 00000000..1d004ed9 --- /dev/null +++ b/MPChartLib/src/main/java/com/github/mikephil/charting/interfaces/datasets/ICandleDataSet.java @@ -0,0 +1,85 @@ +package com.github.mikephil.charting.interfaces.datasets; + +import android.graphics.Paint; + +import com.github.mikephil.charting.data.CandleEntry; + +/** + * Created by philipp on 21/10/15. + */ +public interface ICandleDataSet extends ILineScatterCandleRadarDataSet<CandleEntry> { + + /** + * Returns the space that is left out on the left and right side of each + * candle. + * + * @return + */ + float getBarSpace(); + + /** + * Returns whether the candle bars should show? + * When false, only "ticks" will show + * + * - default: true + * + * @return + */ + boolean getShowCandleBar(); + + /** + * Returns the width of the candle-shadow-line in pixels. + * + * @return + */ + float getShadowWidth(); + + /** + * Returns shadow color for all entries + * + * @return + */ + int getShadowColor(); + + /** + * Returns the neutral color (for open == close) + * + * @return + */ + int getNeutralColor(); + + /** + * Returns the increasing color (for open < close). + * + * @return + */ + int getIncreasingColor(); + + /** + * Returns the decreasing color (for open > close). + * + * @return + */ + int getDecreasingColor(); + + /** + * Returns paint style when open < close + * + * @return + */ + Paint.Style getIncreasingPaintStyle(); + + /** + * Returns paint style when open > close + * + * @return + */ + Paint.Style getDecreasingPaintStyle(); + + /** + * Is the shadow color same as the candle color? + * + * @return + */ + boolean getShadowColorSameAsCandle(); +} diff --git a/MPChartLib/src/main/java/com/github/mikephil/charting/interfaces/datasets/IDataSet.java b/MPChartLib/src/main/java/com/github/mikephil/charting/interfaces/datasets/IDataSet.java new file mode 100644 index 00000000..fd8af706 --- /dev/null +++ b/MPChartLib/src/main/java/com/github/mikephil/charting/interfaces/datasets/IDataSet.java @@ -0,0 +1,486 @@ +package com.github.mikephil.charting.interfaces.datasets; + +import android.graphics.DashPathEffect; +import android.graphics.PointF; +import android.graphics.Typeface; + +import com.github.mikephil.charting.components.Legend; +import com.github.mikephil.charting.components.YAxis; +import com.github.mikephil.charting.data.DataSet; +import com.github.mikephil.charting.data.Entry; +import com.github.mikephil.charting.formatter.IValueFormatter; +import com.github.mikephil.charting.utils.MPPointF; + +import java.util.List; + +/** + * Created by Philipp Jahoda on 21/10/15. + */ +public interface IDataSet<T extends Entry> { + + /** ###### ###### DATA RELATED METHODS ###### ###### */ + + /** + * returns the minimum y-value this DataSet holds + * + * @return + */ + float getYMin(); + + /** + * returns the maximum y-value this DataSet holds + * + * @return + */ + float getYMax(); + + /** + * returns the minimum x-value this DataSet holds + * + * @return + */ + float getXMin(); + + /** + * returns the maximum x-value this DataSet holds + * + * @return + */ + float getXMax(); + + /** + * Returns the number of y-values this DataSet represents -> the size of the y-values array + * -> yvals.size() + * + * @return + */ + int getEntryCount(); + + /** + * Calculates the minimum and maximum x and y values (mXMin, mXMax, mYMin, mYMax). + */ + void calcMinMax(); + + /** + * Calculates the min and max y-values from the Entry closest to the given fromX to the Entry closest to the given toX value. + * This is only needed for the autoScaleMinMax feature. + * + * @param fromX + * @param toX + */ + void calcMinMaxY(float fromX, float toX); + + /** + * Returns the first Entry object found at the given x-value with binary + * search. + * If the no Entry at the specified x-value is found, this method + * returns the Entry at the closest x-value according to the rounding. + * INFORMATION: This method does calculations at runtime. Do + * not over-use in performance critical situations. + * + * @param xValue the x-value + * @param closestToY If there are multiple y-values for the specified x-value, + * @param rounding determine whether to round up/down/closest + * if there is no Entry matching the provided x-value + * @return + * + * + */ + T getEntryForXValue(float xValue, float closestToY, DataSet.Rounding rounding); + + /** + * Returns the first Entry object found at the given x-value with binary + * search. + * If the no Entry at the specified x-value is found, this method + * returns the Entry at the closest x-value. + * INFORMATION: This method does calculations at runtime. Do + * not over-use in performance critical situations. + * + * + * @param xValue the x-value + * @param closestToY If there are multiple y-values for the specified x-value, + * @return + */ + T getEntryForXValue(float xValue, float closestToY); + + /** + * Returns all Entry objects found at the given x-value with binary + * search. An empty array if no Entry object at that x-value. + * INFORMATION: This method does calculations at runtime. Do + * not over-use in performance critical situations. + * + * @param xValue + * @return + */ + List<T> getEntriesForXValue(float xValue); + + /** + * Returns the Entry object found at the given index (NOT xIndex) in the values array. + * + * @param index + * @return + */ + T getEntryForIndex(int index); + + /** + * Returns the first Entry index found at the given x-value with binary + * search. + * If the no Entry at the specified x-value is found, this method + * returns the Entry at the closest x-value according to the rounding. + * INFORMATION: This method does calculations at runtime. Do + * not over-use in performance critical situations. + * + * @param xValue the x-value + * @param closestToY If there are multiple y-values for the specified x-value, + * @param rounding determine whether to round up/down/closest + * if there is no Entry matching the provided x-value + * @return + */ + int getEntryIndex(float xValue, float closestToY, DataSet.Rounding rounding); + + /** + * Returns the position of the provided entry in the DataSets Entry array. + * Returns -1 if doesn't exist. + * + * @param e + * @return + */ + int getEntryIndex(T e); + + + /** + * This method returns the actual + * index in the Entry array of the DataSet for a given xIndex. IMPORTANT: This method does + * calculations at runtime, do not over-use in performance critical + * situations. + * + * @param xIndex + * @return + */ + int getIndexInEntries(int xIndex); + + /** + * Adds an Entry to the DataSet dynamically. + * Entries are added to the end of the list. + * This will also recalculate the current minimum and maximum + * values of the DataSet and the value-sum. + * + * @param e + */ + boolean addEntry(T e); + + + /** + * Adds an Entry to the DataSet dynamically. + * Entries are added to their appropriate index in the values array respective to their x-position. + * This will also recalculate the current minimum and maximum + * values of the DataSet and the value-sum. + * + * @param e + */ + void addEntryOrdered(T e); + + /** + * Removes the first Entry (at index 0) of this DataSet from the entries array. + * Returns true if successful, false if not. + * + * @return + */ + boolean removeFirst(); + + /** + * Removes the last Entry (at index size-1) of this DataSet from the entries array. + * Returns true if successful, false if not. + * + * @return + */ + boolean removeLast(); + + /** + * Removes an Entry from the DataSets entries array. This will also + * recalculate the current minimum and maximum values of the DataSet and the + * value-sum. Returns true if an Entry was removed, false if no Entry could + * be removed. + * + * @param e + */ + boolean removeEntry(T e); + + /** + * Removes the Entry object closest to the given x-value from the DataSet. + * Returns true if an Entry was removed, false if no Entry could be removed. + * + * @param xValue + */ + boolean removeEntryByXValue(float xValue); + + /** + * Removes the Entry object at the given index in the values array from the DataSet. + * Returns true if an Entry was removed, false if no Entry could be removed. + * + * @param index + * @return + */ + boolean removeEntry(int index); + + /** + * Checks if this DataSet contains the specified Entry. Returns true if so, + * false if not. NOTE: Performance is pretty bad on this one, do not + * over-use in performance critical situations. + * + * @param entry + * @return + */ + boolean contains(T entry); + + /** + * Removes all values from this DataSet and does all necessary recalculations. + */ + void clear(); + + + /** ###### ###### STYLING RELATED (& OTHER) METHODS ###### ###### */ + + /** + * Returns the label string that describes the DataSet. + * + * @return + */ + String getLabel(); + + /** + * Sets the label string that describes the DataSet. + * + * @param label + */ + void setLabel(String label); + + /** + * Returns the axis this DataSet should be plotted against. + * + * @return + */ + YAxis.AxisDependency getAxisDependency(); + + /** + * Set the y-axis this DataSet should be plotted against (either LEFT or + * RIGHT). Default: LEFT + * + * @param dependency + */ + void setAxisDependency(YAxis.AxisDependency dependency); + + /** + * returns all the colors that are set for this DataSet + * + * @return + */ + List<Integer> getColors(); + + /** + * Returns the first color (index 0) of the colors-array this DataSet + * contains. This is only used for performance reasons when only one color is in the colors array (size == 1) + * + * @return + */ + int getColor(); + + /** + * Returns the color at the given index of the DataSet's color array. + * Performs a IndexOutOfBounds check by modulus. + * + * @param index + * @return + */ + int getColor(int index); + + /** + * returns true if highlighting of values is enabled, false if not + * + * @return + */ + boolean isHighlightEnabled(); + + /** + * If set to true, value highlighting is enabled which means that values can + * be highlighted programmatically or by touch gesture. + * + * @param enabled + */ + void setHighlightEnabled(boolean enabled); + + /** + * Sets the formatter to be used for drawing the values inside the chart. If + * no formatter is set, the chart will automatically determine a reasonable + * formatting (concerning decimals) for all the values that are drawn inside + * the chart. Use chart.getDefaultValueFormatter() to use the formatter + * calculated by the chart. + * + * @param f + */ + void setValueFormatter(IValueFormatter f); + + /** + * Returns the formatter used for drawing the values inside the chart. + * + * @return + */ + IValueFormatter getValueFormatter(); + + /** + * Returns true if the valueFormatter object of this DataSet is null. + * + * @return + */ + boolean needsFormatter(); + + /** + * Sets the color the value-labels of this DataSet should have. + * + * @param color + */ + void setValueTextColor(int color); + + /** + * Sets a list of colors to be used as the colors for the drawn values. + * + * @param colors + */ + void setValueTextColors(List<Integer> colors); + + /** + * Sets a Typeface for the value-labels of this DataSet. + * + * @param tf + */ + void setValueTypeface(Typeface tf); + + /** + * Sets the text-size of the value-labels of this DataSet in dp. + * + * @param size + */ + void setValueTextSize(float size); + + /** + * Returns only the first color of all colors that are set to be used for the values. + * + * @return + */ + int getValueTextColor(); + + /** + * Returns the color at the specified index that is used for drawing the values inside the chart. + * Uses modulus internally. + * + * @param index + * @return + */ + int getValueTextColor(int index); + + /** + * Returns the typeface that is used for drawing the values inside the chart + * + * @return + */ + Typeface getValueTypeface(); + + /** + * Returns the text size that is used for drawing the values inside the chart + * + * @return + */ + float getValueTextSize(); + + /** + * The form to draw for this dataset in the legend. + * <p/> + * Return `DEFAULT` to use the default legend form. + */ + Legend.LegendForm getForm(); + + /** + * The form size to draw for this dataset in the legend. + * <p/> + * Return `Float.NaN` to use the default legend form size. + */ + float getFormSize(); + + /** + * The line width for drawing the form of this dataset in the legend + * <p/> + * Return `Float.NaN` to use the default legend form line width. + */ + float getFormLineWidth(); + + /** + * The line dash path effect used for shapes that consist of lines. + * <p/> + * Return `null` to use the default legend form line dash effect. + */ + DashPathEffect getFormLineDashEffect(); + + /** + * set this to true to draw y-values on the chart. + * + * NOTE (for bar and line charts): if `maxVisibleCount` is reached, no values will be drawn even + * if this is enabled + * @param enabled + */ + void setDrawValues(boolean enabled); + + /** + * Returns true if y-value drawing is enabled, false if not + * + * @return + */ + boolean isDrawValuesEnabled(); + + /** + * Set this to true to draw y-icons on the chart. + * + * NOTE (for bar and line charts): if `maxVisibleCount` is reached, no icons will be drawn even + * if this is enabled + * + * @param enabled + */ + void setDrawIcons(boolean enabled); + + /** + * Returns true if y-icon drawing is enabled, false if not + * + * @return + */ + boolean isDrawIconsEnabled(); + + /** + * Offset of icons drawn on the chart. + * + * For all charts except Pie and Radar it will be ordinary (x offset,y offset). + * + * For Pie and Radar chart it will be (y offset, distance from center offset); so if you want icon to be rendered under value, you should increase X component of CGPoint, and if you want icon to be rendered closet to center, you should decrease height component of CGPoint. + * @param offset + */ + void setIconsOffset(MPPointF offset); + + /** + * Get the offset for drawing icons. + */ + MPPointF getIconsOffset(); + + /** + * Set the visibility of this DataSet. If not visible, the DataSet will not + * be drawn to the chart upon refreshing it. + * + * @param visible + */ + void setVisible(boolean visible); + + /** + * Returns true if this DataSet is visible inside the chart, or false if it + * is currently hidden. + * + * @return + */ + boolean isVisible(); +} diff --git a/MPChartLib/src/main/java/com/github/mikephil/charting/interfaces/datasets/ILineDataSet.java b/MPChartLib/src/main/java/com/github/mikephil/charting/interfaces/datasets/ILineDataSet.java new file mode 100644 index 00000000..3f534fe8 --- /dev/null +++ b/MPChartLib/src/main/java/com/github/mikephil/charting/interfaces/datasets/ILineDataSet.java @@ -0,0 +1,103 @@ +package com.github.mikephil.charting.interfaces.datasets; + +import android.graphics.DashPathEffect; + +import com.github.mikephil.charting.data.Entry; +import com.github.mikephil.charting.data.LineDataSet; +import com.github.mikephil.charting.formatter.IFillFormatter; + +/** + * Created by Philpp Jahoda on 21/10/15. + */ +public interface ILineDataSet extends ILineRadarDataSet<Entry> { + + /** + * Returns the drawing mode for this line dataset + * + * @return + */ + LineDataSet.Mode getMode(); + + /** + * Returns the intensity of the cubic lines (the effect intensity). + * Max = 1f = very cubic, Min = 0.05f = low cubic effect, Default: 0.2f + * + * @return + */ + float getCubicIntensity(); + + @Deprecated + boolean isDrawCubicEnabled(); + + @Deprecated + boolean isDrawSteppedEnabled(); + + /** + * Returns the size of the drawn circles. + */ + float getCircleRadius(); + + /** + * Returns the hole radius of the drawn circles. + */ + float getCircleHoleRadius(); + + /** + * Returns the color at the given index of the DataSet's circle-color array. + * Performs a IndexOutOfBounds check by modulus. + * + * @param index + * @return + */ + int getCircleColor(int index); + + /** + * Returns the number of colors in this DataSet's circle-color array. + * + * @return + */ + int getCircleColorCount(); + + /** + * Returns true if drawing circles for this DataSet is enabled, false if not + * + * @return + */ + boolean isDrawCirclesEnabled(); + + /** + * Returns the color of the inner circle (the circle-hole). + * + * @return + */ + int getCircleHoleColor(); + + /** + * Returns true if drawing the circle-holes is enabled, false if not. + * + * @return + */ + boolean isDrawCircleHoleEnabled(); + + /** + * Returns the DashPathEffect that is used for drawing the lines. + * + * @return + */ + DashPathEffect getDashPathEffect(); + + /** + * Returns true if the dashed-line effect is enabled, false if not. + * If the DashPathEffect object is null, also return false here. + * + * @return + */ + boolean isDashedLineEnabled(); + + /** + * Returns the IFillFormatter that is set for this DataSet. + * + * @return + */ + IFillFormatter getFillFormatter(); +}
\ No newline at end of file diff --git a/MPChartLib/src/main/java/com/github/mikephil/charting/interfaces/datasets/ILineRadarDataSet.java b/MPChartLib/src/main/java/com/github/mikephil/charting/interfaces/datasets/ILineRadarDataSet.java new file mode 100644 index 00000000..ce898227 --- /dev/null +++ b/MPChartLib/src/main/java/com/github/mikephil/charting/interfaces/datasets/ILineRadarDataSet.java @@ -0,0 +1,58 @@ +package com.github.mikephil.charting.interfaces.datasets; + +import android.graphics.drawable.Drawable; + +import com.github.mikephil.charting.data.Entry; + +/** + * Created by Philipp Jahoda on 21/10/15. + */ +public interface ILineRadarDataSet<T extends Entry> extends ILineScatterCandleRadarDataSet<T> { + + /** + * Returns the color that is used for filling the line surface area. + * + * @return + */ + int getFillColor(); + + /** + * Returns the drawable used for filling the area below the line. + * + * @return + */ + Drawable getFillDrawable(); + + /** + * Returns the alpha value that is used for filling the line surface, + * default: 85 + * + * @return + */ + int getFillAlpha(); + + /** + * Returns the stroke-width of the drawn line + * + * @return + */ + float getLineWidth(); + + /** + * Returns true if filled drawing is enabled, false if not + * + * @return + */ + boolean isDrawFilledEnabled(); + + /** + * Set to true if the DataSet should be drawn filled (surface), and not just + * as a line, disabling this will give great performance boost. Please note that this method + * uses the canvas.clipPath(...) method for drawing the filled area. + * For devices with API level < 18 (Android 4.3), hardware acceleration of the chart should + * be turned off. Default: false + * + * @param enabled + */ + void setDrawFilled(boolean enabled); +} diff --git a/MPChartLib/src/main/java/com/github/mikephil/charting/interfaces/datasets/ILineScatterCandleRadarDataSet.java b/MPChartLib/src/main/java/com/github/mikephil/charting/interfaces/datasets/ILineScatterCandleRadarDataSet.java new file mode 100644 index 00000000..9ab68025 --- /dev/null +++ b/MPChartLib/src/main/java/com/github/mikephil/charting/interfaces/datasets/ILineScatterCandleRadarDataSet.java @@ -0,0 +1,35 @@ +package com.github.mikephil.charting.interfaces.datasets; + +import android.graphics.DashPathEffect; + +import com.github.mikephil.charting.data.Entry; + +/** + * Created by Philipp Jahoda on 21/10/15. + */ +public interface ILineScatterCandleRadarDataSet<T extends Entry> extends IBarLineScatterCandleBubbleDataSet<T> { + + /** + * Returns true if vertical highlight indicator lines are enabled (drawn) + * @return + */ + boolean isVerticalHighlightIndicatorEnabled(); + + /** + * Returns true if vertical highlight indicator lines are enabled (drawn) + * @return + */ + boolean isHorizontalHighlightIndicatorEnabled(); + + /** + * Returns the line-width in which highlight lines are to be drawn. + * @return + */ + float getHighlightLineWidth(); + + /** + * Returns the DashPathEffect that is used for highlighting. + * @return + */ + DashPathEffect getDashPathEffectHighlight(); +} diff --git a/MPChartLib/src/main/java/com/github/mikephil/charting/interfaces/datasets/IPieDataSet.java b/MPChartLib/src/main/java/com/github/mikephil/charting/interfaces/datasets/IPieDataSet.java new file mode 100644 index 00000000..b228fca0 --- /dev/null +++ b/MPChartLib/src/main/java/com/github/mikephil/charting/interfaces/datasets/IPieDataSet.java @@ -0,0 +1,82 @@ +package com.github.mikephil.charting.interfaces.datasets; + +import androidx.annotation.Nullable; + +import com.github.mikephil.charting.data.PieDataSet; +import com.github.mikephil.charting.data.PieEntry; + +/** + * Created by Philipp Jahoda on 03/11/15. + */ +public interface IPieDataSet extends IDataSet<PieEntry> { + + /** + * Returns the space that is set to be between the piechart-slices of this + * DataSet, in pixels. + * + * @return + */ + float getSliceSpace(); + + /** + * When enabled, slice spacing will be 0.0 when the smallest value is going to be + * smaller than the slice spacing itself. + * + * @return + */ + boolean isAutomaticallyDisableSliceSpacingEnabled(); + + /** + * Returns the distance a highlighted piechart slice is "shifted" away from + * the chart-center in dp. + * + * @return + */ + float getSelectionShift(); + + PieDataSet.ValuePosition getXValuePosition(); + PieDataSet.ValuePosition getYValuePosition(); + + /** + * When valuePosition is OutsideSlice, indicates line color + * */ + int getValueLineColor(); + + /** + * When valuePosition is OutsideSlice and enabled, line will have the same color as the slice + * */ + boolean isUseValueColorForLineEnabled(); + + /** + * When valuePosition is OutsideSlice, indicates line width + * */ + float getValueLineWidth(); + + /** + * When valuePosition is OutsideSlice, indicates offset as percentage out of the slice size + * */ + float getValueLinePart1OffsetPercentage(); + + /** + * When valuePosition is OutsideSlice, indicates length of first half of the line + * */ + float getValueLinePart1Length(); + + /** + * When valuePosition is OutsideSlice, indicates length of second half of the line + * */ + float getValueLinePart2Length(); + + /** + * When valuePosition is OutsideSlice, this allows variable line length + * */ + boolean isValueLineVariableLength(); + + /** + * Gets the color for the highlighted sector + * */ + @Nullable + Integer getHighlightColor(); + +} + diff --git a/MPChartLib/src/main/java/com/github/mikephil/charting/interfaces/datasets/IRadarDataSet.java b/MPChartLib/src/main/java/com/github/mikephil/charting/interfaces/datasets/IRadarDataSet.java new file mode 100644 index 00000000..8af00d53 --- /dev/null +++ b/MPChartLib/src/main/java/com/github/mikephil/charting/interfaces/datasets/IRadarDataSet.java @@ -0,0 +1,30 @@ +package com.github.mikephil.charting.interfaces.datasets; + +import com.github.mikephil.charting.data.RadarEntry; + +/** + * Created by Philipp Jahoda on 03/11/15. + */ +public interface IRadarDataSet extends ILineRadarDataSet<RadarEntry> { + + /// flag indicating whether highlight circle should be drawn or not + boolean isDrawHighlightCircleEnabled(); + + /// Sets whether highlight circle should be drawn or not + void setDrawHighlightCircleEnabled(boolean enabled); + + int getHighlightCircleFillColor(); + + /// The stroke color for highlight circle. + /// If Utils.COLOR_NONE, the color of the dataset is taken. + int getHighlightCircleStrokeColor(); + + int getHighlightCircleStrokeAlpha(); + + float getHighlightCircleInnerRadius(); + + float getHighlightCircleOuterRadius(); + + float getHighlightCircleStrokeWidth(); + +} diff --git a/MPChartLib/src/main/java/com/github/mikephil/charting/interfaces/datasets/IScatterDataSet.java b/MPChartLib/src/main/java/com/github/mikephil/charting/interfaces/datasets/IScatterDataSet.java new file mode 100644 index 00000000..ac612274 --- /dev/null +++ b/MPChartLib/src/main/java/com/github/mikephil/charting/interfaces/datasets/IScatterDataSet.java @@ -0,0 +1,38 @@ +package com.github.mikephil.charting.interfaces.datasets; + +import com.github.mikephil.charting.data.Entry; +import com.github.mikephil.charting.renderer.scatter.IShapeRenderer; + +/** + * Created by philipp on 21/10/15. + */ +public interface IScatterDataSet extends ILineScatterCandleRadarDataSet<Entry> { + + /** + * Returns the currently set scatter shape size + * + * @return + */ + float getScatterShapeSize(); + + /** + * Returns radius of the hole in the shape + * + * @return + */ + float getScatterShapeHoleRadius(); + + /** + * Returns the color for the hole in the shape + * + * @return + */ + int getScatterShapeHoleColor(); + + /** + * Returns the IShapeRenderer responsible for rendering this DataSet. + * + * @return + */ + IShapeRenderer getShapeRenderer(); +} diff --git a/MPChartLib/src/main/java/com/github/mikephil/charting/jobs/AnimatedMoveViewJob.java b/MPChartLib/src/main/java/com/github/mikephil/charting/jobs/AnimatedMoveViewJob.java new file mode 100644 index 00000000..8f953a06 --- /dev/null +++ b/MPChartLib/src/main/java/com/github/mikephil/charting/jobs/AnimatedMoveViewJob.java @@ -0,0 +1,65 @@ +package com.github.mikephil.charting.jobs; + +import android.animation.ValueAnimator; +import android.annotation.SuppressLint; +import android.view.View; + +import com.github.mikephil.charting.utils.ObjectPool; +import com.github.mikephil.charting.utils.Transformer; +import com.github.mikephil.charting.utils.ViewPortHandler; + +/** + * Created by Philipp Jahoda on 19/02/16. + */ +@SuppressLint("NewApi") +public class AnimatedMoveViewJob extends AnimatedViewPortJob { + + private static ObjectPool<AnimatedMoveViewJob> pool; + + static { + pool = ObjectPool.create(4, new AnimatedMoveViewJob(null,0,0,null,null,0,0,0)); + pool.setReplenishPercentage(0.5f); + } + + public static AnimatedMoveViewJob getInstance(ViewPortHandler viewPortHandler, float xValue, float yValue, Transformer trans, View v, float xOrigin, float yOrigin, long duration){ + AnimatedMoveViewJob result = pool.get(); + result.mViewPortHandler = viewPortHandler; + result.xValue = xValue; + result.yValue = yValue; + result.mTrans = trans; + result.view = v; + result.xOrigin = xOrigin; + result.yOrigin = yOrigin; + //result.resetAnimator(); + result.animator.setDuration(duration); + return result; + } + + public static void recycleInstance(AnimatedMoveViewJob instance){ + pool.recycle(instance); + } + + + public AnimatedMoveViewJob(ViewPortHandler viewPortHandler, float xValue, float yValue, Transformer trans, View v, float xOrigin, float yOrigin, long duration) { + super(viewPortHandler, xValue, yValue, trans, v, xOrigin, yOrigin, duration); + } + + @Override + public void onAnimationUpdate(ValueAnimator animation) { + + pts[0] = xOrigin + (xValue - xOrigin) * phase; + pts[1] = yOrigin + (yValue - yOrigin) * phase; + + mTrans.pointValuesToPixel(pts); + mViewPortHandler.centerViewPort(pts, view); + } + + public void recycleSelf(){ + recycleInstance(this); + } + + @Override + protected ObjectPool.Poolable instantiate() { + return new AnimatedMoveViewJob(null,0,0,null,null,0,0,0); + } +} diff --git a/MPChartLib/src/main/java/com/github/mikephil/charting/jobs/AnimatedViewPortJob.java b/MPChartLib/src/main/java/com/github/mikephil/charting/jobs/AnimatedViewPortJob.java new file mode 100644 index 00000000..f8b520a4 --- /dev/null +++ b/MPChartLib/src/main/java/com/github/mikephil/charting/jobs/AnimatedViewPortJob.java @@ -0,0 +1,99 @@ +package com.github.mikephil.charting.jobs; + +import android.animation.Animator; +import android.animation.ObjectAnimator; +import android.animation.ValueAnimator; +import android.annotation.SuppressLint; +import android.view.View; + +import com.github.mikephil.charting.utils.Transformer; +import com.github.mikephil.charting.utils.ViewPortHandler; + +/** + * Created by Philipp Jahoda on 19/02/16. + */ +@SuppressLint("NewApi") +public abstract class AnimatedViewPortJob extends ViewPortJob implements ValueAnimator.AnimatorUpdateListener, Animator.AnimatorListener { + + protected ObjectAnimator animator; + + protected float phase; + + protected float xOrigin; + protected float yOrigin; + + public AnimatedViewPortJob(ViewPortHandler viewPortHandler, float xValue, float yValue, Transformer trans, View v, float xOrigin, float yOrigin, long duration) { + super(viewPortHandler, xValue, yValue, trans, v); + this.xOrigin = xOrigin; + this.yOrigin = yOrigin; + animator = ObjectAnimator.ofFloat(this, "phase", 0f, 1f); + animator.setDuration(duration); + animator.addUpdateListener(this); + animator.addListener(this); + } + + @SuppressLint("NewApi") + @Override + public void run() { + animator.start(); + } + + public float getPhase() { + return phase; + } + + public void setPhase(float phase) { + this.phase = phase; + } + + public float getXOrigin() { + return xOrigin; + } + + public float getYOrigin() { + return yOrigin; + } + + public abstract void recycleSelf(); + + protected void resetAnimator(){ + animator.removeAllListeners(); + animator.removeAllUpdateListeners(); + animator.reverse(); + animator.addUpdateListener(this); + animator.addListener(this); + } + + @Override + public void onAnimationStart(Animator animation) { + + } + + @Override + public void onAnimationEnd(Animator animation) { + try{ + recycleSelf(); + }catch (IllegalArgumentException e){ + // don't worry about it. + } + } + + @Override + public void onAnimationCancel(Animator animation) { + try{ + recycleSelf(); + }catch (IllegalArgumentException e){ + // don't worry about it. + } + } + + @Override + public void onAnimationRepeat(Animator animation) { + + } + + @Override + public void onAnimationUpdate(ValueAnimator animation) { + + } +} diff --git a/MPChartLib/src/main/java/com/github/mikephil/charting/jobs/AnimatedZoomJob.java b/MPChartLib/src/main/java/com/github/mikephil/charting/jobs/AnimatedZoomJob.java new file mode 100644 index 00000000..e5e4c417 --- /dev/null +++ b/MPChartLib/src/main/java/com/github/mikephil/charting/jobs/AnimatedZoomJob.java @@ -0,0 +1,119 @@ +package com.github.mikephil.charting.jobs; + +import android.animation.Animator; +import android.animation.ValueAnimator; +import android.annotation.SuppressLint; +import android.graphics.Matrix; +import android.view.View; + +import com.github.mikephil.charting.charts.BarLineChartBase; +import com.github.mikephil.charting.components.YAxis; +import com.github.mikephil.charting.utils.ObjectPool; +import com.github.mikephil.charting.utils.Transformer; +import com.github.mikephil.charting.utils.ViewPortHandler; + +/** + * Created by Philipp Jahoda on 19/02/16. + */ +@SuppressLint("NewApi") +public class AnimatedZoomJob extends AnimatedViewPortJob implements Animator.AnimatorListener { + + private static ObjectPool<AnimatedZoomJob> pool; + + static { + pool = ObjectPool.create(8, new AnimatedZoomJob(null,null,null,null,0,0,0,0,0,0,0,0,0,0)); + } + + public static AnimatedZoomJob getInstance(ViewPortHandler viewPortHandler, View v, Transformer trans, YAxis axis, float xAxisRange, float scaleX, float scaleY, float xOrigin, float yOrigin, float zoomCenterX, float zoomCenterY, float zoomOriginX, float zoomOriginY, long duration) { + AnimatedZoomJob result = pool.get(); + result.mViewPortHandler = viewPortHandler; + result.xValue = scaleX; + result.yValue = scaleY; + result.mTrans = trans; + result.view = v; + result.xOrigin = xOrigin; + result.yOrigin = yOrigin; + result.yAxis = axis; + result.xAxisRange = xAxisRange; + result.resetAnimator(); + result.animator.setDuration(duration); + return result; + } + + protected float zoomOriginX; + protected float zoomOriginY; + + protected float zoomCenterX; + protected float zoomCenterY; + + protected YAxis yAxis; + + protected float xAxisRange; + + @SuppressLint("NewApi") + public AnimatedZoomJob(ViewPortHandler viewPortHandler, View v, Transformer trans, YAxis axis, float xAxisRange, float scaleX, float scaleY, float xOrigin, float yOrigin, float zoomCenterX, float zoomCenterY, float zoomOriginX, float zoomOriginY, long duration) { + super(viewPortHandler, scaleX, scaleY, trans, v, xOrigin, yOrigin, duration); + + this.zoomCenterX = zoomCenterX; + this.zoomCenterY = zoomCenterY; + this.zoomOriginX = zoomOriginX; + this.zoomOriginY = zoomOriginY; + this.animator.addListener(this); + this.yAxis = axis; + this.xAxisRange = xAxisRange; + } + + protected Matrix mOnAnimationUpdateMatrixBuffer = new Matrix(); + @Override + public void onAnimationUpdate(ValueAnimator animation) { + + float scaleX = xOrigin + (xValue - xOrigin) * phase; + float scaleY = yOrigin + (yValue - yOrigin) * phase; + + Matrix save = mOnAnimationUpdateMatrixBuffer; + mViewPortHandler.setZoom(scaleX, scaleY, save); + mViewPortHandler.refresh(save, view, false); + + float valsInView = yAxis.mAxisRange / mViewPortHandler.getScaleY(); + float xsInView = xAxisRange / mViewPortHandler.getScaleX(); + + pts[0] = zoomOriginX + ((zoomCenterX - xsInView / 2f) - zoomOriginX) * phase; + pts[1] = zoomOriginY + ((zoomCenterY + valsInView / 2f) - zoomOriginY) * phase; + + mTrans.pointValuesToPixel(pts); + + mViewPortHandler.translate(pts, save); + mViewPortHandler.refresh(save, view, true); + } + + @Override + public void onAnimationEnd(Animator animation) { + ((BarLineChartBase) view).calculateOffsets(); + view.postInvalidate(); + } + + @Override + public void onAnimationCancel(Animator animation) { + + } + + @Override + public void onAnimationRepeat(Animator animation) { + + } + + @Override + public void recycleSelf() { + + } + + @Override + public void onAnimationStart(Animator animation) { + + } + + @Override + protected ObjectPool.Poolable instantiate() { + return new AnimatedZoomJob(null,null,null,null,0,0,0,0,0,0,0,0,0,0); + } +} diff --git a/MPChartLib/src/main/java/com/github/mikephil/charting/jobs/MoveViewJob.java b/MPChartLib/src/main/java/com/github/mikephil/charting/jobs/MoveViewJob.java new file mode 100644 index 00000000..46b56b13 --- /dev/null +++ b/MPChartLib/src/main/java/com/github/mikephil/charting/jobs/MoveViewJob.java @@ -0,0 +1,56 @@ + +package com.github.mikephil.charting.jobs; + +import android.view.View; + +import com.github.mikephil.charting.utils.ObjectPool; +import com.github.mikephil.charting.utils.Transformer; +import com.github.mikephil.charting.utils.ViewPortHandler; + +/** + * Created by Philipp Jahoda on 19/02/16. + */ +public class MoveViewJob extends ViewPortJob { + + private static ObjectPool<MoveViewJob> pool; + + static { + pool = ObjectPool.create(2, new MoveViewJob(null,0,0,null,null)); + pool.setReplenishPercentage(0.5f); + } + + public static MoveViewJob getInstance(ViewPortHandler viewPortHandler, float xValue, float yValue, Transformer trans, View v){ + MoveViewJob result = pool.get(); + result.mViewPortHandler = viewPortHandler; + result.xValue = xValue; + result.yValue = yValue; + result.mTrans = trans; + result.view = v; + return result; + } + + public static void recycleInstance(MoveViewJob instance){ + pool.recycle(instance); + } + + public MoveViewJob(ViewPortHandler viewPortHandler, float xValue, float yValue, Transformer trans, View v) { + super(viewPortHandler, xValue, yValue, trans, v); + } + + @Override + public void run() { + + pts[0] = xValue; + pts[1] = yValue; + + mTrans.pointValuesToPixel(pts); + mViewPortHandler.centerViewPort(pts, view); + + this.recycleInstance(this); + } + + @Override + protected ObjectPool.Poolable instantiate() { + return new MoveViewJob(mViewPortHandler, xValue, yValue, mTrans, view); + } +} diff --git a/MPChartLib/src/main/java/com/github/mikephil/charting/jobs/ViewPortJob.java b/MPChartLib/src/main/java/com/github/mikephil/charting/jobs/ViewPortJob.java new file mode 100644 index 00000000..c424e4b8 --- /dev/null +++ b/MPChartLib/src/main/java/com/github/mikephil/charting/jobs/ViewPortJob.java @@ -0,0 +1,47 @@ + +package com.github.mikephil.charting.jobs; + +import android.view.View; + +import com.github.mikephil.charting.utils.ObjectPool; +import com.github.mikephil.charting.utils.Transformer; +import com.github.mikephil.charting.utils.ViewPortHandler; + +/** + * Runnable that is used for viewport modifications since they cannot be + * executed at any time. This can be used to delay the execution of viewport + * modifications until the onSizeChanged(...) method of the chart-view is called. + * This is especially important if viewport modifying methods are called on the chart + * directly after initialization. + * + * @author Philipp Jahoda + */ +public abstract class ViewPortJob extends ObjectPool.Poolable implements Runnable { + + protected float[] pts = new float[2]; + + protected ViewPortHandler mViewPortHandler; + protected float xValue = 0f; + protected float yValue = 0f; + protected Transformer mTrans; + protected View view; + + public ViewPortJob(ViewPortHandler viewPortHandler, float xValue, float yValue, + Transformer trans, View v) { + + this.mViewPortHandler = viewPortHandler; + this.xValue = xValue; + this.yValue = yValue; + this.mTrans = trans; + this.view = v; + + } + + public float getXValue() { + return xValue; + } + + public float getYValue() { + return yValue; + } +} diff --git a/MPChartLib/src/main/java/com/github/mikephil/charting/jobs/ZoomJob.java b/MPChartLib/src/main/java/com/github/mikephil/charting/jobs/ZoomJob.java new file mode 100644 index 00000000..c39586ca --- /dev/null +++ b/MPChartLib/src/main/java/com/github/mikephil/charting/jobs/ZoomJob.java @@ -0,0 +1,87 @@ + +package com.github.mikephil.charting.jobs; + +import android.graphics.Matrix; +import android.view.View; + +import com.github.mikephil.charting.charts.BarLineChartBase; +import com.github.mikephil.charting.components.YAxis; +import com.github.mikephil.charting.utils.ObjectPool; +import com.github.mikephil.charting.utils.Transformer; +import com.github.mikephil.charting.utils.ViewPortHandler; + +/** + * Created by Philipp Jahoda on 19/02/16. + */ +public class ZoomJob extends ViewPortJob { + + private static ObjectPool<ZoomJob> pool; + + static { + pool = ObjectPool.create(1, new ZoomJob(null, 0, 0, 0, 0, null, null, null)); + pool.setReplenishPercentage(0.5f); + } + + public static ZoomJob getInstance(ViewPortHandler viewPortHandler, float scaleX, float scaleY, float xValue, float yValue, + Transformer trans, YAxis.AxisDependency axis, View v) { + ZoomJob result = pool.get(); + result.xValue = xValue; + result.yValue = yValue; + result.scaleX = scaleX; + result.scaleY = scaleY; + result.mViewPortHandler = viewPortHandler; + result.mTrans = trans; + result.axisDependency = axis; + result.view = v; + return result; + } + + public static void recycleInstance(ZoomJob instance) { + pool.recycle(instance); + } + + protected float scaleX; + protected float scaleY; + + protected YAxis.AxisDependency axisDependency; + + public ZoomJob(ViewPortHandler viewPortHandler, float scaleX, float scaleY, float xValue, float yValue, Transformer trans, + YAxis.AxisDependency axis, View v) { + super(viewPortHandler, xValue, yValue, trans, v); + + this.scaleX = scaleX; + this.scaleY = scaleY; + this.axisDependency = axis; + } + + protected Matrix mRunMatrixBuffer = new Matrix(); + + @Override + public void run() { + + Matrix save = mRunMatrixBuffer; + mViewPortHandler.zoom(scaleX, scaleY, save); + mViewPortHandler.refresh(save, view, false); + + float yValsInView = ((BarLineChartBase) view).getAxis(axisDependency).mAxisRange / mViewPortHandler.getScaleY(); + float xValsInView = ((BarLineChartBase) view).getXAxis().mAxisRange / mViewPortHandler.getScaleX(); + + pts[0] = xValue - xValsInView / 2f; + pts[1] = yValue + yValsInView / 2f; + + mTrans.pointValuesToPixel(pts); + + mViewPortHandler.translate(pts, save); + mViewPortHandler.refresh(save, view, false); + + ((BarLineChartBase) view).calculateOffsets(); + view.postInvalidate(); + + recycleInstance(this); + } + + @Override + protected ObjectPool.Poolable instantiate() { + return new ZoomJob(null, 0, 0, 0, 0, null, null, null); + } +} diff --git a/MPChartLib/src/main/java/com/github/mikephil/charting/listener/BarLineChartTouchListener.java b/MPChartLib/src/main/java/com/github/mikephil/charting/listener/BarLineChartTouchListener.java new file mode 100644 index 00000000..5685d32f --- /dev/null +++ b/MPChartLib/src/main/java/com/github/mikephil/charting/listener/BarLineChartTouchListener.java @@ -0,0 +1,698 @@ +package com.github.mikephil.charting.listener; + +import android.annotation.SuppressLint; +import android.graphics.Matrix; +import android.graphics.PointF; +import android.util.Log; +import android.view.MotionEvent; +import android.view.VelocityTracker; +import android.view.View; +import android.view.animation.AnimationUtils; + +import com.github.mikephil.charting.charts.BarLineChartBase; +import com.github.mikephil.charting.charts.HorizontalBarChart; +import com.github.mikephil.charting.data.BarLineScatterCandleBubbleData; +import com.github.mikephil.charting.data.Entry; +import com.github.mikephil.charting.highlight.Highlight; +import com.github.mikephil.charting.interfaces.datasets.IBarLineScatterCandleBubbleDataSet; +import com.github.mikephil.charting.interfaces.datasets.IDataSet; +import com.github.mikephil.charting.utils.MPPointF; +import com.github.mikephil.charting.utils.Utils; +import com.github.mikephil.charting.utils.ViewPortHandler; + +/** + * TouchListener for Bar-, Line-, Scatter- and CandleStickChart with handles all + * touch interaction. Longpress == Zoom out. Double-Tap == Zoom in. + * + * @author Philipp Jahoda + */ +public class BarLineChartTouchListener extends ChartTouchListener<BarLineChartBase<? extends BarLineScatterCandleBubbleData<? + extends IBarLineScatterCandleBubbleDataSet<? extends Entry>>>> { + + /** + * the original touch-matrix from the chart + */ + private Matrix mMatrix = new Matrix(); + + /** + * matrix for saving the original matrix state + */ + private Matrix mSavedMatrix = new Matrix(); + + /** + * point where the touch action started + */ + private MPPointF mTouchStartPoint = MPPointF.getInstance(0,0); + + /** + * center between two pointers (fingers on the display) + */ + private MPPointF mTouchPointCenter = MPPointF.getInstance(0,0); + + private float mSavedXDist = 1f; + private float mSavedYDist = 1f; + private float mSavedDist = 1f; + + private IDataSet mClosestDataSetToTouch; + + /** + * used for tracking velocity of dragging + */ + private VelocityTracker mVelocityTracker; + + private long mDecelerationLastTime = 0; + private MPPointF mDecelerationCurrentPoint = MPPointF.getInstance(0,0); + private MPPointF mDecelerationVelocity = MPPointF.getInstance(0,0); + + /** + * the distance of movement that will be counted as a drag + */ + private float mDragTriggerDist; + + /** + * the minimum distance between the pointers that will trigger a zoom gesture + */ + private float mMinScalePointerDistance; + + /** + * Constructor with initialization parameters. + * + * @param chart instance of the chart + * @param touchMatrix the touch-matrix of the chart + * @param dragTriggerDistance the minimum movement distance that will be interpreted as a "drag" gesture in dp (3dp equals + * to about 9 pixels on a 5.5" FHD screen) + */ + public BarLineChartTouchListener(BarLineChartBase<? extends BarLineScatterCandleBubbleData<? extends + IBarLineScatterCandleBubbleDataSet<? extends Entry>>> chart, Matrix touchMatrix, float dragTriggerDistance) { + super(chart); + this.mMatrix = touchMatrix; + + this.mDragTriggerDist = Utils.convertDpToPixel(dragTriggerDistance); + + this.mMinScalePointerDistance = Utils.convertDpToPixel(3.5f); + } + + @SuppressLint("ClickableViewAccessibility") + @Override + public boolean onTouch(View v, MotionEvent event) { + + if (mVelocityTracker == null) { + mVelocityTracker = VelocityTracker.obtain(); + } + mVelocityTracker.addMovement(event); + + if (event.getActionMasked() == MotionEvent.ACTION_CANCEL) { + if (mVelocityTracker != null) { + mVelocityTracker.recycle(); + mVelocityTracker = null; + } + } + + if (mTouchMode == NONE) { + mGestureDetector.onTouchEvent(event); + } + + if (!mChart.isDragEnabled() && (!mChart.isScaleXEnabled() && !mChart.isScaleYEnabled())) + return true; + + // Handle touch events here... + switch (event.getAction() & MotionEvent.ACTION_MASK) { + + case MotionEvent.ACTION_DOWN: + + startAction(event); + + stopDeceleration(); + + saveTouchStart(event); + + break; + + case MotionEvent.ACTION_POINTER_DOWN: + + if (event.getPointerCount() >= 2) { + + mChart.disableScroll(); + + saveTouchStart(event); + + // get the distance between the pointers on the x-axis + mSavedXDist = getXDist(event); + + // get the distance between the pointers on the y-axis + mSavedYDist = getYDist(event); + + // get the total distance between the pointers + mSavedDist = spacing(event); + + if (mSavedDist > 10f) { + + if (mChart.isPinchZoomEnabled()) { + mTouchMode = PINCH_ZOOM; + } else { + if (mChart.isScaleXEnabled() != mChart.isScaleYEnabled()) { + mTouchMode = mChart.isScaleXEnabled() ? X_ZOOM : Y_ZOOM; + } else { + mTouchMode = mSavedXDist > mSavedYDist ? X_ZOOM : Y_ZOOM; + } + } + } + + // determine the touch-pointer center + midPoint(mTouchPointCenter, event); + } + break; + + case MotionEvent.ACTION_MOVE: + + if (mTouchMode == DRAG) { + + mChart.disableScroll(); + + float x = mChart.isDragXEnabled() ? event.getX() - mTouchStartPoint.x : 0.f; + float y = mChart.isDragYEnabled() ? event.getY() - mTouchStartPoint.y : 0.f; + + performDrag(event, x, y); + + } else if (mTouchMode == X_ZOOM || mTouchMode == Y_ZOOM || mTouchMode == PINCH_ZOOM) { + + mChart.disableScroll(); + + if (mChart.isScaleXEnabled() || mChart.isScaleYEnabled()) + performZoom(event); + + } else if (mTouchMode == NONE + && Math.abs(distance(event.getX(), mTouchStartPoint.x, event.getY(), + mTouchStartPoint.y)) > mDragTriggerDist) { + + if (mChart.isDragEnabled()) { + + boolean shouldPan = !mChart.isFullyZoomedOut() || + !mChart.hasNoDragOffset(); + + if (shouldPan) { + + float distanceX = Math.abs(event.getX() - mTouchStartPoint.x); + float distanceY = Math.abs(event.getY() - mTouchStartPoint.y); + + // Disable dragging in a direction that's disallowed + if ((mChart.isDragXEnabled() || distanceY >= distanceX) && + (mChart.isDragYEnabled() || distanceY <= distanceX)) { + + mLastGesture = ChartGesture.DRAG; + mTouchMode = DRAG; + } + + } else { + + if (mChart.isHighlightPerDragEnabled()) { + mLastGesture = ChartGesture.DRAG; + + if (mChart.isHighlightPerDragEnabled()) + performHighlightDrag(event); + } + } + + } + + } + break; + + case MotionEvent.ACTION_UP: + + final VelocityTracker velocityTracker = mVelocityTracker; + final int pointerId = event.getPointerId(0); + velocityTracker.computeCurrentVelocity(1000, Utils.getMaximumFlingVelocity()); + final float velocityY = velocityTracker.getYVelocity(pointerId); + final float velocityX = velocityTracker.getXVelocity(pointerId); + + if (Math.abs(velocityX) > Utils.getMinimumFlingVelocity() || + Math.abs(velocityY) > Utils.getMinimumFlingVelocity()) { + + if (mTouchMode == DRAG && mChart.isDragDecelerationEnabled()) { + + stopDeceleration(); + + mDecelerationLastTime = AnimationUtils.currentAnimationTimeMillis(); + + mDecelerationCurrentPoint.x = event.getX(); + mDecelerationCurrentPoint.y = event.getY(); + + mDecelerationVelocity.x = velocityX; + mDecelerationVelocity.y = velocityY; + + Utils.postInvalidateOnAnimation(mChart); // This causes computeScroll to fire, recommended for this by + // Google + } + } + + if (mTouchMode == X_ZOOM || + mTouchMode == Y_ZOOM || + mTouchMode == PINCH_ZOOM || + mTouchMode == POST_ZOOM) { + + // Range might have changed, which means that Y-axis labels + // could have changed in size, affecting Y-axis size. + // So we need to recalculate offsets. + mChart.calculateOffsets(); + mChart.postInvalidate(); + } + + mTouchMode = NONE; + mChart.enableScroll(); + + if (mVelocityTracker != null) { + mVelocityTracker.recycle(); + mVelocityTracker = null; + } + + endAction(event); + + break; + case MotionEvent.ACTION_POINTER_UP: + Utils.velocityTrackerPointerUpCleanUpIfNecessary(event, mVelocityTracker); + + mTouchMode = POST_ZOOM; + break; + + case MotionEvent.ACTION_CANCEL: + + mTouchMode = NONE; + endAction(event); + break; + } + + // perform the transformation, update the chart + mMatrix = mChart.getViewPortHandler().refresh(mMatrix, mChart, true); + + return true; // indicate event was handled + } + + /** + * ################ ################ ################ ################ + */ + /** BELOW CODE PERFORMS THE ACTUAL TOUCH ACTIONS */ + + /** + * Saves the current Matrix state and the touch-start point. + * + * @param event + */ + private void saveTouchStart(MotionEvent event) { + + mSavedMatrix.set(mMatrix); + mTouchStartPoint.x = event.getX(); + mTouchStartPoint.y = event.getY(); + + mClosestDataSetToTouch = mChart.getDataSetByTouchPoint(event.getX(), event.getY()); + } + + /** + * Performs all necessary operations needed for dragging. + * + * @param event + */ + private void performDrag(MotionEvent event, float distanceX, float distanceY) { + + mLastGesture = ChartGesture.DRAG; + + mMatrix.set(mSavedMatrix); + + OnChartGestureListener l = mChart.getOnChartGestureListener(); + + // check if axis is inverted + if (inverted()) { + + // if there is an inverted horizontalbarchart + if (mChart instanceof HorizontalBarChart) { + distanceX = -distanceX; + } else { + distanceY = -distanceY; + } + } + + mMatrix.postTranslate(distanceX, distanceY); + + if (l != null) + l.onChartTranslate(event, distanceX, distanceY); + } + + /** + * Performs the all operations necessary for pinch and axis zoom. + * + * @param event + */ + private void performZoom(MotionEvent event) { + + if (event.getPointerCount() >= 2) { // two finger zoom + + OnChartGestureListener l = mChart.getOnChartGestureListener(); + + // get the distance between the pointers of the touch event + float totalDist = spacing(event); + + if (totalDist > mMinScalePointerDistance) { + + // get the translation + MPPointF t = getTrans(mTouchPointCenter.x, mTouchPointCenter.y); + ViewPortHandler h = mChart.getViewPortHandler(); + + // take actions depending on the activated touch mode + if (mTouchMode == PINCH_ZOOM) { + + mLastGesture = ChartGesture.PINCH_ZOOM; + + float scale = totalDist / mSavedDist; // total scale + + boolean isZoomingOut = (scale < 1); + + boolean canZoomMoreX = isZoomingOut ? + h.canZoomOutMoreX() : + h.canZoomInMoreX(); + + boolean canZoomMoreY = isZoomingOut ? + h.canZoomOutMoreY() : + h.canZoomInMoreY(); + + float scaleX = (mChart.isScaleXEnabled()) ? scale : 1f; + float scaleY = (mChart.isScaleYEnabled()) ? scale : 1f; + + if (canZoomMoreY || canZoomMoreX) { + + mMatrix.set(mSavedMatrix); + mMatrix.postScale(scaleX, scaleY, t.x, t.y); + + if (l != null) + l.onChartScale(event, scaleX, scaleY); + } + + } else if (mTouchMode == X_ZOOM && mChart.isScaleXEnabled()) { + + mLastGesture = ChartGesture.X_ZOOM; + + float xDist = getXDist(event); + float scaleX = xDist / mSavedXDist; // x-axis scale + + boolean isZoomingOut = (scaleX < 1); + boolean canZoomMoreX = isZoomingOut ? + h.canZoomOutMoreX() : + h.canZoomInMoreX(); + + if (canZoomMoreX) { + + mMatrix.set(mSavedMatrix); + mMatrix.postScale(scaleX, 1f, t.x, t.y); + + if (l != null) + l.onChartScale(event, scaleX, 1f); + } + + } else if (mTouchMode == Y_ZOOM && mChart.isScaleYEnabled()) { + + mLastGesture = ChartGesture.Y_ZOOM; + + float yDist = getYDist(event); + float scaleY = yDist / mSavedYDist; // y-axis scale + + boolean isZoomingOut = (scaleY < 1); + boolean canZoomMoreY = isZoomingOut ? + h.canZoomOutMoreY() : + h.canZoomInMoreY(); + + if (canZoomMoreY) { + + mMatrix.set(mSavedMatrix); + mMatrix.postScale(1f, scaleY, t.x, t.y); + + if (l != null) + l.onChartScale(event, 1f, scaleY); + } + } + + MPPointF.recycleInstance(t); + } + } + } + + /** + * Highlights upon dragging, generates callbacks for the selection-listener. + * + * @param e + */ + private void performHighlightDrag(MotionEvent e) { + + Highlight h = mChart.getHighlightByTouchPoint(e.getX(), e.getY()); + + if (h != null && !h.equalTo(mLastHighlighted)) { + mLastHighlighted = h; + mChart.highlightValue(h, true); + } + } + + /** + * ################ ################ ################ ################ + */ + /** DOING THE MATH BELOW ;-) */ + + + /** + * Determines the center point between two pointer touch points. + * + * @param point + * @param event + */ + private static void midPoint(MPPointF point, MotionEvent event) { + float x = event.getX(0) + event.getX(1); + float y = event.getY(0) + event.getY(1); + point.x = (x / 2f); + point.y = (y / 2f); + } + + /** + * returns the distance between two pointer touch points + * + * @param event + * @return + */ + private static float spacing(MotionEvent event) { + float x = event.getX(0) - event.getX(1); + float y = event.getY(0) - event.getY(1); + return (float) Math.sqrt(x * x + y * y); + } + + /** + * calculates the distance on the x-axis between two pointers (fingers on + * the display) + * + * @param e + * @return + */ + private static float getXDist(MotionEvent e) { + float x = Math.abs(e.getX(0) - e.getX(1)); + return x; + } + + /** + * calculates the distance on the y-axis between two pointers (fingers on + * the display) + * + * @param e + * @return + */ + private static float getYDist(MotionEvent e) { + float y = Math.abs(e.getY(0) - e.getY(1)); + return y; + } + + /** + * Returns a recyclable MPPointF instance. + * returns the correct translation depending on the provided x and y touch + * points + * + * @param x + * @param y + * @return + */ + public MPPointF getTrans(float x, float y) { + + ViewPortHandler vph = mChart.getViewPortHandler(); + + float xTrans = x - vph.offsetLeft(); + float yTrans = 0f; + + // check if axis is inverted + if (inverted()) { + yTrans = -(y - vph.offsetTop()); + } else { + yTrans = -(mChart.getMeasuredHeight() - y - vph.offsetBottom()); + } + + return MPPointF.getInstance(xTrans, yTrans); + } + + /** + * Returns true if the current touch situation should be interpreted as inverted, false if not. + * + * @return + */ + private boolean inverted() { + return (mClosestDataSetToTouch == null && mChart.isAnyAxisInverted()) || (mClosestDataSetToTouch != null + && mChart.isInverted(mClosestDataSetToTouch.getAxisDependency())); + } + + /** + * ################ ################ ################ ################ + */ + /** GETTERS AND GESTURE RECOGNITION BELOW */ + + /** + * returns the matrix object the listener holds + * + * @return + */ + public Matrix getMatrix() { + return mMatrix; + } + + /** + * Sets the minimum distance that will be interpreted as a "drag" by the chart in dp. + * Default: 3dp + * + * @param dragTriggerDistance + */ + public void setDragTriggerDist(float dragTriggerDistance) { + this.mDragTriggerDist = Utils.convertDpToPixel(dragTriggerDistance); + } + + @Override + public boolean onDoubleTap(MotionEvent e) { + + mLastGesture = ChartGesture.DOUBLE_TAP; + + OnChartGestureListener l = mChart.getOnChartGestureListener(); + + if (l != null) { + l.onChartDoubleTapped(e); + } + + // check if double-tap zooming is enabled + if (mChart.isDoubleTapToZoomEnabled() && mChart.getData().getEntryCount() > 0) { + + MPPointF trans = getTrans(e.getX(), e.getY()); + + float scaleX = mChart.isScaleXEnabled() ? 1.4f : 1f; + float scaleY = mChart.isScaleYEnabled() ? 1.4f : 1f; + + mChart.zoom(scaleX, scaleY, trans.x, trans.y); + + if (mChart.isLogEnabled()) + Log.i("BarlineChartTouch", "Double-Tap, Zooming In, x: " + trans.x + ", y: " + + trans.y); + + if (l != null) { + l.onChartScale(e, scaleX, scaleY); + } + + MPPointF.recycleInstance(trans); + } + + return super.onDoubleTap(e); + } + + @Override + public void onLongPress(MotionEvent e) { + + mLastGesture = ChartGesture.LONG_PRESS; + + OnChartGestureListener l = mChart.getOnChartGestureListener(); + + if (l != null) { + + l.onChartLongPressed(e); + } + } + + @Override + public boolean onSingleTapUp(MotionEvent e) { + + mLastGesture = ChartGesture.SINGLE_TAP; + + OnChartGestureListener l = mChart.getOnChartGestureListener(); + + if (l != null) { + l.onChartSingleTapped(e); + } + + if (!mChart.isHighlightPerTapEnabled()) { + return false; + } + + Highlight h = mChart.getHighlightByTouchPoint(e.getX(), e.getY()); + performHighlight(h, e); + + return super.onSingleTapUp(e); + } + + @Override + public boolean onFling(MotionEvent e1, MotionEvent e2, float velocityX, float velocityY) { + + mLastGesture = ChartGesture.FLING; + + OnChartGestureListener l = mChart.getOnChartGestureListener(); + + if (l != null) { + l.onChartFling(e1, e2, velocityX, velocityY); + } + + return super.onFling(e1, e2, velocityX, velocityY); + } + + public void stopDeceleration() { + mDecelerationVelocity.x = 0; + mDecelerationVelocity.y = 0; + } + + public void computeScroll() { + + if (mDecelerationVelocity.x == 0.f && mDecelerationVelocity.y == 0.f) + return; // There's no deceleration in progress + + final long currentTime = AnimationUtils.currentAnimationTimeMillis(); + + mDecelerationVelocity.x *= mChart.getDragDecelerationFrictionCoef(); + mDecelerationVelocity.y *= mChart.getDragDecelerationFrictionCoef(); + + final float timeInterval = (float) (currentTime - mDecelerationLastTime) / 1000.f; + + float distanceX = mDecelerationVelocity.x * timeInterval; + float distanceY = mDecelerationVelocity.y * timeInterval; + + mDecelerationCurrentPoint.x += distanceX; + mDecelerationCurrentPoint.y += distanceY; + + MotionEvent event = MotionEvent.obtain(currentTime, currentTime, MotionEvent.ACTION_MOVE, mDecelerationCurrentPoint.x, + mDecelerationCurrentPoint.y, 0); + + float dragDistanceX = mChart.isDragXEnabled() ? mDecelerationCurrentPoint.x - mTouchStartPoint.x : 0.f; + float dragDistanceY = mChart.isDragYEnabled() ? mDecelerationCurrentPoint.y - mTouchStartPoint.y : 0.f; + + performDrag(event, dragDistanceX, dragDistanceY); + + event.recycle(); + mMatrix = mChart.getViewPortHandler().refresh(mMatrix, mChart, false); + + mDecelerationLastTime = currentTime; + + if (Math.abs(mDecelerationVelocity.x) >= 0.01 || Math.abs(mDecelerationVelocity.y) >= 0.01) + Utils.postInvalidateOnAnimation(mChart); // This causes computeScroll to fire, recommended for this by Google + else { + // Range might have changed, which means that Y-axis labels + // could have changed in size, affecting Y-axis size. + // So we need to recalculate offsets. + mChart.calculateOffsets(); + mChart.postInvalidate(); + + stopDeceleration(); + } + } +} diff --git a/MPChartLib/src/main/java/com/github/mikephil/charting/listener/ChartTouchListener.java b/MPChartLib/src/main/java/com/github/mikephil/charting/listener/ChartTouchListener.java new file mode 100644 index 00000000..75c8e864 --- /dev/null +++ b/MPChartLib/src/main/java/com/github/mikephil/charting/listener/ChartTouchListener.java @@ -0,0 +1,143 @@ +package com.github.mikephil.charting.listener; + +import android.view.GestureDetector; +import android.view.MotionEvent; +import android.view.View; + +import com.github.mikephil.charting.charts.Chart; +import com.github.mikephil.charting.highlight.Highlight; + +/** + * Created by philipp on 12/06/15. + */ +public abstract class ChartTouchListener<T extends Chart<?>> extends GestureDetector.SimpleOnGestureListener implements View.OnTouchListener { + + public enum ChartGesture { + NONE, DRAG, X_ZOOM, Y_ZOOM, PINCH_ZOOM, ROTATE, SINGLE_TAP, DOUBLE_TAP, LONG_PRESS, FLING + } + + /** + * the last touch gesture that has been performed + **/ + protected ChartGesture mLastGesture = ChartGesture.NONE; + + // states + protected static final int NONE = 0; + protected static final int DRAG = 1; + protected static final int X_ZOOM = 2; + protected static final int Y_ZOOM = 3; + protected static final int PINCH_ZOOM = 4; + protected static final int POST_ZOOM = 5; + protected static final int ROTATE = 6; + + /** + * integer field that holds the current touch-state + */ + protected int mTouchMode = NONE; + + /** + * the last highlighted object (via touch) + */ + protected Highlight mLastHighlighted; + + /** + * the gesturedetector used for detecting taps and longpresses, ... + */ + protected GestureDetector mGestureDetector; + + /** + * the chart the listener represents + */ + protected T mChart; + + public ChartTouchListener(T chart) { + this.mChart = chart; + + mGestureDetector = new GestureDetector(chart.getContext(), this); + } + + /** + * Calls the OnChartGestureListener to do the start callback + * + * @param me + */ + public void startAction(MotionEvent me) { + + OnChartGestureListener l = mChart.getOnChartGestureListener(); + + if (l != null) + l.onChartGestureStart(me, mLastGesture); + } + + /** + * Calls the OnChartGestureListener to do the end callback + * + * @param me + */ + public void endAction(MotionEvent me) { + + OnChartGestureListener l = mChart.getOnChartGestureListener(); + + if (l != null) + l.onChartGestureEnd(me, mLastGesture); + } + + /** + * Sets the last value that was highlighted via touch. + * + * @param high + */ + public void setLastHighlighted(Highlight high) { + mLastHighlighted = high; + } + + /** + * returns the touch mode the listener is currently in + * + * @return + */ + public int getTouchMode() { + return mTouchMode; + } + + /** + * Returns the last gesture that has been performed on the chart. + * + * @return + */ + public ChartGesture getLastGesture() { + return mLastGesture; + } + + + /** + * Perform a highlight operation. + * + * @param e + */ + protected void performHighlight(Highlight h, MotionEvent e) { + + if (h == null || h.equalTo(mLastHighlighted)) { + mChart.highlightValue(null, true); + mLastHighlighted = null; + } else { + mChart.highlightValue(h, true); + mLastHighlighted = h; + } + } + + /** + * returns the distance between two points + * + * @param eventX + * @param startX + * @param eventY + * @param startY + * @return + */ + protected static float distance(float eventX, float startX, float eventY, float startY) { + float dx = eventX - startX; + float dy = eventY - startY; + return (float) Math.sqrt(dx * dx + dy * dy); + } +} diff --git a/MPChartLib/src/main/java/com/github/mikephil/charting/listener/OnChartGestureListener.java b/MPChartLib/src/main/java/com/github/mikephil/charting/listener/OnChartGestureListener.java new file mode 100644 index 00000000..da0c5ed1 --- /dev/null +++ b/MPChartLib/src/main/java/com/github/mikephil/charting/listener/OnChartGestureListener.java @@ -0,0 +1,76 @@ +package com.github.mikephil.charting.listener; + +import android.view.MotionEvent; + +/** + * Listener for callbacks when doing gestures on the chart. + * + * @author Philipp Jahoda + */ +public interface OnChartGestureListener { + + /** + * Callbacks when a touch-gesture has started on the chart (ACTION_DOWN) + * + * @param me + * @param lastPerformedGesture + */ + void onChartGestureStart(MotionEvent me, ChartTouchListener.ChartGesture lastPerformedGesture); + + /** + * Callbacks when a touch-gesture has ended on the chart (ACTION_UP, ACTION_CANCEL) + * + * @param me + * @param lastPerformedGesture + */ + void onChartGestureEnd(MotionEvent me, ChartTouchListener.ChartGesture lastPerformedGesture); + + /** + * Callbacks when the chart is longpressed. + * + * @param me + */ + void onChartLongPressed(MotionEvent me); + + /** + * Callbacks when the chart is double-tapped. + * + * @param me + */ + void onChartDoubleTapped(MotionEvent me); + + /** + * Callbacks when the chart is single-tapped. + * + * @param me + */ + void onChartSingleTapped(MotionEvent me); + + /** + * Callbacks then a fling gesture is made on the chart. + * + * @param me1 + * @param me2 + * @param velocityX + * @param velocityY + */ + void onChartFling(MotionEvent me1, MotionEvent me2, float velocityX, float velocityY); + + /** + * Callbacks when the chart is scaled / zoomed via pinch zoom / double-tap gesture. + * + * @param me + * @param scaleX scalefactor on the x-axis + * @param scaleY scalefactor on the y-axis + */ + void onChartScale(MotionEvent me, float scaleX, float scaleY); + + /** + * Callbacks when the chart is moved / translated via drag gesture. + * + * @param me + * @param dX translation distance on the x-axis + * @param dY translation distance on the y-axis + */ + void onChartTranslate(MotionEvent me, float dX, float dY); +} diff --git a/MPChartLib/src/main/java/com/github/mikephil/charting/listener/OnChartValueSelectedListener.java b/MPChartLib/src/main/java/com/github/mikephil/charting/listener/OnChartValueSelectedListener.java new file mode 100644 index 00000000..7f50232b --- /dev/null +++ b/MPChartLib/src/main/java/com/github/mikephil/charting/listener/OnChartValueSelectedListener.java @@ -0,0 +1,27 @@ +package com.github.mikephil.charting.listener; + +import com.github.mikephil.charting.data.Entry; +import com.github.mikephil.charting.highlight.Highlight; + +/** + * Listener for callbacks when selecting values inside the chart by + * touch-gesture. + * + * @author Philipp Jahoda + */ +public interface OnChartValueSelectedListener { + + /** + * Called when a value has been selected inside the chart. + * + * @param e The selected Entry + * @param h The corresponding highlight object that contains information + * about the highlighted position such as dataSetIndex, ... + */ + void onValueSelected(Entry e, Highlight h); + + /** + * Called when nothing has been selected or an "un-select" has been made. + */ + void onNothingSelected(); +} diff --git a/MPChartLib/src/main/java/com/github/mikephil/charting/listener/OnDrawLineChartTouchListener.java b/MPChartLib/src/main/java/com/github/mikephil/charting/listener/OnDrawLineChartTouchListener.java new file mode 100644 index 00000000..ca3a67f6 --- /dev/null +++ b/MPChartLib/src/main/java/com/github/mikephil/charting/listener/OnDrawLineChartTouchListener.java @@ -0,0 +1,15 @@ +package com.github.mikephil.charting.listener; + +import android.view.GestureDetector.SimpleOnGestureListener; +import android.view.MotionEvent; +import android.view.View; +import android.view.View.OnTouchListener; + +public class OnDrawLineChartTouchListener extends SimpleOnGestureListener implements OnTouchListener { + + @Override + public boolean onTouch(View v, MotionEvent event) { + return false; + } + +} diff --git a/MPChartLib/src/main/java/com/github/mikephil/charting/listener/OnDrawListener.java b/MPChartLib/src/main/java/com/github/mikephil/charting/listener/OnDrawListener.java new file mode 100644 index 00000000..5890350b --- /dev/null +++ b/MPChartLib/src/main/java/com/github/mikephil/charting/listener/OnDrawListener.java @@ -0,0 +1,38 @@ +package com.github.mikephil.charting.listener; + +import com.github.mikephil.charting.data.DataSet; +import com.github.mikephil.charting.data.Entry; + +/** + * Listener for callbacks when drawing on the chart. + * + * @author Philipp + * + */ +public interface OnDrawListener { + + /** + * Called whenever an entry is added with the finger. Note this is also called for entries that are generated by the + * library, when the touch gesture is too fast and skips points. + * + * @param entry + * the last drawn entry + */ + void onEntryAdded(Entry entry); + + /** + * Called whenever an entry is moved by the user after beeing highlighted + * + * @param entry + */ + void onEntryMoved(Entry entry); + + /** + * Called when drawing finger is lifted and the draw is finished. + * + * @param dataSet + * the last drawn DataSet + */ + void onDrawFinished(DataSet<?> dataSet); + +} diff --git a/MPChartLib/src/main/java/com/github/mikephil/charting/listener/PieRadarChartTouchListener.java b/MPChartLib/src/main/java/com/github/mikephil/charting/listener/PieRadarChartTouchListener.java new file mode 100644 index 00000000..d3527f92 --- /dev/null +++ b/MPChartLib/src/main/java/com/github/mikephil/charting/listener/PieRadarChartTouchListener.java @@ -0,0 +1,288 @@ + +package com.github.mikephil.charting.listener; + +import android.annotation.SuppressLint; +import android.graphics.PointF; +import android.view.MotionEvent; +import android.view.View; +import android.view.animation.AnimationUtils; + +import com.github.mikephil.charting.charts.PieRadarChartBase; +import com.github.mikephil.charting.highlight.Highlight; +import com.github.mikephil.charting.utils.MPPointF; +import com.github.mikephil.charting.utils.Utils; + +import java.util.ArrayList; + +/** + * Touchlistener for the PieChart. + * + * @author Philipp Jahoda + */ +public class PieRadarChartTouchListener extends ChartTouchListener<PieRadarChartBase<?>> { + + private MPPointF mTouchStartPoint = MPPointF.getInstance(0,0); + + /** + * the angle where the dragging started + */ + private float mStartAngle = 0f; + + private ArrayList<AngularVelocitySample> _velocitySamples = new ArrayList<AngularVelocitySample>(); + + private long mDecelerationLastTime = 0; + private float mDecelerationAngularVelocity = 0.f; + + public PieRadarChartTouchListener(PieRadarChartBase<?> chart) { + super(chart); + } + + @SuppressLint("ClickableViewAccessibility") + @Override + public boolean onTouch(View v, MotionEvent event) { + + if (mGestureDetector.onTouchEvent(event)) + return true; + + // if rotation by touch is enabled + // TODO: Also check if the pie itself is being touched, rather than the entire chart area + if (mChart.isRotationEnabled()) { + + float x = event.getX(); + float y = event.getY(); + + switch (event.getAction()) { + + case MotionEvent.ACTION_DOWN: + + startAction(event); + + stopDeceleration(); + + resetVelocity(); + + if (mChart.isDragDecelerationEnabled()) + sampleVelocity(x, y); + + setGestureStartAngle(x, y); + mTouchStartPoint.x = x; + mTouchStartPoint.y = y; + + break; + case MotionEvent.ACTION_MOVE: + + if (mChart.isDragDecelerationEnabled()) + sampleVelocity(x, y); + + if (mTouchMode == NONE + && distance(x, mTouchStartPoint.x, y, mTouchStartPoint.y) + > Utils.convertDpToPixel(8f)) { + mLastGesture = ChartGesture.ROTATE; + mTouchMode = ROTATE; + mChart.disableScroll(); + } else if (mTouchMode == ROTATE) { + updateGestureRotation(x, y); + mChart.invalidate(); + } + + endAction(event); + + break; + case MotionEvent.ACTION_UP: + + if (mChart.isDragDecelerationEnabled()) { + + stopDeceleration(); + + sampleVelocity(x, y); + + mDecelerationAngularVelocity = calculateVelocity(); + + if (mDecelerationAngularVelocity != 0.f) { + mDecelerationLastTime = AnimationUtils.currentAnimationTimeMillis(); + + Utils.postInvalidateOnAnimation(mChart); // This causes computeScroll to fire, recommended for this by Google + } + } + + mChart.enableScroll(); + mTouchMode = NONE; + + endAction(event); + + break; + } + } + + return true; + } + + @Override + public void onLongPress(MotionEvent me) { + + mLastGesture = ChartGesture.LONG_PRESS; + + OnChartGestureListener l = mChart.getOnChartGestureListener(); + + if (l != null) { + l.onChartLongPressed(me); + } + } + + @Override + public boolean onSingleTapConfirmed(MotionEvent e) { + return true; + } + + @Override + public boolean onSingleTapUp(MotionEvent e) { + + mLastGesture = ChartGesture.SINGLE_TAP; + + OnChartGestureListener l = mChart.getOnChartGestureListener(); + + if (l != null) { + l.onChartSingleTapped(e); + } + + if(!mChart.isHighlightPerTapEnabled()) { + return false; + } + + Highlight high = mChart.getHighlightByTouchPoint(e.getX(), e.getY()); + performHighlight(high, e); + + return true; + } + + private void resetVelocity() { + _velocitySamples.clear(); + } + + private void sampleVelocity(float touchLocationX, float touchLocationY) { + + long currentTime = AnimationUtils.currentAnimationTimeMillis(); + + _velocitySamples.add(new AngularVelocitySample(currentTime, mChart.getAngleForPoint(touchLocationX, touchLocationY))); + + // Remove samples older than our sample time - 1 seconds + for (int i = 0, count = _velocitySamples.size(); i < count - 2; i++) { + if (currentTime - _velocitySamples.get(i).time > 1000) { + _velocitySamples.remove(0); + i--; + count--; + } else { + break; + } + } + } + + private float calculateVelocity() { + + if (_velocitySamples.isEmpty()) + return 0.f; + + AngularVelocitySample firstSample = _velocitySamples.get(0); + AngularVelocitySample lastSample = _velocitySamples.get(_velocitySamples.size() - 1); + + // Look for a sample that's closest to the latest sample, but not the same, so we can deduce the direction + AngularVelocitySample beforeLastSample = firstSample; + for (int i = _velocitySamples.size() - 1; i >= 0; i--) { + beforeLastSample = _velocitySamples.get(i); + if (beforeLastSample.angle != lastSample.angle) { + break; + } + } + + // Calculate the sampling time + float timeDelta = (lastSample.time - firstSample.time) / 1000.f; + if (timeDelta == 0.f) { + timeDelta = 0.1f; + } + + // Calculate clockwise/ccw by choosing two values that should be closest to each other, + // so if the angles are two far from each other we know they are inverted "for sure" + boolean clockwise = lastSample.angle >= beforeLastSample.angle; + if (Math.abs(lastSample.angle - beforeLastSample.angle) > 270.0) { + clockwise = !clockwise; + } + + // Now if the "gesture" is over a too big of an angle - then we know the angles are inverted, and we need to move them closer to each other from both sides of the 360.0 wrapping point + if (lastSample.angle - firstSample.angle > 180.0) { + firstSample.angle += 360.0; + } else if (firstSample.angle - lastSample.angle > 180.0) { + lastSample.angle += 360.0; + } + + // The velocity + float velocity = Math.abs((lastSample.angle - firstSample.angle) / timeDelta); + + // Direction? + if (!clockwise) { + velocity = -velocity; + } + + return velocity; + } + + /** + * sets the starting angle of the rotation, this is only used by the touch + * listener, x and y is the touch position + * + * @param x + * @param y + */ + public void setGestureStartAngle(float x, float y) { + mStartAngle = mChart.getAngleForPoint(x, y) - mChart.getRawRotationAngle(); + } + + /** + * updates the view rotation depending on the given touch position, also + * takes the starting angle into consideration + * + * @param x + * @param y + */ + public void updateGestureRotation(float x, float y) { + mChart.setRotationAngle(mChart.getAngleForPoint(x, y) - mStartAngle); + } + + /** + * Sets the deceleration-angular-velocity to 0f + */ + public void stopDeceleration() { + mDecelerationAngularVelocity = 0.f; + } + + public void computeScroll() { + + if (mDecelerationAngularVelocity == 0.f) + return; // There's no deceleration in progress + + final long currentTime = AnimationUtils.currentAnimationTimeMillis(); + + mDecelerationAngularVelocity *= mChart.getDragDecelerationFrictionCoef(); + + final float timeInterval = (float) (currentTime - mDecelerationLastTime) / 1000.f; + + mChart.setRotationAngle(mChart.getRotationAngle() + mDecelerationAngularVelocity * timeInterval); + + mDecelerationLastTime = currentTime; + + if (Math.abs(mDecelerationAngularVelocity) >= 0.001) + Utils.postInvalidateOnAnimation(mChart); // This causes computeScroll to fire, recommended for this by Google + else + stopDeceleration(); + } + + private class AngularVelocitySample { + + public long time; + public float angle; + + public AngularVelocitySample(long time, float angle) { + this.time = time; + this.angle = angle; + } + } +} diff --git a/MPChartLib/src/main/java/com/github/mikephil/charting/matrix/Vector3.java b/MPChartLib/src/main/java/com/github/mikephil/charting/matrix/Vector3.java new file mode 100644 index 00000000..6ff9a62c --- /dev/null +++ b/MPChartLib/src/main/java/com/github/mikephil/charting/matrix/Vector3.java @@ -0,0 +1,136 @@ + +package com.github.mikephil.charting.matrix; + +/** + * Simple 3D vector class. Handles basic vector math for 3D vectors. + */ +public final class Vector3 { + public float x; + public float y; + public float z; + + public static final Vector3 ZERO = new Vector3(0, 0, 0); + public static final Vector3 UNIT_X = new Vector3(1, 0, 0); + public static final Vector3 UNIT_Y = new Vector3(0, 1, 0); + public static final Vector3 UNIT_Z = new Vector3(0, 0, 1); + + public Vector3() { + } + + public Vector3(float[] array) + { + set(array[0], array[1], array[2]); + } + + public Vector3(float xValue, float yValue, float zValue) { + set(xValue, yValue, zValue); + } + + public Vector3(Vector3 other) { + set(other); + } + + public final void add(Vector3 other) { + x += other.x; + y += other.y; + z += other.z; + } + + public final void add(float otherX, float otherY, float otherZ) { + x += otherX; + y += otherY; + z += otherZ; + } + + public final void subtract(Vector3 other) { + x -= other.x; + y -= other.y; + z -= other.z; + } + + public final void subtractMultiple(Vector3 other, float multiplicator) + { + x -= other.x * multiplicator; + y -= other.y * multiplicator; + z -= other.z * multiplicator; + } + + public final void multiply(float magnitude) { + x *= magnitude; + y *= magnitude; + z *= magnitude; + } + + public final void multiply(Vector3 other) { + x *= other.x; + y *= other.y; + z *= other.z; + } + + public final void divide(float magnitude) { + if (magnitude != 0.0f) { + x /= magnitude; + y /= magnitude; + z /= magnitude; + } + } + + public final void set(Vector3 other) { + x = other.x; + y = other.y; + z = other.z; + } + + public final void set(float xValue, float yValue, float zValue) { + x = xValue; + y = yValue; + z = zValue; + } + + public final float dot(Vector3 other) { + return (x * other.x) + (y * other.y) + (z * other.z); + } + + public final Vector3 cross(Vector3 other) { + return new Vector3(y * other.z - z * other.y, + z * other.x - x * other.z, + x * other.y - y * other.x); + } + + public final float length() { + return (float) Math.sqrt(length2()); + } + + public final float length2() { + return (x * x) + (y * y) + (z * z); + } + + public final float distance2(Vector3 other) { + float dx = x - other.x; + float dy = y - other.y; + float dz = z - other.z; + return (dx * dx) + (dy * dy) + (dz * dz); + } + + public final float normalize() { + final float magnitude = length(); + + // TODO: I'm choosing safety over speed here. + if (magnitude != 0.0f) { + x /= magnitude; + y /= magnitude; + z /= magnitude; + } + + return magnitude; + } + + public final void zero() { + set(0.0f, 0.0f, 0.0f); + } + + public final boolean pointsInSameDirection(Vector3 other) { + return this.dot(other) > 0; + } + +} diff --git a/MPChartLib/src/main/java/com/github/mikephil/charting/model/GradientColor.java b/MPChartLib/src/main/java/com/github/mikephil/charting/model/GradientColor.java new file mode 100644 index 00000000..b5c8715a --- /dev/null +++ b/MPChartLib/src/main/java/com/github/mikephil/charting/model/GradientColor.java @@ -0,0 +1,69 @@ +package com.github.mikephil.charting.model; + +import com.github.mikephil.charting.utils.Fill; + +/** + * Deprecated. Use `Fill` + */ +@Deprecated +public class GradientColor extends Fill +{ + /** + * Deprecated. Use `Fill.getGradientColors()` + */ + @Deprecated + public int getStartColor() + { + return getGradientColors()[0]; + } + + /** + * Deprecated. Use `Fill.setGradientColors(...)` + */ + @Deprecated + public void setStartColor(int startColor) + { + if (getGradientColors() == null || getGradientColors().length != 2) + { + setGradientColors(new int[]{ + startColor, + getGradientColors() != null && getGradientColors().length > 1 + ? getGradientColors()[1] + : 0 + }); + } else + { + getGradientColors()[0] = startColor; + } + } + + /** + * Deprecated. Use `Fill.getGradientColors()` + */ + @Deprecated + public int getEndColor() + { + return getGradientColors()[1]; + } + + /** + * Deprecated. Use `Fill.setGradientColors(...)` + */ + @Deprecated + public void setEndColor(int endColor) + { + if (getGradientColors() == null || getGradientColors().length != 2) + { + setGradientColors(new int[]{ + getGradientColors() != null && getGradientColors().length > 0 + ? getGradientColors()[0] + : 0, + endColor + }); + } else + { + getGradientColors()[1] = endColor; + } + } + +} diff --git a/MPChartLib/src/main/java/com/github/mikephil/charting/renderer/AxisRenderer.java b/MPChartLib/src/main/java/com/github/mikephil/charting/renderer/AxisRenderer.java new file mode 100644 index 00000000..72ea2d17 --- /dev/null +++ b/MPChartLib/src/main/java/com/github/mikephil/charting/renderer/AxisRenderer.java @@ -0,0 +1,293 @@ + +package com.github.mikephil.charting.renderer; + +import android.graphics.Canvas; +import android.graphics.Color; +import android.graphics.Paint; +import android.graphics.Paint.Style; + +import com.github.mikephil.charting.components.AxisBase; +import com.github.mikephil.charting.utils.MPPointD; +import com.github.mikephil.charting.utils.Transformer; +import com.github.mikephil.charting.utils.Utils; +import com.github.mikephil.charting.utils.ViewPortHandler; + +/** + * Baseclass of all axis renderers. + * + * @author Philipp Jahoda + */ +public abstract class AxisRenderer extends Renderer { + + /** base axis this axis renderer works with */ + protected AxisBase mAxis; + + /** transformer to transform values to screen pixels and return */ + protected Transformer mTrans; + + /** + * paint object for the grid lines + */ + protected Paint mGridPaint; + + /** + * paint for the x-label values + */ + protected Paint mAxisLabelPaint; + + /** + * paint for the line surrounding the chart + */ + protected Paint mAxisLinePaint; + + /** + * paint used for the limit lines + */ + protected Paint mLimitLinePaint; + + public AxisRenderer(ViewPortHandler viewPortHandler, Transformer trans, AxisBase axis) { + super(viewPortHandler); + + this.mTrans = trans; + this.mAxis = axis; + + if(mViewPortHandler != null) { + + mAxisLabelPaint = new Paint(Paint.ANTI_ALIAS_FLAG); + + mGridPaint = new Paint(); + mGridPaint.setColor(Color.GRAY); + mGridPaint.setStrokeWidth(1f); + mGridPaint.setStyle(Style.STROKE); + mGridPaint.setAlpha(90); + + mAxisLinePaint = new Paint(); + mAxisLinePaint.setColor(Color.BLACK); + mAxisLinePaint.setStrokeWidth(1f); + mAxisLinePaint.setStyle(Style.STROKE); + + mLimitLinePaint = new Paint(Paint.ANTI_ALIAS_FLAG); + mLimitLinePaint.setStyle(Paint.Style.STROKE); + } + } + + /** + * Returns the Paint object used for drawing the axis (labels). + * + * @return + */ + public Paint getPaintAxisLabels() { + return mAxisLabelPaint; + } + + /** + * Returns the Paint object that is used for drawing the grid-lines of the + * axis. + * + * @return + */ + public Paint getPaintGrid() { + return mGridPaint; + } + + /** + * Returns the Paint object that is used for drawing the axis-line that goes + * alongside the axis. + * + * @return + */ + public Paint getPaintAxisLine() { + return mAxisLinePaint; + } + + /** + * Returns the Transformer object used for transforming the axis values. + * + * @return + */ + public Transformer getTransformer() { + return mTrans; + } + + /** + * Computes the axis values. + * + * @param min - the minimum value in the data object for this axis + * @param max - the maximum value in the data object for this axis + */ + public void computeAxis(float min, float max, boolean inverted) { + + // calculate the starting and entry point of the y-labels (depending on + // zoom / contentrect bounds) + if (mViewPortHandler != null && mViewPortHandler.contentWidth() > 10 && !mViewPortHandler.isFullyZoomedOutY()) { + + MPPointD p1 = mTrans.getValuesByTouchPoint(mViewPortHandler.contentLeft(), mViewPortHandler.contentTop()); + MPPointD p2 = mTrans.getValuesByTouchPoint(mViewPortHandler.contentLeft(), mViewPortHandler.contentBottom()); + + if (!inverted) { + + min = (float) p2.y; + max = (float) p1.y; + } else { + + min = (float) p1.y; + max = (float) p2.y; + } + + MPPointD.recycleInstance(p1); + MPPointD.recycleInstance(p2); + } + + computeAxisValues(min, max); + } + + /** + * Sets up the axis values. Computes the desired number of labels between the two given extremes. + * + * @return + */ + protected void computeAxisValues(float min, float max) { + + float yMin = min; + float yMax = max; + + int labelCount = mAxis.getLabelCount(); + double range = Math.abs(yMax - yMin); + + if (labelCount == 0 || range <= 0 || Double.isInfinite(range)) { + mAxis.mEntries = new float[]{}; + mAxis.mCenteredEntries = new float[]{}; + mAxis.mEntryCount = 0; + return; + } + + // Find out how much spacing (in y value space) between axis values + double rawInterval = range / labelCount; + double interval = Utils.roundToNextSignificant(rawInterval); + + // If granularity is enabled, then do not allow the interval to go below specified granularity. + // This is used to avoid repeated values when rounding values for display. + if (mAxis.isGranularityEnabled()) + interval = interval < mAxis.getGranularity() ? mAxis.getGranularity() : interval; + + // Normalize interval + double intervalMagnitude = Utils.roundToNextSignificant(Math.pow(10, (int) Math.log10(interval))); + int intervalSigDigit = (int) (interval / intervalMagnitude); + if (intervalSigDigit > 5) { + // Use one order of magnitude higher, to avoid intervals like 0.9 or 90 + // if it's 0.0 after floor(), we use the old value + interval = Math.floor(10.0 * intervalMagnitude) == 0.0 + ? interval + : Math.floor(10.0 * intervalMagnitude); + + } + + int n = mAxis.isCenterAxisLabelsEnabled() ? 1 : 0; + + // force label count + if (mAxis.isForceLabelsEnabled()) { + + interval = (float) range / (float) (labelCount - 1); + mAxis.mEntryCount = labelCount; + + if (mAxis.mEntries.length < labelCount) { + // Ensure stops contains at least numStops elements. + mAxis.mEntries = new float[labelCount]; + } + + float v = min; + + for (int i = 0; i < labelCount; i++) { + mAxis.mEntries[i] = v; + v += interval; + } + + n = labelCount; + + // no forced count + } else { + + double first = interval == 0.0 ? 0.0 : Math.ceil(yMin / interval) * interval; + if(mAxis.isCenterAxisLabelsEnabled()) { + first -= interval; + } + + double last = interval == 0.0 ? 0.0 : Utils.nextUp(Math.floor(yMax / interval) * interval); + + double f; + int i; + + if (interval != 0.0 && last != first) { + for (f = first; f <= last; f += interval) { + ++n; + } + } + else if (last == first && n == 0) { + n = 1; + } + + mAxis.mEntryCount = n; + + if (mAxis.mEntries.length < n) { + // Ensure stops contains at least numStops elements. + mAxis.mEntries = new float[n]; + } + + for (f = first, i = 0; i < n; f += interval, ++i) { + + if (f == 0.0) // Fix for negative zero case (Where value == -0.0, and 0.0 == -0.0) + f = 0.0; + + mAxis.mEntries[i] = (float) f; + } + } + + // set decimals + if (interval < 1) { + mAxis.mDecimals = (int) Math.ceil(-Math.log10(interval)); + } else { + mAxis.mDecimals = 0; + } + + if (mAxis.isCenterAxisLabelsEnabled()) { + + if (mAxis.mCenteredEntries.length < n) { + mAxis.mCenteredEntries = new float[n]; + } + + float offset = (float)interval / 2f; + + for (int i = 0; i < n; i++) { + mAxis.mCenteredEntries[i] = mAxis.mEntries[i] + offset; + } + } + } + + /** + * Draws the axis labels to the screen. + * + * @param c + */ + public abstract void renderAxisLabels(Canvas c); + + /** + * Draws the grid lines belonging to the axis. + * + * @param c + */ + public abstract void renderGridLines(Canvas c); + + /** + * Draws the line that goes alongside the axis. + * + * @param c + */ + public abstract void renderAxisLine(Canvas c); + + /** + * Draws the LimitLines associated with this axis to the screen. + * + * @param c + */ + public abstract void renderLimitLines(Canvas c); +} diff --git a/MPChartLib/src/main/java/com/github/mikephil/charting/renderer/BarChartRenderer.java b/MPChartLib/src/main/java/com/github/mikephil/charting/renderer/BarChartRenderer.java new file mode 100644 index 00000000..1656a3a3 --- /dev/null +++ b/MPChartLib/src/main/java/com/github/mikephil/charting/renderer/BarChartRenderer.java @@ -0,0 +1,498 @@ + +package com.github.mikephil.charting.renderer; + +import android.graphics.Canvas; +import android.graphics.Color; +import android.graphics.Paint; +import android.graphics.RectF; +import android.graphics.drawable.Drawable; + +import com.github.mikephil.charting.animation.ChartAnimator; +import com.github.mikephil.charting.buffer.BarBuffer; +import com.github.mikephil.charting.data.BarData; +import com.github.mikephil.charting.data.BarEntry; +import com.github.mikephil.charting.highlight.Highlight; +import com.github.mikephil.charting.highlight.Range; +import com.github.mikephil.charting.interfaces.dataprovider.BarDataProvider; +import com.github.mikephil.charting.interfaces.datasets.IBarDataSet; +import com.github.mikephil.charting.utils.Fill; +import com.github.mikephil.charting.utils.MPPointF; +import com.github.mikephil.charting.utils.Transformer; +import com.github.mikephil.charting.utils.Utils; +import com.github.mikephil.charting.utils.ViewPortHandler; + +import java.util.List; + +public class BarChartRenderer extends BarLineScatterCandleBubbleRenderer { + + protected BarDataProvider mChart; + + /** + * the rect object that is used for drawing the bars + */ + protected RectF mBarRect = new RectF(); + + protected BarBuffer[] mBarBuffers; + + protected Paint mShadowPaint; + protected Paint mBarBorderPaint; + + public BarChartRenderer(BarDataProvider chart, ChartAnimator animator, + ViewPortHandler viewPortHandler) { + super(animator, viewPortHandler); + this.mChart = chart; + + mHighlightPaint = new Paint(Paint.ANTI_ALIAS_FLAG); + mHighlightPaint.setStyle(Paint.Style.FILL); + mHighlightPaint.setColor(Color.rgb(0, 0, 0)); + // set alpha after color + mHighlightPaint.setAlpha(120); + + mShadowPaint = new Paint(Paint.ANTI_ALIAS_FLAG); + mShadowPaint.setStyle(Paint.Style.FILL); + + mBarBorderPaint = new Paint(Paint.ANTI_ALIAS_FLAG); + mBarBorderPaint.setStyle(Paint.Style.STROKE); + } + + @Override + public void initBuffers() { + + BarData barData = mChart.getBarData(); + mBarBuffers = new BarBuffer[barData.getDataSetCount()]; + + for (int i = 0; i < mBarBuffers.length; i++) { + IBarDataSet set = barData.getDataSetByIndex(i); + mBarBuffers[i] = new BarBuffer(set.getEntryCount() * 4 * (set.isStacked() ? set.getStackSize() : 1), + barData.getDataSetCount(), set.isStacked()); + } + } + + @Override + public void drawData(Canvas c) { + + BarData barData = mChart.getBarData(); + + for (int i = 0; i < barData.getDataSetCount(); i++) { + + IBarDataSet set = barData.getDataSetByIndex(i); + + if (set.isVisible()) { + drawDataSet(c, set, i); + } + } + } + + private RectF mBarShadowRectBuffer = new RectF(); + + protected void drawDataSet(Canvas c, IBarDataSet dataSet, int index) { + + Transformer trans = mChart.getTransformer(dataSet.getAxisDependency()); + + mBarBorderPaint.setColor(dataSet.getBarBorderColor()); + mBarBorderPaint.setStrokeWidth(Utils.convertDpToPixel(dataSet.getBarBorderWidth())); + + final boolean drawBorder = dataSet.getBarBorderWidth() > 0.f; + + float phaseX = mAnimator.getPhaseX(); + float phaseY = mAnimator.getPhaseY(); + + // draw the bar shadow before the values + if (mChart.isDrawBarShadowEnabled()) { + mShadowPaint.setColor(dataSet.getBarShadowColor()); + + BarData barData = mChart.getBarData(); + + final float barWidth = barData.getBarWidth(); + final float barWidthHalf = barWidth / 2.0f; + float x; + + for (int i = 0, count = Math.min((int)(Math.ceil((float)(dataSet.getEntryCount()) * phaseX)), dataSet.getEntryCount()); + i < count; + i++) { + + BarEntry e = dataSet.getEntryForIndex(i); + + x = e.getX(); + + mBarShadowRectBuffer.left = x - barWidthHalf; + mBarShadowRectBuffer.right = x + barWidthHalf; + + trans.rectValueToPixel(mBarShadowRectBuffer); + + if (!mViewPortHandler.isInBoundsLeft(mBarShadowRectBuffer.right)) + continue; + + if (!mViewPortHandler.isInBoundsRight(mBarShadowRectBuffer.left)) + break; + + mBarShadowRectBuffer.top = mViewPortHandler.contentTop(); + mBarShadowRectBuffer.bottom = mViewPortHandler.contentBottom(); + + c.drawRect(mBarShadowRectBuffer, mShadowPaint); + } + } + + // initialize the buffer + BarBuffer buffer = mBarBuffers[index]; + buffer.setPhases(phaseX, phaseY); + buffer.setDataSet(index); + buffer.setInverted(mChart.isInverted(dataSet.getAxisDependency())); + buffer.setBarWidth(mChart.getBarData().getBarWidth()); + + buffer.feed(dataSet); + + trans.pointValuesToPixel(buffer.buffer); + + final boolean isCustomFill = dataSet.getFills() != null && !dataSet.getFills().isEmpty(); + final boolean isSingleColor = dataSet.getColors().size() == 1; + final boolean isInverted = mChart.isInverted(dataSet.getAxisDependency()); + + if (isSingleColor) { + mRenderPaint.setColor(dataSet.getColor()); + } + + for (int j = 0, pos = 0; j < buffer.size(); j += 4, pos++) { + + if (!mViewPortHandler.isInBoundsLeft(buffer.buffer[j + 2])) + continue; + + if (!mViewPortHandler.isInBoundsRight(buffer.buffer[j])) + break; + + if (!isSingleColor) { + // Set the color for the currently drawn value. If the index + // is out of bounds, reuse colors. + mRenderPaint.setColor(dataSet.getColor(pos)); + } + + if (isCustomFill) { + dataSet.getFill(pos) + .fillRect( + c, mRenderPaint, + buffer.buffer[j], + buffer.buffer[j + 1], + buffer.buffer[j + 2], + buffer.buffer[j + 3], + isInverted ? Fill.Direction.DOWN : Fill.Direction.UP); + } + else { + c.drawRect(buffer.buffer[j], buffer.buffer[j + 1], buffer.buffer[j + 2], + buffer.buffer[j + 3], mRenderPaint); + } + + if (drawBorder) { + c.drawRect(buffer.buffer[j], buffer.buffer[j + 1], buffer.buffer[j + 2], + buffer.buffer[j + 3], mBarBorderPaint); + } + } + } + + protected void prepareBarHighlight(float x, float y1, float y2, float barWidthHalf, Transformer trans) { + + float left = x - barWidthHalf; + float right = x + barWidthHalf; + float top = y1; + float bottom = y2; + + mBarRect.set(left, top, right, bottom); + + trans.rectToPixelPhase(mBarRect, mAnimator.getPhaseY()); + } + + @Override + public void drawValues(Canvas c) { + + // if values are drawn + if (isDrawingValuesAllowed(mChart)) { + + List<IBarDataSet> dataSets = mChart.getBarData().getDataSets(); + + final float valueOffsetPlus = Utils.convertDpToPixel(4.5f); + float posOffset = 0f; + float negOffset = 0f; + boolean drawValueAboveBar = mChart.isDrawValueAboveBarEnabled(); + + for (int i = 0; i < mChart.getBarData().getDataSetCount(); i++) { + + IBarDataSet dataSet = dataSets.get(i); + + if (!shouldDrawValues(dataSet)) + continue; + + // apply the text-styling defined by the DataSet + applyValueTextStyle(dataSet); + + boolean isInverted = mChart.isInverted(dataSet.getAxisDependency()); + + // calculate the correct offset depending on the draw position of + // the value + float valueTextHeight = Utils.calcTextHeight(mValuePaint, "8"); + posOffset = (drawValueAboveBar ? -valueOffsetPlus : valueTextHeight + valueOffsetPlus); + negOffset = (drawValueAboveBar ? valueTextHeight + valueOffsetPlus : -valueOffsetPlus); + + if (isInverted) { + posOffset = -posOffset - valueTextHeight; + negOffset = -negOffset - valueTextHeight; + } + + // get the buffer + BarBuffer buffer = mBarBuffers[i]; + + final float phaseY = mAnimator.getPhaseY(); + + MPPointF iconsOffset = MPPointF.getInstance(dataSet.getIconsOffset()); + iconsOffset.x = Utils.convertDpToPixel(iconsOffset.x); + iconsOffset.y = Utils.convertDpToPixel(iconsOffset.y); + + // if only single values are drawn (sum) + if (!dataSet.isStacked()) { + + for (int j = 0; j < buffer.buffer.length * mAnimator.getPhaseX(); j += 4) { + + float x = (buffer.buffer[j] + buffer.buffer[j + 2]) / 2f; + + if (!mViewPortHandler.isInBoundsRight(x)) + break; + + if (!mViewPortHandler.isInBoundsY(buffer.buffer[j + 1]) + || !mViewPortHandler.isInBoundsLeft(x)) + continue; + + BarEntry entry = dataSet.getEntryForIndex(j / 4); + float val = entry.getY(); + + if (dataSet.isDrawValuesEnabled()) { + drawValue(c, dataSet.getValueFormatter(), val, entry, i, x, + val >= 0 ? + (buffer.buffer[j + 1] + posOffset) : + (buffer.buffer[j + 3] + negOffset), + dataSet.getValueTextColor(j / 4)); + } + + if (entry.getIcon() != null && dataSet.isDrawIconsEnabled()) { + + Drawable icon = entry.getIcon(); + + float px = x; + float py = val >= 0 ? + (buffer.buffer[j + 1] + posOffset) : + (buffer.buffer[j + 3] + negOffset); + + px += iconsOffset.x; + py += iconsOffset.y; + + Utils.drawImage( + c, + icon, + (int)px, + (int)py, + icon.getIntrinsicWidth(), + icon.getIntrinsicHeight()); + } + } + + // if we have stacks + } else { + + Transformer trans = mChart.getTransformer(dataSet.getAxisDependency()); + + int bufferIndex = 0; + int index = 0; + + while (index < dataSet.getEntryCount() * mAnimator.getPhaseX()) { + + BarEntry entry = dataSet.getEntryForIndex(index); + + float[] vals = entry.getYVals(); + float x = (buffer.buffer[bufferIndex] + buffer.buffer[bufferIndex + 2]) / 2f; + + int color = dataSet.getValueTextColor(index); + + // we still draw stacked bars, but there is one + // non-stacked + // in between + if (vals == null) { + + if (!mViewPortHandler.isInBoundsRight(x)) + break; + + if (!mViewPortHandler.isInBoundsY(buffer.buffer[bufferIndex + 1]) + || !mViewPortHandler.isInBoundsLeft(x)) + continue; + + if (dataSet.isDrawValuesEnabled()) { + drawValue(c, dataSet.getValueFormatter(), entry.getY(), entry, i, x, + buffer.buffer[bufferIndex + 1] + + (entry.getY() >= 0 ? posOffset : negOffset), + color); + } + + if (entry.getIcon() != null && dataSet.isDrawIconsEnabled()) { + + Drawable icon = entry.getIcon(); + + float px = x; + float py = buffer.buffer[bufferIndex + 1] + + (entry.getY() >= 0 ? posOffset : negOffset); + + px += iconsOffset.x; + py += iconsOffset.y; + + Utils.drawImage( + c, + icon, + (int)px, + (int)py, + icon.getIntrinsicWidth(), + icon.getIntrinsicHeight()); + } + + // draw stack values + } else { + + float[] transformed = new float[vals.length * 2]; + + float posY = 0f; + float negY = -entry.getNegativeSum(); + + for (int k = 0, idx = 0; k < transformed.length; k += 2, idx++) { + + float value = vals[idx]; + float y; + + if (value == 0.0f && (posY == 0.0f || negY == 0.0f)) { + // Take care of the situation of a 0.0 value, which overlaps a non-zero bar + y = value; + } else if (value >= 0.0f) { + posY += value; + y = posY; + } else { + y = negY; + negY -= value; + } + + transformed[k + 1] = y * phaseY; + } + + trans.pointValuesToPixel(transformed); + + for (int k = 0; k < transformed.length; k += 2) { + + final float val = vals[k / 2]; + final boolean drawBelow = + (val == 0.0f && negY == 0.0f && posY > 0.0f) || + val < 0.0f; + float y = transformed[k + 1] + + (drawBelow ? negOffset : posOffset); + + if (!mViewPortHandler.isInBoundsRight(x)) + break; + + if (!mViewPortHandler.isInBoundsY(y) + || !mViewPortHandler.isInBoundsLeft(x)) + continue; + + if (dataSet.isDrawValuesEnabled()) { + drawValue(c, + dataSet.getValueFormatter(), + vals[k / 2], + entry, + i, + x, + y, + color); + } + + if (entry.getIcon() != null && dataSet.isDrawIconsEnabled()) { + + Drawable icon = entry.getIcon(); + + Utils.drawImage( + c, + icon, + (int)(x + iconsOffset.x), + (int)(y + iconsOffset.y), + icon.getIntrinsicWidth(), + icon.getIntrinsicHeight()); + } + } + } + + bufferIndex = vals == null ? bufferIndex + 4 : bufferIndex + 4 * vals.length; + index++; + } + } + + MPPointF.recycleInstance(iconsOffset); + } + } + } + + @Override + public void drawHighlighted(Canvas c, Highlight[] indices) { + + BarData barData = mChart.getBarData(); + + for (Highlight high : indices) { + + IBarDataSet set = barData.getDataSetByIndex(high.getDataSetIndex()); + + if (set == null || !set.isHighlightEnabled()) + continue; + + BarEntry e = set.getEntryForXValue(high.getX(), high.getY()); + + if (!isInBoundsX(e, set)) + continue; + + Transformer trans = mChart.getTransformer(set.getAxisDependency()); + + mHighlightPaint.setColor(set.getHighLightColor()); + mHighlightPaint.setAlpha(set.getHighLightAlpha()); + + boolean isStack = (high.getStackIndex() >= 0 && e.isStacked()) ? true : false; + + final float y1; + final float y2; + + if (isStack) { + + if(mChart.isHighlightFullBarEnabled()) { + + y1 = e.getPositiveSum(); + y2 = -e.getNegativeSum(); + + } else { + + Range range = e.getRanges()[high.getStackIndex()]; + + y1 = range.from; + y2 = range.to; + } + + } else { + y1 = e.getY(); + y2 = 0.f; + } + + prepareBarHighlight(e.getX(), y1, y2, barData.getBarWidth() / 2f, trans); + + setHighlightDrawPos(high, mBarRect); + + c.drawRect(mBarRect, mHighlightPaint); + } + } + + /** + * Sets the drawing position of the highlight object based on the riven bar-rect. + * @param high + */ + protected void setHighlightDrawPos(Highlight high, RectF bar) { + high.setDraw(bar.centerX(), bar.top); + } + + @Override + public void drawExtras(Canvas c) { + } +} diff --git a/MPChartLib/src/main/java/com/github/mikephil/charting/renderer/BarLineScatterCandleBubbleRenderer.java b/MPChartLib/src/main/java/com/github/mikephil/charting/renderer/BarLineScatterCandleBubbleRenderer.java new file mode 100644 index 00000000..06599187 --- /dev/null +++ b/MPChartLib/src/main/java/com/github/mikephil/charting/renderer/BarLineScatterCandleBubbleRenderer.java @@ -0,0 +1,96 @@ +package com.github.mikephil.charting.renderer; + +import com.github.mikephil.charting.animation.ChartAnimator; +import com.github.mikephil.charting.data.DataSet; +import com.github.mikephil.charting.data.Entry; +import com.github.mikephil.charting.interfaces.dataprovider.BarLineScatterCandleBubbleDataProvider; +import com.github.mikephil.charting.interfaces.datasets.IBarLineScatterCandleBubbleDataSet; +import com.github.mikephil.charting.interfaces.datasets.IDataSet; +import com.github.mikephil.charting.utils.ViewPortHandler; + +/** + * Created by Philipp Jahoda on 09/06/16. + */ +public abstract class BarLineScatterCandleBubbleRenderer extends DataRenderer { + + /** + * buffer for storing the current minimum and maximum visible x + */ + protected XBounds mXBounds = new XBounds(); + + public BarLineScatterCandleBubbleRenderer(ChartAnimator animator, ViewPortHandler viewPortHandler) { + super(animator, viewPortHandler); + } + + /** + * Returns true if the DataSet values should be drawn, false if not. + * + * @param set + * @return + */ + protected boolean shouldDrawValues(IDataSet set) { + return set.isVisible() && (set.isDrawValuesEnabled() || set.isDrawIconsEnabled()); + } + + /** + * Checks if the provided entry object is in bounds for drawing considering the current animation phase. + * + * @param e + * @param set + * @return + */ + protected boolean isInBoundsX(Entry e, IBarLineScatterCandleBubbleDataSet set) { + + if (e == null) + return false; + + float entryIndex = set.getEntryIndex(e); + + if (e == null || entryIndex >= set.getEntryCount() * mAnimator.getPhaseX()) { + return false; + } else { + return true; + } + } + + /** + * Class representing the bounds of the current viewport in terms of indices in the values array of a DataSet. + */ + protected class XBounds { + + /** + * minimum visible entry index + */ + public int min; + + /** + * maximum visible entry index + */ + public int max; + + /** + * range of visible entry indices + */ + public int range; + + /** + * Calculates the minimum and maximum x values as well as the range between them. + * + * @param chart + * @param dataSet + */ + public void set(BarLineScatterCandleBubbleDataProvider chart, IBarLineScatterCandleBubbleDataSet dataSet) { + float phaseX = Math.max(0.f, Math.min(1.f, mAnimator.getPhaseX())); + + float low = chart.getLowestVisibleX(); + float high = chart.getHighestVisibleX(); + + Entry entryFrom = dataSet.getEntryForXValue(low, Float.NaN, DataSet.Rounding.DOWN); + Entry entryTo = dataSet.getEntryForXValue(high, Float.NaN, DataSet.Rounding.UP); + + min = entryFrom == null ? 0 : dataSet.getEntryIndex(entryFrom); + max = entryTo == null ? 0 : dataSet.getEntryIndex(entryTo); + range = (int) ((max - min) * phaseX); + } + } +} diff --git a/MPChartLib/src/main/java/com/github/mikephil/charting/renderer/BubbleChartRenderer.java b/MPChartLib/src/main/java/com/github/mikephil/charting/renderer/BubbleChartRenderer.java new file mode 100644 index 00000000..5ce19c2c --- /dev/null +++ b/MPChartLib/src/main/java/com/github/mikephil/charting/renderer/BubbleChartRenderer.java @@ -0,0 +1,274 @@ + +package com.github.mikephil.charting.renderer; + +import android.graphics.Canvas; +import android.graphics.Color; +import android.graphics.Paint.Style; +import android.graphics.drawable.Drawable; + +import com.github.mikephil.charting.animation.ChartAnimator; +import com.github.mikephil.charting.data.BubbleData; +import com.github.mikephil.charting.data.BubbleEntry; +import com.github.mikephil.charting.highlight.Highlight; +import com.github.mikephil.charting.interfaces.dataprovider.BubbleDataProvider; +import com.github.mikephil.charting.interfaces.datasets.IBubbleDataSet; +import com.github.mikephil.charting.utils.MPPointF; +import com.github.mikephil.charting.utils.Transformer; +import com.github.mikephil.charting.utils.Utils; +import com.github.mikephil.charting.utils.ViewPortHandler; + +import java.util.List; + +/** + * Bubble chart implementation: Copyright 2015 Pierre-Marc Airoldi Licensed + * under Apache License 2.0 Ported by Daniel Cohen Gindi + */ +public class BubbleChartRenderer extends BarLineScatterCandleBubbleRenderer { + + protected BubbleDataProvider mChart; + + public BubbleChartRenderer(BubbleDataProvider chart, ChartAnimator animator, + ViewPortHandler viewPortHandler) { + super(animator, viewPortHandler); + mChart = chart; + + mRenderPaint.setStyle(Style.FILL); + + mHighlightPaint.setStyle(Style.STROKE); + mHighlightPaint.setStrokeWidth(Utils.convertDpToPixel(1.5f)); + } + + @Override + public void initBuffers() { + + } + + @Override + public void drawData(Canvas c) { + + BubbleData bubbleData = mChart.getBubbleData(); + + for (IBubbleDataSet set : bubbleData.getDataSets()) { + + if (set.isVisible()) + drawDataSet(c, set); + } + } + + private float[] sizeBuffer = new float[4]; + private float[] pointBuffer = new float[2]; + + protected float getShapeSize(float entrySize, float maxSize, float reference, boolean normalizeSize) { + final float factor = normalizeSize ? ((maxSize == 0f) ? 1f : (float) Math.sqrt(entrySize / maxSize)) : + entrySize; + final float shapeSize = reference * factor; + return shapeSize; + } + + protected void drawDataSet(Canvas c, IBubbleDataSet dataSet) { + + if (dataSet.getEntryCount() < 1) + return; + + Transformer trans = mChart.getTransformer(dataSet.getAxisDependency()); + + float phaseY = mAnimator.getPhaseY(); + + mXBounds.set(mChart, dataSet); + + sizeBuffer[0] = 0f; + sizeBuffer[2] = 1f; + + trans.pointValuesToPixel(sizeBuffer); + + boolean normalizeSize = dataSet.isNormalizeSizeEnabled(); + + // calcualte the full width of 1 step on the x-axis + final float maxBubbleWidth = Math.abs(sizeBuffer[2] - sizeBuffer[0]); + final float maxBubbleHeight = Math.abs(mViewPortHandler.contentBottom() - mViewPortHandler.contentTop()); + final float referenceSize = Math.min(maxBubbleHeight, maxBubbleWidth); + + for (int j = mXBounds.min; j <= mXBounds.range + mXBounds.min; j++) { + + final BubbleEntry entry = dataSet.getEntryForIndex(j); + + pointBuffer[0] = entry.getX(); + pointBuffer[1] = (entry.getY()) * phaseY; + trans.pointValuesToPixel(pointBuffer); + + float shapeHalf = getShapeSize(entry.getSize(), dataSet.getMaxSize(), referenceSize, normalizeSize) / 2f; + + if (!mViewPortHandler.isInBoundsTop(pointBuffer[1] + shapeHalf) + || !mViewPortHandler.isInBoundsBottom(pointBuffer[1] - shapeHalf)) + continue; + + if (!mViewPortHandler.isInBoundsLeft(pointBuffer[0] + shapeHalf)) + continue; + + if (!mViewPortHandler.isInBoundsRight(pointBuffer[0] - shapeHalf)) + break; + + final int color = dataSet.getColor(j); + + mRenderPaint.setColor(color); + c.drawCircle(pointBuffer[0], pointBuffer[1], shapeHalf, mRenderPaint); + } + } + + @Override + public void drawValues(Canvas c) { + + BubbleData bubbleData = mChart.getBubbleData(); + + if (bubbleData == null) + return; + + // if values are drawn + if (isDrawingValuesAllowed(mChart)) { + + final List<IBubbleDataSet> dataSets = bubbleData.getDataSets(); + + float lineHeight = Utils.calcTextHeight(mValuePaint, "1"); + + for (int i = 0; i < dataSets.size(); i++) { + + IBubbleDataSet dataSet = dataSets.get(i); + + if (!shouldDrawValues(dataSet) || dataSet.getEntryCount() < 1) + continue; + + // apply the text-styling defined by the DataSet + applyValueTextStyle(dataSet); + + final float phaseX = Math.max(0.f, Math.min(1.f, mAnimator.getPhaseX())); + final float phaseY = mAnimator.getPhaseY(); + + mXBounds.set(mChart, dataSet); + + final float[] positions = mChart.getTransformer(dataSet.getAxisDependency()) + .generateTransformedValuesBubble(dataSet, phaseY, mXBounds.min, mXBounds.max); + + final float alpha = phaseX == 1 ? phaseY : phaseX; + + MPPointF iconsOffset = MPPointF.getInstance(dataSet.getIconsOffset()); + iconsOffset.x = Utils.convertDpToPixel(iconsOffset.x); + iconsOffset.y = Utils.convertDpToPixel(iconsOffset.y); + + for (int j = 0; j < positions.length; j += 2) { + + int valueTextColor = dataSet.getValueTextColor(j / 2 + mXBounds.min); + valueTextColor = Color.argb(Math.round(255.f * alpha), Color.red(valueTextColor), + Color.green(valueTextColor), Color.blue(valueTextColor)); + + float x = positions[j]; + float y = positions[j + 1]; + + if (!mViewPortHandler.isInBoundsRight(x)) + break; + + if ((!mViewPortHandler.isInBoundsLeft(x) || !mViewPortHandler.isInBoundsY(y))) + continue; + + BubbleEntry entry = dataSet.getEntryForIndex(j / 2 + mXBounds.min); + + if (dataSet.isDrawValuesEnabled()) { + drawValue(c, dataSet.getValueFormatter(), entry.getSize(), entry, i, x, + y + (0.5f * lineHeight), valueTextColor); + } + + if (entry.getIcon() != null && dataSet.isDrawIconsEnabled()) { + + Drawable icon = entry.getIcon(); + + Utils.drawImage( + c, + icon, + (int)(x + iconsOffset.x), + (int)(y + iconsOffset.y), + icon.getIntrinsicWidth(), + icon.getIntrinsicHeight()); + } + } + + MPPointF.recycleInstance(iconsOffset); + } + } + } + + @Override + public void drawExtras(Canvas c) { + } + + private float[] _hsvBuffer = new float[3]; + + @Override + public void drawHighlighted(Canvas c, Highlight[] indices) { + + BubbleData bubbleData = mChart.getBubbleData(); + + float phaseY = mAnimator.getPhaseY(); + + for (Highlight high : indices) { + + IBubbleDataSet set = bubbleData.getDataSetByIndex(high.getDataSetIndex()); + + if (set == null || !set.isHighlightEnabled()) + continue; + + final BubbleEntry entry = set.getEntryForXValue(high.getX(), high.getY()); + + if (entry.getY() != high.getY()) + continue; + + if (!isInBoundsX(entry, set)) + continue; + + Transformer trans = mChart.getTransformer(set.getAxisDependency()); + + sizeBuffer[0] = 0f; + sizeBuffer[2] = 1f; + + trans.pointValuesToPixel(sizeBuffer); + + boolean normalizeSize = set.isNormalizeSizeEnabled(); + + // calcualte the full width of 1 step on the x-axis + final float maxBubbleWidth = Math.abs(sizeBuffer[2] - sizeBuffer[0]); + final float maxBubbleHeight = Math.abs( + mViewPortHandler.contentBottom() - mViewPortHandler.contentTop()); + final float referenceSize = Math.min(maxBubbleHeight, maxBubbleWidth); + + pointBuffer[0] = entry.getX(); + pointBuffer[1] = (entry.getY()) * phaseY; + trans.pointValuesToPixel(pointBuffer); + + high.setDraw(pointBuffer[0], pointBuffer[1]); + + float shapeHalf = getShapeSize(entry.getSize(), + set.getMaxSize(), + referenceSize, + normalizeSize) / 2f; + + if (!mViewPortHandler.isInBoundsTop(pointBuffer[1] + shapeHalf) + || !mViewPortHandler.isInBoundsBottom(pointBuffer[1] - shapeHalf)) + continue; + + if (!mViewPortHandler.isInBoundsLeft(pointBuffer[0] + shapeHalf)) + continue; + + if (!mViewPortHandler.isInBoundsRight(pointBuffer[0] - shapeHalf)) + break; + + final int originalColor = set.getColor((int) entry.getX()); + + Color.RGBToHSV(Color.red(originalColor), Color.green(originalColor), + Color.blue(originalColor), _hsvBuffer); + _hsvBuffer[2] *= 0.5f; + final int color = Color.HSVToColor(Color.alpha(originalColor), _hsvBuffer); + + mHighlightPaint.setColor(color); + mHighlightPaint.setStrokeWidth(set.getHighlightCircleWidth()); + c.drawCircle(pointBuffer[0], pointBuffer[1], shapeHalf, mHighlightPaint); + } + } +} diff --git a/MPChartLib/src/main/java/com/github/mikephil/charting/renderer/CandleStickChartRenderer.java b/MPChartLib/src/main/java/com/github/mikephil/charting/renderer/CandleStickChartRenderer.java new file mode 100644 index 00000000..991b7021 --- /dev/null +++ b/MPChartLib/src/main/java/com/github/mikephil/charting/renderer/CandleStickChartRenderer.java @@ -0,0 +1,363 @@ + +package com.github.mikephil.charting.renderer; + +import android.graphics.Canvas; +import android.graphics.Paint; +import android.graphics.drawable.Drawable; + +import com.github.mikephil.charting.animation.ChartAnimator; +import com.github.mikephil.charting.data.CandleData; +import com.github.mikephil.charting.data.CandleEntry; +import com.github.mikephil.charting.highlight.Highlight; +import com.github.mikephil.charting.interfaces.dataprovider.CandleDataProvider; +import com.github.mikephil.charting.interfaces.datasets.ICandleDataSet; +import com.github.mikephil.charting.utils.ColorTemplate; +import com.github.mikephil.charting.utils.MPPointD; +import com.github.mikephil.charting.utils.MPPointF; +import com.github.mikephil.charting.utils.Transformer; +import com.github.mikephil.charting.utils.Utils; +import com.github.mikephil.charting.utils.ViewPortHandler; + +import java.util.List; + +public class CandleStickChartRenderer extends LineScatterCandleRadarRenderer { + + protected CandleDataProvider mChart; + + private float[] mShadowBuffers = new float[8]; + private float[] mBodyBuffers = new float[4]; + private float[] mRangeBuffers = new float[4]; + private float[] mOpenBuffers = new float[4]; + private float[] mCloseBuffers = new float[4]; + + public CandleStickChartRenderer(CandleDataProvider chart, ChartAnimator animator, + ViewPortHandler viewPortHandler) { + super(animator, viewPortHandler); + mChart = chart; + } + + @Override + public void initBuffers() { + + } + + @Override + public void drawData(Canvas c) { + + CandleData candleData = mChart.getCandleData(); + + for (ICandleDataSet set : candleData.getDataSets()) { + + if (set.isVisible()) + drawDataSet(c, set); + } + } + + @SuppressWarnings("ResourceAsColor") + protected void drawDataSet(Canvas c, ICandleDataSet dataSet) { + + Transformer trans = mChart.getTransformer(dataSet.getAxisDependency()); + + float phaseY = mAnimator.getPhaseY(); + float barSpace = dataSet.getBarSpace(); + boolean showCandleBar = dataSet.getShowCandleBar(); + + mXBounds.set(mChart, dataSet); + + mRenderPaint.setStrokeWidth(dataSet.getShadowWidth()); + + // draw the body + for (int j = mXBounds.min; j <= mXBounds.range + mXBounds.min; j++) { + + // get the entry + CandleEntry e = dataSet.getEntryForIndex(j); + + if (e == null) + continue; + + final float xPos = e.getX(); + + final float open = e.getOpen(); + final float close = e.getClose(); + final float high = e.getHigh(); + final float low = e.getLow(); + + if (showCandleBar) { + // calculate the shadow + + mShadowBuffers[0] = xPos; + mShadowBuffers[2] = xPos; + mShadowBuffers[4] = xPos; + mShadowBuffers[6] = xPos; + + if (open > close) { + mShadowBuffers[1] = high * phaseY; + mShadowBuffers[3] = open * phaseY; + mShadowBuffers[5] = low * phaseY; + mShadowBuffers[7] = close * phaseY; + } else if (open < close) { + mShadowBuffers[1] = high * phaseY; + mShadowBuffers[3] = close * phaseY; + mShadowBuffers[5] = low * phaseY; + mShadowBuffers[7] = open * phaseY; + } else { + mShadowBuffers[1] = high * phaseY; + mShadowBuffers[3] = open * phaseY; + mShadowBuffers[5] = low * phaseY; + mShadowBuffers[7] = mShadowBuffers[3]; + } + + trans.pointValuesToPixel(mShadowBuffers); + + // draw the shadows + + if (dataSet.getShadowColorSameAsCandle()) { + + if (open > close) + mRenderPaint.setColor( + dataSet.getDecreasingColor() == ColorTemplate.COLOR_NONE ? + dataSet.getColor(j) : + dataSet.getDecreasingColor() + ); + + else if (open < close) + mRenderPaint.setColor( + dataSet.getIncreasingColor() == ColorTemplate.COLOR_NONE ? + dataSet.getColor(j) : + dataSet.getIncreasingColor() + ); + + else + mRenderPaint.setColor( + dataSet.getNeutralColor() == ColorTemplate.COLOR_NONE ? + dataSet.getColor(j) : + dataSet.getNeutralColor() + ); + + } else { + mRenderPaint.setColor( + dataSet.getShadowColor() == ColorTemplate.COLOR_NONE ? + dataSet.getColor(j) : + dataSet.getShadowColor() + ); + } + + mRenderPaint.setStyle(Paint.Style.STROKE); + + c.drawLines(mShadowBuffers, mRenderPaint); + + // calculate the body + + mBodyBuffers[0] = xPos - 0.5f + barSpace; + mBodyBuffers[1] = close * phaseY; + mBodyBuffers[2] = (xPos + 0.5f - barSpace); + mBodyBuffers[3] = open * phaseY; + + trans.pointValuesToPixel(mBodyBuffers); + + // draw body differently for increasing and decreasing entry + if (open > close) { // decreasing + + if (dataSet.getDecreasingColor() == ColorTemplate.COLOR_NONE) { + mRenderPaint.setColor(dataSet.getColor(j)); + } else { + mRenderPaint.setColor(dataSet.getDecreasingColor()); + } + + mRenderPaint.setStyle(dataSet.getDecreasingPaintStyle()); + + c.drawRect( + mBodyBuffers[0], mBodyBuffers[3], + mBodyBuffers[2], mBodyBuffers[1], + mRenderPaint); + + } else if (open < close) { + + if (dataSet.getIncreasingColor() == ColorTemplate.COLOR_NONE) { + mRenderPaint.setColor(dataSet.getColor(j)); + } else { + mRenderPaint.setColor(dataSet.getIncreasingColor()); + } + + mRenderPaint.setStyle(dataSet.getIncreasingPaintStyle()); + + c.drawRect( + mBodyBuffers[0], mBodyBuffers[1], + mBodyBuffers[2], mBodyBuffers[3], + mRenderPaint); + } else { // equal values + + if (dataSet.getNeutralColor() == ColorTemplate.COLOR_NONE) { + mRenderPaint.setColor(dataSet.getColor(j)); + } else { + mRenderPaint.setColor(dataSet.getNeutralColor()); + } + + c.drawLine( + mBodyBuffers[0], mBodyBuffers[1], + mBodyBuffers[2], mBodyBuffers[3], + mRenderPaint); + } + } else { + + mRangeBuffers[0] = xPos; + mRangeBuffers[1] = high * phaseY; + mRangeBuffers[2] = xPos; + mRangeBuffers[3] = low * phaseY; + + mOpenBuffers[0] = xPos - 0.5f + barSpace; + mOpenBuffers[1] = open * phaseY; + mOpenBuffers[2] = xPos; + mOpenBuffers[3] = open * phaseY; + + mCloseBuffers[0] = xPos + 0.5f - barSpace; + mCloseBuffers[1] = close * phaseY; + mCloseBuffers[2] = xPos; + mCloseBuffers[3] = close * phaseY; + + trans.pointValuesToPixel(mRangeBuffers); + trans.pointValuesToPixel(mOpenBuffers); + trans.pointValuesToPixel(mCloseBuffers); + + // draw the ranges + int barColor; + + if (open > close) + barColor = dataSet.getDecreasingColor() == ColorTemplate.COLOR_NONE + ? dataSet.getColor(j) + : dataSet.getDecreasingColor(); + else if (open < close) + barColor = dataSet.getIncreasingColor() == ColorTemplate.COLOR_NONE + ? dataSet.getColor(j) + : dataSet.getIncreasingColor(); + else + barColor = dataSet.getNeutralColor() == ColorTemplate.COLOR_NONE + ? dataSet.getColor(j) + : dataSet.getNeutralColor(); + + mRenderPaint.setColor(barColor); + c.drawLine( + mRangeBuffers[0], mRangeBuffers[1], + mRangeBuffers[2], mRangeBuffers[3], + mRenderPaint); + c.drawLine( + mOpenBuffers[0], mOpenBuffers[1], + mOpenBuffers[2], mOpenBuffers[3], + mRenderPaint); + c.drawLine( + mCloseBuffers[0], mCloseBuffers[1], + mCloseBuffers[2], mCloseBuffers[3], + mRenderPaint); + } + } + } + + @Override + public void drawValues(Canvas c) { + + // if values are drawn + if (isDrawingValuesAllowed(mChart)) { + + List<ICandleDataSet> dataSets = mChart.getCandleData().getDataSets(); + + for (int i = 0; i < dataSets.size(); i++) { + + ICandleDataSet dataSet = dataSets.get(i); + + if (!shouldDrawValues(dataSet) || dataSet.getEntryCount() < 1) + continue; + + // apply the text-styling defined by the DataSet + applyValueTextStyle(dataSet); + + Transformer trans = mChart.getTransformer(dataSet.getAxisDependency()); + + mXBounds.set(mChart, dataSet); + + float[] positions = trans.generateTransformedValuesCandle( + dataSet, mAnimator.getPhaseX(), mAnimator.getPhaseY(), mXBounds.min, mXBounds.max); + + float yOffset = Utils.convertDpToPixel(5f); + + MPPointF iconsOffset = MPPointF.getInstance(dataSet.getIconsOffset()); + iconsOffset.x = Utils.convertDpToPixel(iconsOffset.x); + iconsOffset.y = Utils.convertDpToPixel(iconsOffset.y); + + for (int j = 0; j < positions.length; j += 2) { + + float x = positions[j]; + float y = positions[j + 1]; + + if (!mViewPortHandler.isInBoundsRight(x)) + break; + + if (!mViewPortHandler.isInBoundsLeft(x) || !mViewPortHandler.isInBoundsY(y)) + continue; + + CandleEntry entry = dataSet.getEntryForIndex(j / 2 + mXBounds.min); + + if (dataSet.isDrawValuesEnabled()) { + drawValue(c, + dataSet.getValueFormatter(), + entry.getHigh(), + entry, + i, + x, + y - yOffset, + dataSet + .getValueTextColor(j / 2)); + } + + if (entry.getIcon() != null && dataSet.isDrawIconsEnabled()) { + + Drawable icon = entry.getIcon(); + + Utils.drawImage( + c, + icon, + (int)(x + iconsOffset.x), + (int)(y + iconsOffset.y), + icon.getIntrinsicWidth(), + icon.getIntrinsicHeight()); + } + } + + MPPointF.recycleInstance(iconsOffset); + } + } + } + + @Override + public void drawExtras(Canvas c) { + } + + @Override + public void drawHighlighted(Canvas c, Highlight[] indices) { + + CandleData candleData = mChart.getCandleData(); + + for (Highlight high : indices) { + + ICandleDataSet set = candleData.getDataSetByIndex(high.getDataSetIndex()); + + if (set == null || !set.isHighlightEnabled()) + continue; + + CandleEntry e = set.getEntryForXValue(high.getX(), high.getY()); + + if (!isInBoundsX(e, set)) + continue; + + float lowValue = e.getLow() * mAnimator.getPhaseY(); + float highValue = e.getHigh() * mAnimator.getPhaseY(); + float y = (lowValue + highValue) / 2f; + + MPPointD pix = mChart.getTransformer(set.getAxisDependency()).getPixelForValues(e.getX(), y); + + high.setDraw((float) pix.x, (float) pix.y); + + // draw the lines + drawHighlightLines(c, (float) pix.x, (float) pix.y, set); + } + } +} diff --git a/MPChartLib/src/main/java/com/github/mikephil/charting/renderer/CombinedChartRenderer.java b/MPChartLib/src/main/java/com/github/mikephil/charting/renderer/CombinedChartRenderer.java new file mode 100644 index 00000000..6d0d4d3d --- /dev/null +++ b/MPChartLib/src/main/java/com/github/mikephil/charting/renderer/CombinedChartRenderer.java @@ -0,0 +1,167 @@ +package com.github.mikephil.charting.renderer; + +import android.graphics.Canvas; + +import com.github.mikephil.charting.animation.ChartAnimator; +import com.github.mikephil.charting.charts.Chart; +import com.github.mikephil.charting.charts.CombinedChart; +import com.github.mikephil.charting.charts.CombinedChart.DrawOrder; +import com.github.mikephil.charting.data.ChartData; +import com.github.mikephil.charting.data.CombinedData; +import com.github.mikephil.charting.highlight.Highlight; +import com.github.mikephil.charting.interfaces.dataprovider.BarLineScatterCandleBubbleDataProvider; +import com.github.mikephil.charting.utils.ViewPortHandler; + +import java.lang.ref.WeakReference; +import java.util.ArrayList; +import java.util.List; + +/** + * Renderer class that is responsible for rendering multiple different data-types. + */ +public class CombinedChartRenderer extends DataRenderer { + + /** + * all rederers for the different kinds of data this combined-renderer can draw + */ + protected List<DataRenderer> mRenderers = new ArrayList<DataRenderer>(5); + + protected WeakReference<Chart> mChart; + + public CombinedChartRenderer(CombinedChart chart, ChartAnimator animator, ViewPortHandler viewPortHandler) { + super(animator, viewPortHandler); + mChart = new WeakReference<Chart>(chart); + createRenderers(); + } + + /** + * Creates the renderers needed for this combined-renderer in the required order. Also takes the DrawOrder into + * consideration. + */ + public void createRenderers() { + + mRenderers.clear(); + + CombinedChart chart = (CombinedChart)mChart.get(); + if (chart == null) + return; + + DrawOrder[] orders = chart.getDrawOrder(); + + for (DrawOrder order : orders) { + + switch (order) { + case BAR: + if (chart.getBarData() != null) + mRenderers.add(new BarChartRenderer(chart, mAnimator, mViewPortHandler)); + break; + case BUBBLE: + if (chart.getBubbleData() != null) + mRenderers.add(new BubbleChartRenderer(chart, mAnimator, mViewPortHandler)); + break; + case LINE: + if (chart.getLineData() != null) + mRenderers.add(new LineChartRenderer(chart, mAnimator, mViewPortHandler)); + break; + case CANDLE: + if (chart.getCandleData() != null) + mRenderers.add(new CandleStickChartRenderer(chart, mAnimator, mViewPortHandler)); + break; + case SCATTER: + if (chart.getScatterData() != null) + mRenderers.add(new ScatterChartRenderer(chart, mAnimator, mViewPortHandler)); + break; + } + } + } + + @Override + public void initBuffers() { + + for (DataRenderer renderer : mRenderers) + renderer.initBuffers(); + } + + @Override + public void drawData(Canvas c) { + + for (DataRenderer renderer : mRenderers) + renderer.drawData(c); + } + + @Override + public void drawValues(Canvas c) { + + for (DataRenderer renderer : mRenderers) + renderer.drawValues(c); + } + + @Override + public void drawExtras(Canvas c) { + + for (DataRenderer renderer : mRenderers) + renderer.drawExtras(c); + } + + protected List<Highlight> mHighlightBuffer = new ArrayList<Highlight>(); + + @Override + public void drawHighlighted(Canvas c, Highlight[] indices) { + + Chart chart = mChart.get(); + if (chart == null) return; + + for (DataRenderer renderer : mRenderers) { + ChartData data = null; + + if (renderer instanceof BarChartRenderer) + data = ((BarChartRenderer)renderer).mChart.getBarData(); + else if (renderer instanceof LineChartRenderer) + data = ((LineChartRenderer)renderer).mChart.getLineData(); + else if (renderer instanceof CandleStickChartRenderer) + data = ((CandleStickChartRenderer)renderer).mChart.getCandleData(); + else if (renderer instanceof ScatterChartRenderer) + data = ((ScatterChartRenderer)renderer).mChart.getScatterData(); + else if (renderer instanceof BubbleChartRenderer) + data = ((BubbleChartRenderer)renderer).mChart.getBubbleData(); + + int dataIndex = data == null ? -1 + : ((CombinedData)chart.getData()).getAllData().indexOf(data); + + mHighlightBuffer.clear(); + + for (Highlight h : indices) { + if (h.getDataIndex() == dataIndex || h.getDataIndex() == -1) + mHighlightBuffer.add(h); + } + + renderer.drawHighlighted(c, mHighlightBuffer.toArray(new Highlight[mHighlightBuffer.size()])); + } + } + + /** + * Returns the sub-renderer object at the specified index. + * + * @param index + * @return + */ + public DataRenderer getSubRenderer(int index) { + if (index >= mRenderers.size() || index < 0) + return null; + else + return mRenderers.get(index); + } + + /** + * Returns all sub-renderers. + * + * @return + */ + public List<DataRenderer> getSubRenderers() { + return mRenderers; + } + + public void setSubRenderers(List<DataRenderer> renderers) { + this.mRenderers = renderers; + } +} diff --git a/MPChartLib/src/main/java/com/github/mikephil/charting/renderer/DataRenderer.java b/MPChartLib/src/main/java/com/github/mikephil/charting/renderer/DataRenderer.java new file mode 100644 index 00000000..e8e5446f --- /dev/null +++ b/MPChartLib/src/main/java/com/github/mikephil/charting/renderer/DataRenderer.java @@ -0,0 +1,169 @@ + +package com.github.mikephil.charting.renderer; + +import android.graphics.Canvas; +import android.graphics.Color; +import android.graphics.Paint; +import android.graphics.Paint.Align; +import android.graphics.Paint.Style; +import android.graphics.drawable.Drawable; + +import com.github.mikephil.charting.animation.ChartAnimator; +import com.github.mikephil.charting.data.Entry; +import com.github.mikephil.charting.formatter.IValueFormatter; +import com.github.mikephil.charting.highlight.Highlight; +import com.github.mikephil.charting.interfaces.dataprovider.ChartInterface; +import com.github.mikephil.charting.interfaces.datasets.IDataSet; +import com.github.mikephil.charting.utils.MPPointF; +import com.github.mikephil.charting.utils.Utils; +import com.github.mikephil.charting.utils.ViewPortHandler; + +/** + * Superclass of all render classes for the different data types (line, bar, ...). + * + * @author Philipp Jahoda + */ +public abstract class DataRenderer extends Renderer { + + /** + * the animator object used to perform animations on the chart data + */ + protected ChartAnimator mAnimator; + + /** + * main paint object used for rendering + */ + protected Paint mRenderPaint; + + /** + * paint used for highlighting values + */ + protected Paint mHighlightPaint; + + protected Paint mDrawPaint; + + /** + * paint object for drawing values (text representing values of chart + * entries) + */ + protected Paint mValuePaint; + + public DataRenderer(ChartAnimator animator, ViewPortHandler viewPortHandler) { + super(viewPortHandler); + this.mAnimator = animator; + + mRenderPaint = new Paint(Paint.ANTI_ALIAS_FLAG); + mRenderPaint.setStyle(Style.FILL); + + mDrawPaint = new Paint(Paint.DITHER_FLAG); + + mValuePaint = new Paint(Paint.ANTI_ALIAS_FLAG); + mValuePaint.setColor(Color.rgb(63, 63, 63)); + mValuePaint.setTextAlign(Align.CENTER); + mValuePaint.setTextSize(Utils.convertDpToPixel(9f)); + + mHighlightPaint = new Paint(Paint.ANTI_ALIAS_FLAG); + mHighlightPaint.setStyle(Paint.Style.STROKE); + mHighlightPaint.setStrokeWidth(2f); + mHighlightPaint.setColor(Color.rgb(255, 187, 115)); + } + + protected boolean isDrawingValuesAllowed(ChartInterface chart) { + return chart.getData().getEntryCount() < chart.getMaxVisibleCount() + * mViewPortHandler.getScaleX(); + } + + /** + * Returns the Paint object this renderer uses for drawing the values + * (value-text). + * + * @return + */ + public Paint getPaintValues() { + return mValuePaint; + } + + /** + * Returns the Paint object this renderer uses for drawing highlight + * indicators. + * + * @return + */ + public Paint getPaintHighlight() { + return mHighlightPaint; + } + + /** + * Returns the Paint object used for rendering. + * + * @return + */ + public Paint getPaintRender() { + return mRenderPaint; + } + + /** + * Applies the required styling (provided by the DataSet) to the value-paint + * object. + * + * @param set + */ + protected void applyValueTextStyle(IDataSet set) { + + mValuePaint.setTypeface(set.getValueTypeface()); + mValuePaint.setTextSize(set.getValueTextSize()); + } + + /** + * Initializes the buffers used for rendering with a new size. Since this + * method performs memory allocations, it should only be called if + * necessary. + */ + public abstract void initBuffers(); + + /** + * Draws the actual data in form of lines, bars, ... depending on Renderer subclass. + * + * @param c + */ + public abstract void drawData(Canvas c); + + /** + * Loops over all Entrys and draws their values. + * + * @param c + */ + public abstract void drawValues(Canvas c); + + /** + * Draws the value of the given entry by using the provided IValueFormatter. + * + * @param c canvas + * @param formatter formatter for custom value-formatting + * @param value the value to be drawn + * @param entry the entry the value belongs to + * @param dataSetIndex the index of the DataSet the drawn Entry belongs to + * @param x position + * @param y position + * @param color + */ + public void drawValue(Canvas c, IValueFormatter formatter, float value, Entry entry, int dataSetIndex, float x, float y, int color) { + mValuePaint.setColor(color); + c.drawText(formatter.getFormattedValue(value, entry, dataSetIndex, mViewPortHandler), x, y, mValuePaint); + } + + /** + * Draws any kind of additional information (e.g. line-circles). + * + * @param c + */ + public abstract void drawExtras(Canvas c); + + /** + * Draws all highlight indicators for the values that are currently highlighted. + * + * @param c + * @param indices the highlighted values + */ + public abstract void drawHighlighted(Canvas c, Highlight[] indices); +} diff --git a/MPChartLib/src/main/java/com/github/mikephil/charting/renderer/HorizontalBarChartRenderer.java b/MPChartLib/src/main/java/com/github/mikephil/charting/renderer/HorizontalBarChartRenderer.java new file mode 100644 index 00000000..0cd72345 --- /dev/null +++ b/MPChartLib/src/main/java/com/github/mikephil/charting/renderer/HorizontalBarChartRenderer.java @@ -0,0 +1,443 @@ + +package com.github.mikephil.charting.renderer; + +import android.graphics.Canvas; +import android.graphics.Paint.Align; +import android.graphics.RectF; +import android.graphics.drawable.Drawable; + +import com.github.mikephil.charting.animation.ChartAnimator; +import com.github.mikephil.charting.buffer.BarBuffer; +import com.github.mikephil.charting.buffer.HorizontalBarBuffer; +import com.github.mikephil.charting.data.BarData; +import com.github.mikephil.charting.data.BarEntry; +import com.github.mikephil.charting.formatter.IValueFormatter; +import com.github.mikephil.charting.highlight.Highlight; +import com.github.mikephil.charting.interfaces.dataprovider.BarDataProvider; +import com.github.mikephil.charting.interfaces.dataprovider.ChartInterface; +import com.github.mikephil.charting.interfaces.datasets.IBarDataSet; +import com.github.mikephil.charting.utils.Fill; +import com.github.mikephil.charting.utils.MPPointF; +import com.github.mikephil.charting.utils.Transformer; +import com.github.mikephil.charting.utils.Utils; +import com.github.mikephil.charting.utils.ViewPortHandler; + +import java.util.List; + +/** + * Renderer for the HorizontalBarChart. + * + * @author Philipp Jahoda + */ +public class HorizontalBarChartRenderer extends BarChartRenderer { + + public HorizontalBarChartRenderer(BarDataProvider chart, ChartAnimator animator, + ViewPortHandler viewPortHandler) { + super(chart, animator, viewPortHandler); + + mValuePaint.setTextAlign(Align.LEFT); + } + + @Override + public void initBuffers() { + + BarData barData = mChart.getBarData(); + mBarBuffers = new HorizontalBarBuffer[barData.getDataSetCount()]; + + for (int i = 0; i < mBarBuffers.length; i++) { + IBarDataSet set = barData.getDataSetByIndex(i); + mBarBuffers[i] = new HorizontalBarBuffer(set.getEntryCount() * 4 * (set.isStacked() ? set.getStackSize() : 1), + barData.getDataSetCount(), set.isStacked()); + } + } + + private RectF mBarShadowRectBuffer = new RectF(); + + @Override + protected void drawDataSet(Canvas c, IBarDataSet dataSet, int index) { + + Transformer trans = mChart.getTransformer(dataSet.getAxisDependency()); + + mBarBorderPaint.setColor(dataSet.getBarBorderColor()); + mBarBorderPaint.setStrokeWidth(Utils.convertDpToPixel(dataSet.getBarBorderWidth())); + + final boolean drawBorder = dataSet.getBarBorderWidth() > 0.f; + + float phaseX = mAnimator.getPhaseX(); + float phaseY = mAnimator.getPhaseY(); + + // draw the bar shadow before the values + if (mChart.isDrawBarShadowEnabled()) { + mShadowPaint.setColor(dataSet.getBarShadowColor()); + + BarData barData = mChart.getBarData(); + + final float barWidth = barData.getBarWidth(); + final float barWidthHalf = barWidth / 2.0f; + float x; + + for (int i = 0, count = Math.min((int)(Math.ceil((float)(dataSet.getEntryCount()) * phaseX)), dataSet.getEntryCount()); + i < count; + i++) { + + BarEntry e = dataSet.getEntryForIndex(i); + + x = e.getX(); + + mBarShadowRectBuffer.top = x - barWidthHalf; + mBarShadowRectBuffer.bottom = x + barWidthHalf; + + trans.rectValueToPixel(mBarShadowRectBuffer); + + if (!mViewPortHandler.isInBoundsTop(mBarShadowRectBuffer.bottom)) + continue; + + if (!mViewPortHandler.isInBoundsBottom(mBarShadowRectBuffer.top)) + break; + + mBarShadowRectBuffer.left = mViewPortHandler.contentLeft(); + mBarShadowRectBuffer.right = mViewPortHandler.contentRight(); + + c.drawRect(mBarShadowRectBuffer, mShadowPaint); + } + } + + // initialize the buffer + BarBuffer buffer = mBarBuffers[index]; + buffer.setPhases(phaseX, phaseY); + buffer.setDataSet(index); + buffer.setInverted(mChart.isInverted(dataSet.getAxisDependency())); + buffer.setBarWidth(mChart.getBarData().getBarWidth()); + + buffer.feed(dataSet); + + trans.pointValuesToPixel(buffer.buffer); + + final boolean isCustomFill = dataSet.getFills() != null && !dataSet.getFills().isEmpty(); + final boolean isSingleColor = dataSet.getColors().size() == 1; + final boolean isInverted = mChart.isInverted(dataSet.getAxisDependency()); + + if (isSingleColor) { + mRenderPaint.setColor(dataSet.getColor()); + } + + for (int j = 0, pos = 0; j < buffer.size(); j += 4, pos++) { + + if (!mViewPortHandler.isInBoundsTop(buffer.buffer[j + 3])) + break; + + if (!mViewPortHandler.isInBoundsBottom(buffer.buffer[j + 1])) + continue; + + if (!isSingleColor) { + // Set the color for the currently drawn value. If the index + // is out of bounds, reuse colors. + mRenderPaint.setColor(dataSet.getColor(j / 4)); + } + + if (isCustomFill) { + dataSet.getFill(pos) + .fillRect( + c, mRenderPaint, + buffer.buffer[j], + buffer.buffer[j + 1], + buffer.buffer[j + 2], + buffer.buffer[j + 3], + isInverted ? Fill.Direction.LEFT : Fill.Direction.RIGHT); + } + else { + c.drawRect(buffer.buffer[j], buffer.buffer[j + 1], buffer.buffer[j + 2], + buffer.buffer[j + 3], mRenderPaint); + } + + if (drawBorder) { + c.drawRect(buffer.buffer[j], buffer.buffer[j + 1], buffer.buffer[j + 2], + buffer.buffer[j + 3], mBarBorderPaint); + } + } + } + + @Override + public void drawValues(Canvas c) { + // if values are drawn + if (isDrawingValuesAllowed(mChart)) { + + List<IBarDataSet> dataSets = mChart.getBarData().getDataSets(); + + final float valueOffsetPlus = Utils.convertDpToPixel(5f); + float posOffset = 0f; + float negOffset = 0f; + final boolean drawValueAboveBar = mChart.isDrawValueAboveBarEnabled(); + + for (int i = 0; i < mChart.getBarData().getDataSetCount(); i++) { + + IBarDataSet dataSet = dataSets.get(i); + + if (!shouldDrawValues(dataSet)) + continue; + + boolean isInverted = mChart.isInverted(dataSet.getAxisDependency()); + + // apply the text-styling defined by the DataSet + applyValueTextStyle(dataSet); + final float halfTextHeight = Utils.calcTextHeight(mValuePaint, "10") / 2f; + + IValueFormatter formatter = dataSet.getValueFormatter(); + + // get the buffer + BarBuffer buffer = mBarBuffers[i]; + + final float phaseY = mAnimator.getPhaseY(); + + MPPointF iconsOffset = MPPointF.getInstance(dataSet.getIconsOffset()); + iconsOffset.x = Utils.convertDpToPixel(iconsOffset.x); + iconsOffset.y = Utils.convertDpToPixel(iconsOffset.y); + + // if only single values are drawn (sum) + if (!dataSet.isStacked()) { + + for (int j = 0; j < buffer.buffer.length * mAnimator.getPhaseX(); j += 4) { + + float y = (buffer.buffer[j + 1] + buffer.buffer[j + 3]) / 2f; + + if (!mViewPortHandler.isInBoundsTop(buffer.buffer[j + 1])) + break; + + if (!mViewPortHandler.isInBoundsX(buffer.buffer[j])) + continue; + + if (!mViewPortHandler.isInBoundsBottom(buffer.buffer[j + 1])) + continue; + + BarEntry entry = dataSet.getEntryForIndex(j / 4); + float val = entry.getY(); + String formattedValue = formatter.getFormattedValue(val, entry, i, mViewPortHandler); + + // calculate the correct offset depending on the draw position of the value + float valueTextWidth = Utils.calcTextWidth(mValuePaint, formattedValue); + posOffset = (drawValueAboveBar ? valueOffsetPlus : -(valueTextWidth + valueOffsetPlus)); + negOffset = (drawValueAboveBar ? -(valueTextWidth + valueOffsetPlus) : valueOffsetPlus) + - (buffer.buffer[j + 2] - buffer.buffer[j]); + + if (isInverted) { + posOffset = -posOffset - valueTextWidth; + negOffset = -negOffset - valueTextWidth; + } + + if (dataSet.isDrawValuesEnabled()) { + drawValue(c, + formattedValue, + buffer.buffer[j + 2] + (val >= 0 ? posOffset : negOffset), + y + halfTextHeight, + dataSet.getValueTextColor(j / 2)); + } + + if (entry.getIcon() != null && dataSet.isDrawIconsEnabled()) { + + Drawable icon = entry.getIcon(); + + float px = buffer.buffer[j + 2] + (val >= 0 ? posOffset : negOffset); + float py = y; + + px += iconsOffset.x; + py += iconsOffset.y; + + Utils.drawImage( + c, + icon, + (int)px, + (int)py, + icon.getIntrinsicWidth(), + icon.getIntrinsicHeight()); + } + } + + // if each value of a potential stack should be drawn + } else { + + Transformer trans = mChart.getTransformer(dataSet.getAxisDependency()); + + int bufferIndex = 0; + int index = 0; + + while (index < dataSet.getEntryCount() * mAnimator.getPhaseX()) { + + BarEntry entry = dataSet.getEntryForIndex(index); + + int color = dataSet.getValueTextColor(index); + float[] vals = entry.getYVals(); + + // we still draw stacked bars, but there is one + // non-stacked + // in between + if (vals == null) { + + if (!mViewPortHandler.isInBoundsTop(buffer.buffer[bufferIndex + 1])) + break; + + if (!mViewPortHandler.isInBoundsX(buffer.buffer[bufferIndex])) + continue; + + if (!mViewPortHandler.isInBoundsBottom(buffer.buffer[bufferIndex + 1])) + continue; + + float val = entry.getY(); + String formattedValue = formatter.getFormattedValue(val, + entry, i, mViewPortHandler); + + // calculate the correct offset depending on the draw position of the value + float valueTextWidth = Utils.calcTextWidth(mValuePaint, formattedValue); + posOffset = (drawValueAboveBar ? valueOffsetPlus : -(valueTextWidth + valueOffsetPlus)); + negOffset = (drawValueAboveBar ? -(valueTextWidth + valueOffsetPlus) : valueOffsetPlus); + + if (isInverted) { + posOffset = -posOffset - valueTextWidth; + negOffset = -negOffset - valueTextWidth; + } + + if (dataSet.isDrawValuesEnabled()) { + drawValue(c, formattedValue, + buffer.buffer[bufferIndex + 2] + + (entry.getY() >= 0 ? posOffset : negOffset), + buffer.buffer[bufferIndex + 1] + halfTextHeight, color); + } + + if (entry.getIcon() != null && dataSet.isDrawIconsEnabled()) { + + Drawable icon = entry.getIcon(); + + float px = buffer.buffer[bufferIndex + 2] + + (entry.getY() >= 0 ? posOffset : negOffset); + float py = buffer.buffer[bufferIndex + 1]; + + px += iconsOffset.x; + py += iconsOffset.y; + + Utils.drawImage( + c, + icon, + (int)px, + (int)py, + icon.getIntrinsicWidth(), + icon.getIntrinsicHeight()); + } + + } else { + + float[] transformed = new float[vals.length * 2]; + + float posY = 0f; + float negY = -entry.getNegativeSum(); + + for (int k = 0, idx = 0; k < transformed.length; k += 2, idx++) { + + float value = vals[idx]; + float y; + + if (value == 0.0f && (posY == 0.0f || negY == 0.0f)) { + // Take care of the situation of a 0.0 value, which overlaps a non-zero bar + y = value; + } else if (value >= 0.0f) { + posY += value; + y = posY; + } else { + y = negY; + negY -= value; + } + + transformed[k] = y * phaseY; + } + + trans.pointValuesToPixel(transformed); + + for (int k = 0; k < transformed.length; k += 2) { + + final float val = vals[k / 2]; + String formattedValue = formatter.getFormattedValue(val, + entry, i, mViewPortHandler); + + // calculate the correct offset depending on the draw position of the value + float valueTextWidth = Utils.calcTextWidth(mValuePaint, formattedValue); + posOffset = (drawValueAboveBar ? valueOffsetPlus : -(valueTextWidth + valueOffsetPlus)); + negOffset = (drawValueAboveBar ? -(valueTextWidth + valueOffsetPlus) : valueOffsetPlus); + + if (isInverted) { + posOffset = -posOffset - valueTextWidth; + negOffset = -negOffset - valueTextWidth; + } + + final boolean drawBelow = + (val == 0.0f && negY == 0.0f && posY > 0.0f) || + val < 0.0f; + + float x = transformed[k] + + (drawBelow ? negOffset : posOffset); + float y = (buffer.buffer[bufferIndex + 1] + buffer.buffer[bufferIndex + 3]) / 2f; + + if (!mViewPortHandler.isInBoundsTop(y)) + break; + + if (!mViewPortHandler.isInBoundsX(x)) + continue; + + if (!mViewPortHandler.isInBoundsBottom(y)) + continue; + + if (dataSet.isDrawValuesEnabled()) { + drawValue(c, formattedValue, x, y + halfTextHeight, color); + } + + if (entry.getIcon() != null && dataSet.isDrawIconsEnabled()) { + + Drawable icon = entry.getIcon(); + + Utils.drawImage( + c, + icon, + (int)(x + iconsOffset.x), + (int)(y + iconsOffset.y), + icon.getIntrinsicWidth(), + icon.getIntrinsicHeight()); + } + } + } + + bufferIndex = vals == null ? bufferIndex + 4 : bufferIndex + 4 * vals.length; + index++; + } + } + + MPPointF.recycleInstance(iconsOffset); + } + } + } + + protected void drawValue(Canvas c, String valueText, float x, float y, int color) { + mValuePaint.setColor(color); + c.drawText(valueText, x, y, mValuePaint); + } + + @Override + protected void prepareBarHighlight(float x, float y1, float y2, float barWidthHalf, Transformer trans) { + + float top = x - barWidthHalf; + float bottom = x + barWidthHalf; + float left = y1; + float right = y2; + + mBarRect.set(left, top, right, bottom); + + trans.rectToPixelPhaseHorizontal(mBarRect, mAnimator.getPhaseY()); + } + + @Override + protected void setHighlightDrawPos(Highlight high, RectF bar) { + high.setDraw(bar.centerY(), bar.right); + } + + @Override + protected boolean isDrawingValuesAllowed(ChartInterface chart) { + return chart.getData().getEntryCount() < chart.getMaxVisibleCount() + * mViewPortHandler.getScaleY(); + } +} diff --git a/MPChartLib/src/main/java/com/github/mikephil/charting/renderer/LegendRenderer.java b/MPChartLib/src/main/java/com/github/mikephil/charting/renderer/LegendRenderer.java new file mode 100644 index 00000000..5d495805 --- /dev/null +++ b/MPChartLib/src/main/java/com/github/mikephil/charting/renderer/LegendRenderer.java @@ -0,0 +1,570 @@ + +package com.github.mikephil.charting.renderer; + +import android.graphics.Canvas; +import android.graphics.DashPathEffect; +import android.graphics.Paint; +import android.graphics.Paint.Align; +import android.graphics.Path; +import android.graphics.Typeface; + +import com.github.mikephil.charting.components.Legend; +import com.github.mikephil.charting.components.LegendEntry; +import com.github.mikephil.charting.data.ChartData; +import com.github.mikephil.charting.interfaces.datasets.IBarDataSet; +import com.github.mikephil.charting.interfaces.datasets.ICandleDataSet; +import com.github.mikephil.charting.interfaces.datasets.IDataSet; +import com.github.mikephil.charting.interfaces.datasets.IPieDataSet; +import com.github.mikephil.charting.utils.ColorTemplate; +import com.github.mikephil.charting.utils.FSize; +import com.github.mikephil.charting.utils.Utils; +import com.github.mikephil.charting.utils.ViewPortHandler; + +import java.util.ArrayList; +import java.util.Collections; +import java.util.List; + +public class LegendRenderer extends Renderer { + + /** + * paint for the legend labels + */ + protected Paint mLegendLabelPaint; + + /** + * paint used for the legend forms + */ + protected Paint mLegendFormPaint; + + /** + * the legend object this renderer renders + */ + protected Legend mLegend; + + public LegendRenderer(ViewPortHandler viewPortHandler, Legend legend) { + super(viewPortHandler); + + this.mLegend = legend; + + mLegendLabelPaint = new Paint(Paint.ANTI_ALIAS_FLAG); + mLegendLabelPaint.setTextSize(Utils.convertDpToPixel(9f)); + mLegendLabelPaint.setTextAlign(Align.LEFT); + + mLegendFormPaint = new Paint(Paint.ANTI_ALIAS_FLAG); + mLegendFormPaint.setStyle(Paint.Style.FILL); + } + + /** + * Returns the Paint object used for drawing the Legend labels. + * + * @return + */ + public Paint getLabelPaint() { + return mLegendLabelPaint; + } + + /** + * Returns the Paint object used for drawing the Legend forms. + * + * @return + */ + public Paint getFormPaint() { + return mLegendFormPaint; + } + + + protected List<LegendEntry> computedEntries = new ArrayList<>(16); + + /** + * Prepares the legend and calculates all needed forms, labels and colors. + * + * @param data + */ + public void computeLegend(ChartData<?> data) { + + if (!mLegend.isLegendCustom()) { + + computedEntries.clear(); + + // loop for building up the colors and labels used in the legend + for (int i = 0; i < data.getDataSetCount(); i++) { + + IDataSet dataSet = data.getDataSetByIndex(i); + if (dataSet == null) continue; + + List<Integer> clrs = dataSet.getColors(); + int entryCount = dataSet.getEntryCount(); + + // if we have a barchart with stacked bars + if (dataSet instanceof IBarDataSet && ((IBarDataSet) dataSet).isStacked()) { + + IBarDataSet bds = (IBarDataSet) dataSet; + String[] sLabels = bds.getStackLabels(); + + int minEntries = Math.min(clrs.size(), bds.getStackSize()); + + for (int j = 0; j < minEntries; j++) { + String label; + if (sLabels.length > 0) { + int labelIndex = j % minEntries; + label = labelIndex < sLabels.length ? sLabels[labelIndex] : null; + } else { + label = null; + } + + computedEntries.add(new LegendEntry( + label, + dataSet.getForm(), + dataSet.getFormSize(), + dataSet.getFormLineWidth(), + dataSet.getFormLineDashEffect(), + clrs.get(j) + )); + } + + if (bds.getLabel() != null) { + // add the legend description label + computedEntries.add(new LegendEntry( + dataSet.getLabel(), + Legend.LegendForm.NONE, + Float.NaN, + Float.NaN, + null, + ColorTemplate.COLOR_NONE + )); + } + + } else if (dataSet instanceof IPieDataSet) { + + IPieDataSet pds = (IPieDataSet) dataSet; + + for (int j = 0; j < clrs.size() && j < entryCount; j++) { + + computedEntries.add(new LegendEntry( + pds.getEntryForIndex(j).getLabel(), + dataSet.getForm(), + dataSet.getFormSize(), + dataSet.getFormLineWidth(), + dataSet.getFormLineDashEffect(), + clrs.get(j) + )); + } + + if (pds.getLabel() != null) { + // add the legend description label + computedEntries.add(new LegendEntry( + dataSet.getLabel(), + Legend.LegendForm.NONE, + Float.NaN, + Float.NaN, + null, + ColorTemplate.COLOR_NONE + )); + } + + } else if (dataSet instanceof ICandleDataSet && ((ICandleDataSet) dataSet).getDecreasingColor() != + ColorTemplate.COLOR_NONE) { + + int decreasingColor = ((ICandleDataSet) dataSet).getDecreasingColor(); + int increasingColor = ((ICandleDataSet) dataSet).getIncreasingColor(); + + computedEntries.add(new LegendEntry( + null, + dataSet.getForm(), + dataSet.getFormSize(), + dataSet.getFormLineWidth(), + dataSet.getFormLineDashEffect(), + decreasingColor + )); + + computedEntries.add(new LegendEntry( + dataSet.getLabel(), + dataSet.getForm(), + dataSet.getFormSize(), + dataSet.getFormLineWidth(), + dataSet.getFormLineDashEffect(), + increasingColor + )); + + } else { // all others + + for (int j = 0; j < clrs.size() && j < entryCount; j++) { + + String label; + + // if multiple colors are set for a DataSet, group them + if (j < clrs.size() - 1 && j < entryCount - 1) { + label = null; + } else { // add label to the last entry + label = data.getDataSetByIndex(i).getLabel(); + } + + computedEntries.add(new LegendEntry( + label, + dataSet.getForm(), + dataSet.getFormSize(), + dataSet.getFormLineWidth(), + dataSet.getFormLineDashEffect(), + clrs.get(j) + )); + } + } + } + + if (mLegend.getExtraEntries() != null) { + Collections.addAll(computedEntries, mLegend.getExtraEntries()); + } + + mLegend.setEntries(computedEntries); + } + + Typeface tf = mLegend.getTypeface(); + + if (tf != null) + mLegendLabelPaint.setTypeface(tf); + + mLegendLabelPaint.setTextSize(mLegend.getTextSize()); + mLegendLabelPaint.setColor(mLegend.getTextColor()); + + // calculate all dimensions of the mLegend + mLegend.calculateDimensions(mLegendLabelPaint, mViewPortHandler); + } + + protected Paint.FontMetrics legendFontMetrics = new Paint.FontMetrics(); + + public void renderLegend(Canvas c) { + + if (!mLegend.isEnabled()) + return; + + Typeface tf = mLegend.getTypeface(); + + if (tf != null) + mLegendLabelPaint.setTypeface(tf); + + mLegendLabelPaint.setTextSize(mLegend.getTextSize()); + mLegendLabelPaint.setColor(mLegend.getTextColor()); + + float labelLineHeight = Utils.getLineHeight(mLegendLabelPaint, legendFontMetrics); + float labelLineSpacing = Utils.getLineSpacing(mLegendLabelPaint, legendFontMetrics) + + Utils.convertDpToPixel(mLegend.getYEntrySpace()); + float formYOffset = labelLineHeight - Utils.calcTextHeight(mLegendLabelPaint, "ABC") / 2.f; + + LegendEntry[] entries = mLegend.getEntries(); + + float formToTextSpace = Utils.convertDpToPixel(mLegend.getFormToTextSpace()); + float xEntrySpace = Utils.convertDpToPixel(mLegend.getXEntrySpace()); + Legend.LegendOrientation orientation = mLegend.getOrientation(); + Legend.LegendHorizontalAlignment horizontalAlignment = mLegend.getHorizontalAlignment(); + Legend.LegendVerticalAlignment verticalAlignment = mLegend.getVerticalAlignment(); + Legend.LegendDirection direction = mLegend.getDirection(); + float defaultFormSize = Utils.convertDpToPixel(mLegend.getFormSize()); + + // space between the entries + float stackSpace = Utils.convertDpToPixel(mLegend.getStackSpace()); + + float yoffset = mLegend.getYOffset(); + float xoffset = mLegend.getXOffset(); + float originPosX = 0.f; + + switch (horizontalAlignment) { + case LEFT: + + if (orientation == Legend.LegendOrientation.VERTICAL) + originPosX = xoffset; + else + originPosX = mViewPortHandler.contentLeft() + xoffset; + + if (direction == Legend.LegendDirection.RIGHT_TO_LEFT) + originPosX += mLegend.mNeededWidth; + + break; + + case RIGHT: + + if (orientation == Legend.LegendOrientation.VERTICAL) + originPosX = mViewPortHandler.getChartWidth() - xoffset; + else + originPosX = mViewPortHandler.contentRight() - xoffset; + + if (direction == Legend.LegendDirection.LEFT_TO_RIGHT) + originPosX -= mLegend.mNeededWidth; + + break; + + case CENTER: + + if (orientation == Legend.LegendOrientation.VERTICAL) + originPosX = mViewPortHandler.getChartWidth() / 2.f; + else + originPosX = mViewPortHandler.contentLeft() + + mViewPortHandler.contentWidth() / 2.f; + + originPosX += (direction == Legend.LegendDirection.LEFT_TO_RIGHT + ? +xoffset + : -xoffset); + + // Horizontally layed out legends do the center offset on a line basis, + // So here we offset the vertical ones only. + if (orientation == Legend.LegendOrientation.VERTICAL) { + originPosX += (direction == Legend.LegendDirection.LEFT_TO_RIGHT + ? -mLegend.mNeededWidth / 2.0 + xoffset + : mLegend.mNeededWidth / 2.0 - xoffset); + } + + break; + } + + switch (orientation) { + case HORIZONTAL: { + + List<FSize> calculatedLineSizes = mLegend.getCalculatedLineSizes(); + List<FSize> calculatedLabelSizes = mLegend.getCalculatedLabelSizes(); + List<Boolean> calculatedLabelBreakPoints = mLegend.getCalculatedLabelBreakPoints(); + + float posX = originPosX; + float posY = 0.f; + + switch (verticalAlignment) { + case TOP: + posY = yoffset; + break; + + case BOTTOM: + posY = mViewPortHandler.getChartHeight() - yoffset - mLegend.mNeededHeight; + break; + + case CENTER: + posY = (mViewPortHandler.getChartHeight() - mLegend.mNeededHeight) / 2.f + yoffset; + break; + } + + int lineIndex = 0; + + for (int i = 0, count = entries.length; i < count; i++) { + + LegendEntry e = entries[i]; + boolean drawingForm = e.form != Legend.LegendForm.NONE; + float formSize = Float.isNaN(e.formSize) ? defaultFormSize : Utils.convertDpToPixel(e.formSize); + + if (i < calculatedLabelBreakPoints.size() && calculatedLabelBreakPoints.get(i)) { + posX = originPosX; + posY += labelLineHeight + labelLineSpacing; + } + + if (posX == originPosX && + horizontalAlignment == Legend.LegendHorizontalAlignment.CENTER && + lineIndex < calculatedLineSizes.size()) { + posX += (direction == Legend.LegendDirection.RIGHT_TO_LEFT + ? calculatedLineSizes.get(lineIndex).width + : -calculatedLineSizes.get(lineIndex).width) / 2.f; + lineIndex++; + } + + boolean isStacked = e.label == null; // grouped forms have null labels + + if (drawingForm) { + if (direction == Legend.LegendDirection.RIGHT_TO_LEFT) + posX -= formSize; + + drawForm(c, posX, posY + formYOffset, e, mLegend); + + if (direction == Legend.LegendDirection.LEFT_TO_RIGHT) + posX += formSize; + } + + if (!isStacked) { + if (drawingForm) + posX += direction == Legend.LegendDirection.RIGHT_TO_LEFT ? -formToTextSpace : + formToTextSpace; + + if (direction == Legend.LegendDirection.RIGHT_TO_LEFT) + posX -= calculatedLabelSizes.get(i).width; + + drawLabel(c, posX, posY + labelLineHeight, e.label); + + if (direction == Legend.LegendDirection.LEFT_TO_RIGHT) + posX += calculatedLabelSizes.get(i).width; + + posX += direction == Legend.LegendDirection.RIGHT_TO_LEFT ? -xEntrySpace : xEntrySpace; + } else + posX += direction == Legend.LegendDirection.RIGHT_TO_LEFT ? -stackSpace : stackSpace; + } + + break; + } + + case VERTICAL: { + // contains the stacked legend size in pixels + float stack = 0f; + boolean wasStacked = false; + float posY = 0.f; + + switch (verticalAlignment) { + case TOP: + posY = (horizontalAlignment == Legend.LegendHorizontalAlignment.CENTER + ? 0.f + : mViewPortHandler.contentTop()); + posY += yoffset; + break; + + case BOTTOM: + posY = (horizontalAlignment == Legend.LegendHorizontalAlignment.CENTER + ? mViewPortHandler.getChartHeight() + : mViewPortHandler.contentBottom()); + posY -= mLegend.mNeededHeight + yoffset; + break; + + case CENTER: + posY = mViewPortHandler.getChartHeight() / 2.f + - mLegend.mNeededHeight / 2.f + + mLegend.getYOffset(); + break; + } + + for (int i = 0; i < entries.length; i++) { + + LegendEntry e = entries[i]; + boolean drawingForm = e.form != Legend.LegendForm.NONE; + float formSize = Float.isNaN(e.formSize) ? defaultFormSize : Utils.convertDpToPixel(e.formSize); + + float posX = originPosX; + + if (drawingForm) { + if (direction == Legend.LegendDirection.LEFT_TO_RIGHT) + posX += stack; + else + posX -= formSize - stack; + + drawForm(c, posX, posY + formYOffset, e, mLegend); + + if (direction == Legend.LegendDirection.LEFT_TO_RIGHT) + posX += formSize; + } + + if (e.label != null) { + + if (drawingForm && !wasStacked) + posX += direction == Legend.LegendDirection.LEFT_TO_RIGHT ? formToTextSpace + : -formToTextSpace; + else if (wasStacked) + posX = originPosX; + + if (direction == Legend.LegendDirection.RIGHT_TO_LEFT) + posX -= Utils.calcTextWidth(mLegendLabelPaint, e.label); + + if (!wasStacked) { + drawLabel(c, posX, posY + labelLineHeight, e.label); + } else { + posY += labelLineHeight + labelLineSpacing; + drawLabel(c, posX, posY + labelLineHeight, e.label); + } + + // make a step down + posY += labelLineHeight + labelLineSpacing; + stack = 0f; + } else { + stack += formSize + stackSpace; + wasStacked = true; + } + } + + break; + + } + } + } + + private Path mLineFormPath = new Path(); + + /** + * Draws the Legend-form at the given position with the color at the given + * index. + * + * @param c canvas to draw with + * @param x position + * @param y position + * @param entry the entry to render + * @param legend the legend context + */ + protected void drawForm( + Canvas c, + float x, float y, + LegendEntry entry, + Legend legend) { + + if (entry.formColor == ColorTemplate.COLOR_SKIP || + entry.formColor == ColorTemplate.COLOR_NONE || + entry.formColor == 0) + return; + + int restoreCount = c.save(); + + Legend.LegendForm form = entry.form; + if (form == Legend.LegendForm.DEFAULT) + form = legend.getForm(); + + mLegendFormPaint.setColor(entry.formColor); + + final float formSize = Utils.convertDpToPixel( + Float.isNaN(entry.formSize) + ? legend.getFormSize() + : entry.formSize); + final float half = formSize / 2f; + + switch (form) { + case NONE: + // Do nothing + break; + + case EMPTY: + // Do not draw, but keep space for the form + break; + + case DEFAULT: + case CIRCLE: + mLegendFormPaint.setStyle(Paint.Style.FILL); + c.drawCircle(x + half, y, half, mLegendFormPaint); + break; + + case SQUARE: + mLegendFormPaint.setStyle(Paint.Style.FILL); + c.drawRect(x, y - half, x + formSize, y + half, mLegendFormPaint); + break; + + case LINE: + { + final float formLineWidth = Utils.convertDpToPixel( + Float.isNaN(entry.formLineWidth) + ? legend.getFormLineWidth() + : entry.formLineWidth); + final DashPathEffect formLineDashEffect = entry.formLineDashEffect == null + ? legend.getFormLineDashEffect() + : entry.formLineDashEffect; + mLegendFormPaint.setStyle(Paint.Style.STROKE); + mLegendFormPaint.setStrokeWidth(formLineWidth); + mLegendFormPaint.setPathEffect(formLineDashEffect); + + mLineFormPath.reset(); + mLineFormPath.moveTo(x, y); + mLineFormPath.lineTo(x + formSize, y); + c.drawPath(mLineFormPath, mLegendFormPaint); + } + break; + } + + c.restoreToCount(restoreCount); + } + + /** + * Draws the provided label at the given position. + * + * @param c canvas to draw with + * @param x + * @param y + * @param label the label to draw + */ + protected void drawLabel(Canvas c, float x, float y, String label) { + c.drawText(label, x, y, mLegendLabelPaint); + } +} diff --git a/MPChartLib/src/main/java/com/github/mikephil/charting/renderer/LineChartRenderer.java b/MPChartLib/src/main/java/com/github/mikephil/charting/renderer/LineChartRenderer.java new file mode 100644 index 00000000..a86c16f7 --- /dev/null +++ b/MPChartLib/src/main/java/com/github/mikephil/charting/renderer/LineChartRenderer.java @@ -0,0 +1,863 @@ +package com.github.mikephil.charting.renderer; + +import android.graphics.Bitmap; +import android.graphics.Canvas; +import android.graphics.Color; +import android.graphics.Paint; +import android.graphics.Path; +import android.graphics.drawable.Drawable; + +import com.github.mikephil.charting.animation.ChartAnimator; +import com.github.mikephil.charting.charts.LineChart; +import com.github.mikephil.charting.data.Entry; +import com.github.mikephil.charting.data.LineData; +import com.github.mikephil.charting.data.LineDataSet; +import com.github.mikephil.charting.highlight.Highlight; +import com.github.mikephil.charting.interfaces.dataprovider.LineDataProvider; +import com.github.mikephil.charting.interfaces.datasets.IDataSet; +import com.github.mikephil.charting.interfaces.datasets.ILineDataSet; +import com.github.mikephil.charting.utils.ColorTemplate; +import com.github.mikephil.charting.utils.MPPointD; +import com.github.mikephil.charting.utils.MPPointF; +import com.github.mikephil.charting.utils.Transformer; +import com.github.mikephil.charting.utils.Utils; +import com.github.mikephil.charting.utils.ViewPortHandler; + +import java.lang.ref.WeakReference; +import java.util.HashMap; +import java.util.List; + +public class LineChartRenderer extends LineRadarRenderer { + + protected LineDataProvider mChart; + + /** + * paint for the inner circle of the value indicators + */ + protected Paint mCirclePaintInner; + + /** + * Bitmap object used for drawing the paths (otherwise they are too long if + * rendered directly on the canvas) + */ + protected WeakReference<Bitmap> mDrawBitmap; + + /** + * on this canvas, the paths are rendered, it is initialized with the + * pathBitmap + */ + protected Canvas mBitmapCanvas; + + /** + * the bitmap configuration to be used + */ + protected Bitmap.Config mBitmapConfig = Bitmap.Config.ARGB_8888; + + protected Path cubicPath = new Path(); + protected Path cubicFillPath = new Path(); + + public LineChartRenderer(LineDataProvider chart, ChartAnimator animator, + ViewPortHandler viewPortHandler) { + super(animator, viewPortHandler); + mChart = chart; + + mCirclePaintInner = new Paint(Paint.ANTI_ALIAS_FLAG); + mCirclePaintInner.setStyle(Paint.Style.FILL); + mCirclePaintInner.setColor(Color.WHITE); + } + + @Override + public void initBuffers() { + } + + @Override + public void drawData(Canvas c) { + + int width = (int) mViewPortHandler.getChartWidth(); + int height = (int) mViewPortHandler.getChartHeight(); + + Bitmap drawBitmap = mDrawBitmap == null ? null : mDrawBitmap.get(); + + if (drawBitmap == null + || (drawBitmap.getWidth() != width) + || (drawBitmap.getHeight() != height)) { + + if (width > 0 && height > 0) { + drawBitmap = Bitmap.createBitmap(width, height, mBitmapConfig); + mDrawBitmap = new WeakReference<>(drawBitmap); + mBitmapCanvas = new Canvas(drawBitmap); + } else + return; + } + + drawBitmap.eraseColor(Color.TRANSPARENT); + + LineData lineData = mChart.getLineData(); + + for (ILineDataSet set : lineData.getDataSets()) { + + if (set.isVisible()) + drawDataSet(c, set); + } + + c.drawBitmap(drawBitmap, 0, 0, mRenderPaint); + } + + protected void drawDataSet(Canvas c, ILineDataSet dataSet) { + + if (dataSet.getEntryCount() < 1) + return; + + mRenderPaint.setStrokeWidth(dataSet.getLineWidth()); + mRenderPaint.setPathEffect(dataSet.getDashPathEffect()); + + switch (dataSet.getMode()) { + default: + case LINEAR: + case STEPPED: + drawLinear(c, dataSet); + break; + + case CUBIC_BEZIER: + drawCubicBezier(dataSet); + break; + + case HORIZONTAL_BEZIER: + drawHorizontalBezier(dataSet); + break; + } + + mRenderPaint.setPathEffect(null); + } + + protected void drawHorizontalBezier(ILineDataSet dataSet) { + + float phaseY = mAnimator.getPhaseY(); + + Transformer trans = mChart.getTransformer(dataSet.getAxisDependency()); + + mXBounds.set(mChart, dataSet); + + cubicPath.reset(); + + if (mXBounds.range >= 1) { + + Entry prev = dataSet.getEntryForIndex(mXBounds.min); + Entry cur = prev; + + // let the spline start + cubicPath.moveTo(cur.getX(), cur.getY() * phaseY); + + for (int j = mXBounds.min + 1; j <= mXBounds.range + mXBounds.min; j++) { + + prev = cur; + cur = dataSet.getEntryForIndex(j); + + final float cpx = (prev.getX()) + + (cur.getX() - prev.getX()) / 2.0f; + + cubicPath.cubicTo( + cpx, prev.getY() * phaseY, + cpx, cur.getY() * phaseY, + cur.getX(), cur.getY() * phaseY); + } + } + + // if filled is enabled, close the path + if (dataSet.isDrawFilledEnabled()) { + + cubicFillPath.reset(); + cubicFillPath.addPath(cubicPath); + // create a new path, this is bad for performance + drawCubicFill(mBitmapCanvas, dataSet, cubicFillPath, trans, mXBounds); + } + + mRenderPaint.setColor(dataSet.getColor()); + + mRenderPaint.setStyle(Paint.Style.STROKE); + + trans.pathValueToPixel(cubicPath); + + mBitmapCanvas.drawPath(cubicPath, mRenderPaint); + + mRenderPaint.setPathEffect(null); + } + + protected void drawCubicBezier(ILineDataSet dataSet) { + + float phaseY = mAnimator.getPhaseY(); + + Transformer trans = mChart.getTransformer(dataSet.getAxisDependency()); + + mXBounds.set(mChart, dataSet); + + float intensity = dataSet.getCubicIntensity(); + + cubicPath.reset(); + + if (mXBounds.range >= 1) { + + float prevDx = 0f; + float prevDy = 0f; + float curDx = 0f; + float curDy = 0f; + + // Take an extra point from the left, and an extra from the right. + // That's because we need 4 points for a cubic bezier (cubic=4), otherwise we get lines moving and doing weird stuff on the edges of the chart. + // So in the starting `prev` and `cur`, go -2, -1 + // And in the `lastIndex`, add +1 + + final int firstIndex = mXBounds.min + 1; + final int lastIndex = mXBounds.min + mXBounds.range; + + Entry prevPrev; + Entry prev = dataSet.getEntryForIndex(Math.max(firstIndex - 2, 0)); + Entry cur = dataSet.getEntryForIndex(Math.max(firstIndex - 1, 0)); + Entry next = cur; + int nextIndex = -1; + + if (cur == null) return; + + // let the spline start + cubicPath.moveTo(cur.getX(), cur.getY() * phaseY); + + for (int j = mXBounds.min + 1; j <= mXBounds.range + mXBounds.min; j++) { + + prevPrev = prev; + prev = cur; + cur = nextIndex == j ? next : dataSet.getEntryForIndex(j); + + nextIndex = j + 1 < dataSet.getEntryCount() ? j + 1 : j; + next = dataSet.getEntryForIndex(nextIndex); + + prevDx = (cur.getX() - prevPrev.getX()) * intensity; + prevDy = (cur.getY() - prevPrev.getY()) * intensity; + curDx = (next.getX() - prev.getX()) * intensity; + curDy = (next.getY() - prev.getY()) * intensity; + + cubicPath.cubicTo(prev.getX() + prevDx, (prev.getY() + prevDy) * phaseY, + cur.getX() - curDx, + (cur.getY() - curDy) * phaseY, cur.getX(), cur.getY() * phaseY); + } + } + + // if filled is enabled, close the path + if (dataSet.isDrawFilledEnabled()) { + + cubicFillPath.reset(); + cubicFillPath.addPath(cubicPath); + + drawCubicFill(mBitmapCanvas, dataSet, cubicFillPath, trans, mXBounds); + } + + mRenderPaint.setColor(dataSet.getColor()); + + mRenderPaint.setStyle(Paint.Style.STROKE); + + trans.pathValueToPixel(cubicPath); + + mBitmapCanvas.drawPath(cubicPath, mRenderPaint); + + mRenderPaint.setPathEffect(null); + } + + protected void drawCubicFill(Canvas c, ILineDataSet dataSet, Path spline, Transformer trans, XBounds bounds) { + + float fillMin = dataSet.getFillFormatter() + .getFillLinePosition(dataSet, mChart); + + spline.lineTo(dataSet.getEntryForIndex(bounds.min + bounds.range).getX(), fillMin); + spline.lineTo(dataSet.getEntryForIndex(bounds.min).getX(), fillMin); + spline.close(); + + trans.pathValueToPixel(spline); + + final Drawable drawable = dataSet.getFillDrawable(); + if (drawable != null) { + + drawFilledPath(c, spline, drawable); + } else { + + drawFilledPath(c, spline, dataSet.getFillColor(), dataSet.getFillAlpha()); + } + } + + private float[] mLineBuffer = new float[4]; + + /** + * Draws a normal line. + * + * @param c + * @param dataSet + */ + protected void drawLinear(Canvas c, ILineDataSet dataSet) { + + int entryCount = dataSet.getEntryCount(); + + final boolean isDrawSteppedEnabled = dataSet.isDrawSteppedEnabled(); + final int pointsPerEntryPair = isDrawSteppedEnabled ? 4 : 2; + + Transformer trans = mChart.getTransformer(dataSet.getAxisDependency()); + + float phaseY = mAnimator.getPhaseY(); + + mRenderPaint.setStyle(Paint.Style.STROKE); + + Canvas canvas = null; + + // if the data-set is dashed, draw on bitmap-canvas + if (dataSet.isDashedLineEnabled()) { + canvas = mBitmapCanvas; + } else { + canvas = c; + } + + mXBounds.set(mChart, dataSet); + + // if drawing filled is enabled + if (dataSet.isDrawFilledEnabled() && entryCount > 0) { + drawLinearFill(c, dataSet, trans, mXBounds); + } + + // more than 1 color + if (dataSet.getColors().size() > 1) { + + int numberOfFloats = pointsPerEntryPair * 2; + + if (mLineBuffer.length <= numberOfFloats) + mLineBuffer = new float[numberOfFloats * 2]; + + int max = mXBounds.min + mXBounds.range; + + for (int j = mXBounds.min; j < max; j++) { + + Entry e = dataSet.getEntryForIndex(j); + if (e == null) continue; + + mLineBuffer[0] = e.getX(); + mLineBuffer[1] = e.getY() * phaseY; + + if (j < mXBounds.max) { + + e = dataSet.getEntryForIndex(j + 1); + + if (e == null) break; + + if (isDrawSteppedEnabled) { + mLineBuffer[2] = e.getX(); + mLineBuffer[3] = mLineBuffer[1]; + mLineBuffer[4] = mLineBuffer[2]; + mLineBuffer[5] = mLineBuffer[3]; + mLineBuffer[6] = e.getX(); + mLineBuffer[7] = e.getY() * phaseY; + } else { + mLineBuffer[2] = e.getX(); + mLineBuffer[3] = e.getY() * phaseY; + } + + } else { + mLineBuffer[2] = mLineBuffer[0]; + mLineBuffer[3] = mLineBuffer[1]; + } + + // Determine the start and end coordinates of the line, and make sure they differ. + float firstCoordinateX = mLineBuffer[0]; + float firstCoordinateY = mLineBuffer[1]; + float lastCoordinateX = mLineBuffer[numberOfFloats - 2]; + float lastCoordinateY = mLineBuffer[numberOfFloats - 1]; + + if (firstCoordinateX == lastCoordinateX && + firstCoordinateY == lastCoordinateY) + continue; + + trans.pointValuesToPixel(mLineBuffer); + + if (!mViewPortHandler.isInBoundsRight(firstCoordinateX)) + break; + + // make sure the lines don't do shitty things outside + // bounds + if (!mViewPortHandler.isInBoundsLeft(lastCoordinateX) || + !mViewPortHandler.isInBoundsTop(Math.max(firstCoordinateY, lastCoordinateY)) || + !mViewPortHandler.isInBoundsBottom(Math.min(firstCoordinateY, lastCoordinateY))) + continue; + + // get the color that is set for this line-segment + mRenderPaint.setColor(dataSet.getColor(j)); + + canvas.drawLines(mLineBuffer, 0, pointsPerEntryPair * 2, mRenderPaint); + } + + } else { // only one color per dataset + + if (mLineBuffer.length < Math.max((entryCount) * pointsPerEntryPair, pointsPerEntryPair) * 2) + mLineBuffer = new float[Math.max((entryCount) * pointsPerEntryPair, pointsPerEntryPair) * 4]; + + Entry e1, e2; + + e1 = dataSet.getEntryForIndex(mXBounds.min); + + if (e1 != null) { + + int j = 0; + for (int x = mXBounds.min; x <= mXBounds.range + mXBounds.min; x++) { + + e1 = dataSet.getEntryForIndex(x == 0 ? 0 : (x - 1)); + e2 = dataSet.getEntryForIndex(x); + + if (e1 == null || e2 == null) continue; + + mLineBuffer[j++] = e1.getX(); + mLineBuffer[j++] = e1.getY() * phaseY; + + if (isDrawSteppedEnabled) { + mLineBuffer[j++] = e2.getX(); + mLineBuffer[j++] = e1.getY() * phaseY; + mLineBuffer[j++] = e2.getX(); + mLineBuffer[j++] = e1.getY() * phaseY; + } + + mLineBuffer[j++] = e2.getX(); + mLineBuffer[j++] = e2.getY() * phaseY; + } + + if (j > 0) { + trans.pointValuesToPixel(mLineBuffer); + + final int size = Math.max((mXBounds.range + 1) * pointsPerEntryPair, pointsPerEntryPair) * 2; + + mRenderPaint.setColor(dataSet.getColor()); + + canvas.drawLines(mLineBuffer, 0, size, mRenderPaint); + } + } + } + + mRenderPaint.setPathEffect(null); + } + + protected Path mGenerateFilledPathBuffer = new Path(); + + /** + * Draws a filled linear path on the canvas. + * + * @param c + * @param dataSet + * @param trans + * @param bounds + */ + protected void drawLinearFill(Canvas c, ILineDataSet dataSet, Transformer trans, XBounds bounds) { + + final Path filled = mGenerateFilledPathBuffer; + + final int startingIndex = bounds.min; + final int endingIndex = bounds.range + bounds.min; + final int indexInterval = 128; + + int currentStartIndex = 0; + int currentEndIndex = indexInterval; + int iterations = 0; + + // Doing this iteratively in order to avoid OutOfMemory errors that can happen on large bounds sets. + do { + currentStartIndex = startingIndex + (iterations * indexInterval); + currentEndIndex = currentStartIndex + indexInterval; + currentEndIndex = currentEndIndex > endingIndex ? endingIndex : currentEndIndex; + + if (currentStartIndex <= currentEndIndex) { + generateFilledPath(dataSet, currentStartIndex, currentEndIndex, filled); + + trans.pathValueToPixel(filled); + + final Drawable drawable = dataSet.getFillDrawable(); + if (drawable != null) { + + drawFilledPath(c, filled, drawable); + } else { + + drawFilledPath(c, filled, dataSet.getFillColor(), dataSet.getFillAlpha()); + } + } + + iterations++; + + } while (currentStartIndex <= currentEndIndex); + + } + + /** + * Generates a path that is used for filled drawing. + * + * @param dataSet The dataset from which to read the entries. + * @param startIndex The index from which to start reading the dataset + * @param endIndex The index from which to stop reading the dataset + * @param outputPath The path object that will be assigned the chart data. + * @return + */ + private void generateFilledPath(final ILineDataSet dataSet, final int startIndex, final int endIndex, final Path outputPath) { + + final float fillMin = dataSet.getFillFormatter().getFillLinePosition(dataSet, mChart); + final float phaseY = mAnimator.getPhaseY(); + final boolean isDrawSteppedEnabled = dataSet.getMode() == LineDataSet.Mode.STEPPED; + + final Path filled = outputPath; + filled.reset(); + + final Entry entry = dataSet.getEntryForIndex(startIndex); + + filled.moveTo(entry.getX(), fillMin); + filled.lineTo(entry.getX(), entry.getY() * phaseY); + + // create a new path + Entry currentEntry = null; + Entry previousEntry = entry; + for (int x = startIndex + 1; x <= endIndex; x++) { + + currentEntry = dataSet.getEntryForIndex(x); + + if (isDrawSteppedEnabled) { + filled.lineTo(currentEntry.getX(), previousEntry.getY() * phaseY); + } + + filled.lineTo(currentEntry.getX(), currentEntry.getY() * phaseY); + + previousEntry = currentEntry; + } + + // close up + if (currentEntry != null) { + filled.lineTo(currentEntry.getX(), fillMin); + } + + filled.close(); + } + + @Override + public void drawValues(Canvas c) { + + if (isDrawingValuesAllowed(mChart)) { + + List<ILineDataSet> dataSets = mChart.getLineData().getDataSets(); + + for (int i = 0; i < dataSets.size(); i++) { + + ILineDataSet dataSet = dataSets.get(i); + + if (!shouldDrawValues(dataSet) || dataSet.getEntryCount() < 1) + continue; + + // apply the text-styling defined by the DataSet + applyValueTextStyle(dataSet); + + Transformer trans = mChart.getTransformer(dataSet.getAxisDependency()); + + // make sure the values do not interfear with the circles + int valOffset = (int) (dataSet.getCircleRadius() * 1.75f); + + if (!dataSet.isDrawCirclesEnabled()) + valOffset = valOffset / 2; + + mXBounds.set(mChart, dataSet); + + float[] positions = trans.generateTransformedValuesLine(dataSet, mAnimator.getPhaseX(), mAnimator + .getPhaseY(), mXBounds.min, mXBounds.max); + + MPPointF iconsOffset = MPPointF.getInstance(dataSet.getIconsOffset()); + iconsOffset.x = Utils.convertDpToPixel(iconsOffset.x); + iconsOffset.y = Utils.convertDpToPixel(iconsOffset.y); + + for (int j = 0; j < positions.length; j += 2) { + + float x = positions[j]; + float y = positions[j + 1]; + + if (!mViewPortHandler.isInBoundsRight(x)) + break; + + if (!mViewPortHandler.isInBoundsLeft(x) || !mViewPortHandler.isInBoundsY(y)) + continue; + + Entry entry = dataSet.getEntryForIndex(j / 2 + mXBounds.min); + + if (dataSet.isDrawValuesEnabled()) { + drawValue(c, dataSet.getValueFormatter(), entry.getY(), entry, i, x, + y - valOffset, dataSet.getValueTextColor(j / 2)); + } + + if (entry.getIcon() != null && dataSet.isDrawIconsEnabled()) { + + Drawable icon = entry.getIcon(); + + Utils.drawImage( + c, + icon, + (int)(x + iconsOffset.x), + (int)(y + iconsOffset.y), + icon.getIntrinsicWidth(), + icon.getIntrinsicHeight()); + } + } + + MPPointF.recycleInstance(iconsOffset); + } + } + } + + @Override + public void drawExtras(Canvas c) { + drawCircles(c); + } + + /** + * cache for the circle bitmaps of all datasets + */ + private HashMap<IDataSet, DataSetImageCache> mImageCaches = new HashMap<>(); + + /** + * buffer for drawing the circles + */ + private float[] mCirclesBuffer = new float[2]; + + protected void drawCircles(Canvas c) { + + mRenderPaint.setStyle(Paint.Style.FILL); + + float phaseY = mAnimator.getPhaseY(); + + mCirclesBuffer[0] = 0; + mCirclesBuffer[1] = 0; + + List<ILineDataSet> dataSets = mChart.getLineData().getDataSets(); + + for (int i = 0; i < dataSets.size(); i++) { + + ILineDataSet dataSet = dataSets.get(i); + + if (!dataSet.isVisible() || !dataSet.isDrawCirclesEnabled() || + dataSet.getEntryCount() == 0) + continue; + + mCirclePaintInner.setColor(dataSet.getCircleHoleColor()); + + Transformer trans = mChart.getTransformer(dataSet.getAxisDependency()); + + mXBounds.set(mChart, dataSet); + + float circleRadius = dataSet.getCircleRadius(); + float circleHoleRadius = dataSet.getCircleHoleRadius(); + boolean drawCircleHole = dataSet.isDrawCircleHoleEnabled() && + circleHoleRadius < circleRadius && + circleHoleRadius > 0.f; + boolean drawTransparentCircleHole = drawCircleHole && + dataSet.getCircleHoleColor() == ColorTemplate.COLOR_NONE; + + DataSetImageCache imageCache; + + if (mImageCaches.containsKey(dataSet)) { + imageCache = mImageCaches.get(dataSet); + } else { + imageCache = new DataSetImageCache(); + mImageCaches.put(dataSet, imageCache); + } + + boolean changeRequired = imageCache.init(dataSet); + + // only fill the cache with new bitmaps if a change is required + if (changeRequired) { + imageCache.fill(dataSet, drawCircleHole, drawTransparentCircleHole); + } + + int boundsRangeCount = mXBounds.range + mXBounds.min; + + for (int j = mXBounds.min; j <= boundsRangeCount; j++) { + + Entry e = dataSet.getEntryForIndex(j); + + if (e == null) break; + + mCirclesBuffer[0] = e.getX(); + mCirclesBuffer[1] = e.getY() * phaseY; + + trans.pointValuesToPixel(mCirclesBuffer); + + if (!mViewPortHandler.isInBoundsRight(mCirclesBuffer[0])) + break; + + if (!mViewPortHandler.isInBoundsLeft(mCirclesBuffer[0]) || + !mViewPortHandler.isInBoundsY(mCirclesBuffer[1])) + continue; + + Bitmap circleBitmap = imageCache.getBitmap(j); + + if (circleBitmap != null) { + c.drawBitmap(circleBitmap, mCirclesBuffer[0] - circleRadius, mCirclesBuffer[1] - circleRadius, null); + } + } + } + } + + @Override + public void drawHighlighted(Canvas c, Highlight[] indices) { + + LineData lineData = mChart.getLineData(); + + for (Highlight high : indices) { + + ILineDataSet set = lineData.getDataSetByIndex(high.getDataSetIndex()); + + if (set == null || !set.isHighlightEnabled()) + continue; + + Entry e = set.getEntryForXValue(high.getX(), high.getY()); + + if (!isInBoundsX(e, set)) + continue; + + MPPointD pix = mChart.getTransformer(set.getAxisDependency()).getPixelForValues(e.getX(), e.getY() * mAnimator + .getPhaseY()); + + high.setDraw((float) pix.x, (float) pix.y); + + // draw the lines + drawHighlightLines(c, (float) pix.x, (float) pix.y, set); + } + } + + /** + * Sets the Bitmap.Config to be used by this renderer. + * Default: Bitmap.Config.ARGB_8888 + * Use Bitmap.Config.ARGB_4444 to consume less memory. + * + * @param config + */ + public void setBitmapConfig(Bitmap.Config config) { + mBitmapConfig = config; + releaseBitmap(); + } + + /** + * Returns the Bitmap.Config that is used by this renderer. + * + * @return + */ + public Bitmap.Config getBitmapConfig() { + return mBitmapConfig; + } + + /** + * Releases the drawing bitmap. This should be called when {@link LineChart#onDetachedFromWindow()}. + */ + public void releaseBitmap() { + if (mBitmapCanvas != null) { + mBitmapCanvas.setBitmap(null); + mBitmapCanvas = null; + } + if (mDrawBitmap != null) { + Bitmap drawBitmap = mDrawBitmap.get(); + if (drawBitmap != null) { + drawBitmap.recycle(); + } + mDrawBitmap.clear(); + mDrawBitmap = null; + } + } + + private class DataSetImageCache { + + private Path mCirclePathBuffer = new Path(); + + private Bitmap[] circleBitmaps; + + /** + * Sets up the cache, returns true if a change of cache was required. + * + * @param set + * @return + */ + protected boolean init(ILineDataSet set) { + + int size = set.getCircleColorCount(); + boolean changeRequired = false; + + if (circleBitmaps == null) { + circleBitmaps = new Bitmap[size]; + changeRequired = true; + } else if (circleBitmaps.length != size) { + circleBitmaps = new Bitmap[size]; + changeRequired = true; + } + + return changeRequired; + } + + /** + * Fills the cache with bitmaps for the given dataset. + * + * @param set + * @param drawCircleHole + * @param drawTransparentCircleHole + */ + protected void fill(ILineDataSet set, boolean drawCircleHole, boolean drawTransparentCircleHole) { + + int colorCount = set.getCircleColorCount(); + float circleRadius = set.getCircleRadius(); + float circleHoleRadius = set.getCircleHoleRadius(); + + for (int i = 0; i < colorCount; i++) { + + Bitmap.Config conf = Bitmap.Config.ARGB_4444; + Bitmap circleBitmap = Bitmap.createBitmap((int) (circleRadius * 2.1), (int) (circleRadius * 2.1), conf); + + Canvas canvas = new Canvas(circleBitmap); + circleBitmaps[i] = circleBitmap; + mRenderPaint.setColor(set.getCircleColor(i)); + + if (drawTransparentCircleHole) { + // Begin path for circle with hole + mCirclePathBuffer.reset(); + + mCirclePathBuffer.addCircle( + circleRadius, + circleRadius, + circleRadius, + Path.Direction.CW); + + // Cut hole in path + mCirclePathBuffer.addCircle( + circleRadius, + circleRadius, + circleHoleRadius, + Path.Direction.CCW); + + // Fill in-between + canvas.drawPath(mCirclePathBuffer, mRenderPaint); + } else { + + canvas.drawCircle( + circleRadius, + circleRadius, + circleRadius, + mRenderPaint); + + if (drawCircleHole) { + canvas.drawCircle( + circleRadius, + circleRadius, + circleHoleRadius, + mCirclePaintInner); + } + } + } + } + + /** + * Returns the cached Bitmap at the given index. + * + * @param index + * @return + */ + protected Bitmap getBitmap(int index) { + return circleBitmaps[index % circleBitmaps.length]; + } + } +} diff --git a/MPChartLib/src/main/java/com/github/mikephil/charting/renderer/LineRadarRenderer.java b/MPChartLib/src/main/java/com/github/mikephil/charting/renderer/LineRadarRenderer.java new file mode 100644 index 00000000..288eff64 --- /dev/null +++ b/MPChartLib/src/main/java/com/github/mikephil/charting/renderer/LineRadarRenderer.java @@ -0,0 +1,95 @@ +package com.github.mikephil.charting.renderer; + +import android.graphics.Canvas; +import android.graphics.Paint; +import android.graphics.Path; +import android.graphics.drawable.Drawable; + +import com.github.mikephil.charting.animation.ChartAnimator; +import com.github.mikephil.charting.utils.Utils; +import com.github.mikephil.charting.utils.ViewPortHandler; + +/** + * Created by Philipp Jahoda on 25/01/16. + */ +public abstract class LineRadarRenderer extends LineScatterCandleRadarRenderer { + + public LineRadarRenderer(ChartAnimator animator, ViewPortHandler viewPortHandler) { + super(animator, viewPortHandler); + } + + /** + * Draws the provided path in filled mode with the provided drawable. + * + * @param c + * @param filledPath + * @param drawable + */ + protected void drawFilledPath(Canvas c, Path filledPath, Drawable drawable) { + + if (clipPathSupported()) { + + int save = c.save(); + c.clipPath(filledPath); + + drawable.setBounds((int) mViewPortHandler.contentLeft(), + (int) mViewPortHandler.contentTop(), + (int) mViewPortHandler.contentRight(), + (int) mViewPortHandler.contentBottom()); + drawable.draw(c); + + c.restoreToCount(save); + } else { + throw new RuntimeException("Fill-drawables not (yet) supported below API level 18, " + + "this code was run on API level " + Utils.getSDKInt() + "."); + } + } + + /** + * Draws the provided path in filled mode with the provided color and alpha. + * Special thanks to Angelo Suzuki (https://github.com/tinsukE) for this. + * + * @param c + * @param filledPath + * @param fillColor + * @param fillAlpha + */ + protected void drawFilledPath(Canvas c, Path filledPath, int fillColor, int fillAlpha) { + + int color = (fillAlpha << 24) | (fillColor & 0xffffff); + + if (clipPathSupported()) { + + int save = c.save(); + + c.clipPath(filledPath); + + c.drawColor(color); + c.restoreToCount(save); + } else { + + // save + Paint.Style previous = mRenderPaint.getStyle(); + int previousColor = mRenderPaint.getColor(); + + // set + mRenderPaint.setStyle(Paint.Style.FILL); + mRenderPaint.setColor(color); + + c.drawPath(filledPath, mRenderPaint); + + // restore + mRenderPaint.setColor(previousColor); + mRenderPaint.setStyle(previous); + } + } + + /** + * Clip path with hardware acceleration only working properly on API level 18 and above. + * + * @return + */ + private boolean clipPathSupported() { + return Utils.getSDKInt() >= 18; + } +} diff --git a/MPChartLib/src/main/java/com/github/mikephil/charting/renderer/LineScatterCandleRadarRenderer.java b/MPChartLib/src/main/java/com/github/mikephil/charting/renderer/LineScatterCandleRadarRenderer.java new file mode 100644 index 00000000..53f54cbf --- /dev/null +++ b/MPChartLib/src/main/java/com/github/mikephil/charting/renderer/LineScatterCandleRadarRenderer.java @@ -0,0 +1,63 @@ +package com.github.mikephil.charting.renderer; + +import android.graphics.Canvas; +import android.graphics.Path; + +import com.github.mikephil.charting.animation.ChartAnimator; +import com.github.mikephil.charting.interfaces.datasets.ILineScatterCandleRadarDataSet; +import com.github.mikephil.charting.utils.ViewPortHandler; + +/** + * Created by Philipp Jahoda on 11/07/15. + */ +public abstract class LineScatterCandleRadarRenderer extends BarLineScatterCandleBubbleRenderer { + + /** + * path that is used for drawing highlight-lines (drawLines(...) cannot be used because of dashes) + */ + private Path mHighlightLinePath = new Path(); + + public LineScatterCandleRadarRenderer(ChartAnimator animator, ViewPortHandler viewPortHandler) { + super(animator, viewPortHandler); + } + + /** + * Draws vertical & horizontal highlight-lines if enabled. + * + * @param c + * @param x x-position of the highlight line intersection + * @param y y-position of the highlight line intersection + * @param set the currently drawn dataset + */ + protected void drawHighlightLines(Canvas c, float x, float y, ILineScatterCandleRadarDataSet set) { + + // set color and stroke-width + mHighlightPaint.setColor(set.getHighLightColor()); + mHighlightPaint.setStrokeWidth(set.getHighlightLineWidth()); + + // draw highlighted lines (if enabled) + mHighlightPaint.setPathEffect(set.getDashPathEffectHighlight()); + + // draw vertical highlight lines + if (set.isVerticalHighlightIndicatorEnabled()) { + + // create vertical path + mHighlightLinePath.reset(); + mHighlightLinePath.moveTo(x, mViewPortHandler.contentTop()); + mHighlightLinePath.lineTo(x, mViewPortHandler.contentBottom()); + + c.drawPath(mHighlightLinePath, mHighlightPaint); + } + + // draw horizontal highlight lines + if (set.isHorizontalHighlightIndicatorEnabled()) { + + // create horizontal path + mHighlightLinePath.reset(); + mHighlightLinePath.moveTo(mViewPortHandler.contentLeft(), y); + mHighlightLinePath.lineTo(mViewPortHandler.contentRight(), y); + + c.drawPath(mHighlightLinePath, mHighlightPaint); + } + } +} diff --git a/MPChartLib/src/main/java/com/github/mikephil/charting/renderer/PieChartRenderer.java b/MPChartLib/src/main/java/com/github/mikephil/charting/renderer/PieChartRenderer.java new file mode 100644 index 00000000..f35c775d --- /dev/null +++ b/MPChartLib/src/main/java/com/github/mikephil/charting/renderer/PieChartRenderer.java @@ -0,0 +1,1070 @@ + +package com.github.mikephil.charting.renderer; + +import android.graphics.Bitmap; +import android.graphics.Canvas; +import android.graphics.Color; +import android.graphics.Paint; +import android.graphics.Paint.Align; +import android.graphics.Paint.Style; +import android.graphics.Path; +import android.graphics.RectF; +import android.graphics.drawable.Drawable; +import android.os.Build; +import android.text.Layout; +import android.text.StaticLayout; +import android.text.TextPaint; + +import com.github.mikephil.charting.animation.ChartAnimator; +import com.github.mikephil.charting.charts.LineChart; +import com.github.mikephil.charting.charts.PieChart; +import com.github.mikephil.charting.data.Entry; +import com.github.mikephil.charting.data.PieData; +import com.github.mikephil.charting.data.PieDataSet; +import com.github.mikephil.charting.data.PieEntry; +import com.github.mikephil.charting.formatter.IValueFormatter; +import com.github.mikephil.charting.highlight.Highlight; +import com.github.mikephil.charting.interfaces.datasets.IPieDataSet; +import com.github.mikephil.charting.utils.ColorTemplate; +import com.github.mikephil.charting.utils.MPPointF; +import com.github.mikephil.charting.utils.Utils; +import com.github.mikephil.charting.utils.ViewPortHandler; + +import java.lang.ref.WeakReference; +import java.util.List; + +public class PieChartRenderer extends DataRenderer { + + protected PieChart mChart; + + /** + * paint for the hole in the center of the pie chart and the transparent + * circle + */ + protected Paint mHolePaint; + protected Paint mTransparentCirclePaint; + protected Paint mValueLinePaint; + + /** + * paint object for the text that can be displayed in the center of the + * chart + */ + private TextPaint mCenterTextPaint; + + /** + * paint object used for drwing the slice-text + */ + private Paint mEntryLabelsPaint; + + private StaticLayout mCenterTextLayout; + private CharSequence mCenterTextLastValue; + private RectF mCenterTextLastBounds = new RectF(); + private RectF[] mRectBuffer = {new RectF(), new RectF(), new RectF()}; + + /** + * Bitmap for drawing the center hole + */ + protected WeakReference<Bitmap> mDrawBitmap; + + protected Canvas mBitmapCanvas; + + public PieChartRenderer(PieChart chart, ChartAnimator animator, + ViewPortHandler viewPortHandler) { + super(animator, viewPortHandler); + mChart = chart; + + mHolePaint = new Paint(Paint.ANTI_ALIAS_FLAG); + mHolePaint.setColor(Color.WHITE); + mHolePaint.setStyle(Style.FILL); + + mTransparentCirclePaint = new Paint(Paint.ANTI_ALIAS_FLAG); + mTransparentCirclePaint.setColor(Color.WHITE); + mTransparentCirclePaint.setStyle(Style.FILL); + mTransparentCirclePaint.setAlpha(105); + + mCenterTextPaint = new TextPaint(Paint.ANTI_ALIAS_FLAG); + mCenterTextPaint.setColor(Color.BLACK); + mCenterTextPaint.setTextSize(Utils.convertDpToPixel(12f)); + + mValuePaint.setTextSize(Utils.convertDpToPixel(13f)); + mValuePaint.setColor(Color.WHITE); + mValuePaint.setTextAlign(Align.CENTER); + + mEntryLabelsPaint = new Paint(Paint.ANTI_ALIAS_FLAG); + mEntryLabelsPaint.setColor(Color.WHITE); + mEntryLabelsPaint.setTextAlign(Align.CENTER); + mEntryLabelsPaint.setTextSize(Utils.convertDpToPixel(13f)); + + mValueLinePaint = new Paint(Paint.ANTI_ALIAS_FLAG); + mValueLinePaint.setStyle(Style.STROKE); + } + + public Paint getPaintHole() { + return mHolePaint; + } + + public Paint getPaintTransparentCircle() { + return mTransparentCirclePaint; + } + + public TextPaint getPaintCenterText() { + return mCenterTextPaint; + } + + public Paint getPaintEntryLabels() { + return mEntryLabelsPaint; + } + + @Override + public void initBuffers() { + // TODO Auto-generated method stub + } + + @Override + public void drawData(Canvas c) { + + int width = (int) mViewPortHandler.getChartWidth(); + int height = (int) mViewPortHandler.getChartHeight(); + + Bitmap drawBitmap = mDrawBitmap == null ? null : mDrawBitmap.get(); + + if (drawBitmap == null + || (drawBitmap.getWidth() != width) + || (drawBitmap.getHeight() != height)) { + + if (width > 0 && height > 0) { + drawBitmap = Bitmap.createBitmap(width, height, Bitmap.Config.ARGB_4444); + mDrawBitmap = new WeakReference<>(drawBitmap); + mBitmapCanvas = new Canvas(drawBitmap); + } else + return; + } + + drawBitmap.eraseColor(Color.TRANSPARENT); + + PieData pieData = mChart.getData(); + + for (IPieDataSet set : pieData.getDataSets()) { + + if (set.isVisible() && set.getEntryCount() > 0) + drawDataSet(c, set); + } + } + + private Path mPathBuffer = new Path(); + private RectF mInnerRectBuffer = new RectF(); + + protected float calculateMinimumRadiusForSpacedSlice( + MPPointF center, + float radius, + float angle, + float arcStartPointX, + float arcStartPointY, + float startAngle, + float sweepAngle) { + final float angleMiddle = startAngle + sweepAngle / 2.f; + + // Other point of the arc + float arcEndPointX = center.x + radius * (float) Math.cos((startAngle + sweepAngle) * Utils.FDEG2RAD); + float arcEndPointY = center.y + radius * (float) Math.sin((startAngle + sweepAngle) * Utils.FDEG2RAD); + + // Middle point on the arc + float arcMidPointX = center.x + radius * (float) Math.cos(angleMiddle * Utils.FDEG2RAD); + float arcMidPointY = center.y + radius * (float) Math.sin(angleMiddle * Utils.FDEG2RAD); + + // This is the base of the contained triangle + double basePointsDistance = Math.sqrt( + Math.pow(arcEndPointX - arcStartPointX, 2) + + Math.pow(arcEndPointY - arcStartPointY, 2)); + + // After reducing space from both sides of the "slice", + // the angle of the contained triangle should stay the same. + // So let's find out the height of that triangle. + float containedTriangleHeight = (float) (basePointsDistance / 2.0 * + Math.tan((180.0 - angle) / 2.0 * Utils.DEG2RAD)); + + // Now we subtract that from the radius + float spacedRadius = radius - containedTriangleHeight; + + // And now subtract the height of the arc that's between the triangle and the outer circle + spacedRadius -= Math.sqrt( + Math.pow(arcMidPointX - (arcEndPointX + arcStartPointX) / 2.f, 2) + + Math.pow(arcMidPointY - (arcEndPointY + arcStartPointY) / 2.f, 2)); + + return spacedRadius; + } + + /** + * Calculates the sliceSpace to use based on visible values and their size compared to the set sliceSpace. + * + * @param dataSet + * @return + */ + protected float getSliceSpace(IPieDataSet dataSet) { + + if (!dataSet.isAutomaticallyDisableSliceSpacingEnabled()) + return dataSet.getSliceSpace(); + + float spaceSizeRatio = dataSet.getSliceSpace() / mViewPortHandler.getSmallestContentExtension(); + float minValueRatio = dataSet.getYMin() / mChart.getData().getYValueSum() * 2; + + float sliceSpace = spaceSizeRatio > minValueRatio ? 0f : dataSet.getSliceSpace(); + + return sliceSpace; + } + + protected void drawDataSet(Canvas c, IPieDataSet dataSet) { + + float angle = 0; + float rotationAngle = mChart.getRotationAngle(); + + float phaseX = mAnimator.getPhaseX(); + float phaseY = mAnimator.getPhaseY(); + + final RectF circleBox = mChart.getCircleBox(); + + final int entryCount = dataSet.getEntryCount(); + final float[] drawAngles = mChart.getDrawAngles(); + final MPPointF center = mChart.getCenterCircleBox(); + final float radius = mChart.getRadius(); + final boolean drawInnerArc = mChart.isDrawHoleEnabled() && !mChart.isDrawSlicesUnderHoleEnabled(); + final float userInnerRadius = drawInnerArc + ? radius * (mChart.getHoleRadius() / 100.f) + : 0.f; + final float roundedRadius = (radius - (radius * mChart.getHoleRadius() / 100f)) / 2f; + final RectF roundedCircleBox = new RectF(); + final boolean drawRoundedSlices = drawInnerArc && mChart.isDrawRoundedSlicesEnabled(); + + int visibleAngleCount = 0; + for (int j = 0; j < entryCount; j++) { + // draw only if the value is greater than zero + if ((Math.abs(dataSet.getEntryForIndex(j).getY()) > Utils.FLOAT_EPSILON)) { + visibleAngleCount++; + } + } + + final float sliceSpace = visibleAngleCount <= 1 ? 0.f : getSliceSpace(dataSet); + + for (int j = 0; j < entryCount; j++) { + + float sliceAngle = drawAngles[j]; + float innerRadius = userInnerRadius; + + Entry e = dataSet.getEntryForIndex(j); + + // draw only if the value is greater than zero + if (!(Math.abs(e.getY()) > Utils.FLOAT_EPSILON)) { + angle += sliceAngle * phaseX; + continue; + } + + // Don't draw if it's highlighted, unless the chart uses rounded slices + if (dataSet.isHighlightEnabled() && mChart.needsHighlight(j) && !drawRoundedSlices) { + angle += sliceAngle * phaseX; + continue; + } + + final boolean accountForSliceSpacing = sliceSpace > 0.f && sliceAngle <= 180.f; + + mRenderPaint.setColor(dataSet.getColor(j)); + + final float sliceSpaceAngleOuter = visibleAngleCount == 1 ? + 0.f : + sliceSpace / (Utils.FDEG2RAD * radius); + final float startAngleOuter = rotationAngle + (angle + sliceSpaceAngleOuter / 2.f) * phaseY; + float sweepAngleOuter = (sliceAngle - sliceSpaceAngleOuter) * phaseY; + if (sweepAngleOuter < 0.f) { + sweepAngleOuter = 0.f; + } + + mPathBuffer.reset(); + + if (drawRoundedSlices) { + float x = center.x + (radius - roundedRadius) * (float) Math.cos(startAngleOuter * Utils.FDEG2RAD); + float y = center.y + (radius - roundedRadius) * (float) Math.sin(startAngleOuter * Utils.FDEG2RAD); + roundedCircleBox.set(x - roundedRadius, y - roundedRadius, x + roundedRadius, y + roundedRadius); + } + + float arcStartPointX = center.x + radius * (float) Math.cos(startAngleOuter * Utils.FDEG2RAD); + float arcStartPointY = center.y + radius * (float) Math.sin(startAngleOuter * Utils.FDEG2RAD); + + if (sweepAngleOuter >= 360.f && sweepAngleOuter % 360f <= Utils.FLOAT_EPSILON) { + // Android is doing "mod 360" + mPathBuffer.addCircle(center.x, center.y, radius, Path.Direction.CW); + } else { + + if (drawRoundedSlices) { + mPathBuffer.arcTo(roundedCircleBox, startAngleOuter + 180, -180); + } + + mPathBuffer.arcTo( + circleBox, + startAngleOuter, + sweepAngleOuter + ); + } + + // API < 21 does not receive floats in addArc, but a RectF + mInnerRectBuffer.set( + center.x - innerRadius, + center.y - innerRadius, + center.x + innerRadius, + center.y + innerRadius); + + if (drawInnerArc && (innerRadius > 0.f || accountForSliceSpacing)) { + + if (accountForSliceSpacing) { + float minSpacedRadius = + calculateMinimumRadiusForSpacedSlice( + center, radius, + sliceAngle * phaseY, + arcStartPointX, arcStartPointY, + startAngleOuter, + sweepAngleOuter); + + if (minSpacedRadius < 0.f) + minSpacedRadius = -minSpacedRadius; + + innerRadius = Math.max(innerRadius, minSpacedRadius); + } + + final float sliceSpaceAngleInner = visibleAngleCount == 1 || innerRadius == 0.f ? + 0.f : + sliceSpace / (Utils.FDEG2RAD * innerRadius); + final float startAngleInner = rotationAngle + (angle + sliceSpaceAngleInner / 2.f) * phaseY; + float sweepAngleInner = (sliceAngle - sliceSpaceAngleInner) * phaseY; + if (sweepAngleInner < 0.f) { + sweepAngleInner = 0.f; + } + final float endAngleInner = startAngleInner + sweepAngleInner; + + if (sweepAngleOuter >= 360.f && sweepAngleOuter % 360f <= Utils.FLOAT_EPSILON) { + // Android is doing "mod 360" + mPathBuffer.addCircle(center.x, center.y, innerRadius, Path.Direction.CCW); + } else { + + if (drawRoundedSlices) { + float x = center.x + (radius - roundedRadius) * (float) Math.cos(endAngleInner * Utils.FDEG2RAD); + float y = center.y + (radius - roundedRadius) * (float) Math.sin(endAngleInner * Utils.FDEG2RAD); + roundedCircleBox.set(x - roundedRadius, y - roundedRadius, x + roundedRadius, y + roundedRadius); + mPathBuffer.arcTo(roundedCircleBox, endAngleInner, 180); + } else + mPathBuffer.lineTo( + center.x + innerRadius * (float) Math.cos(endAngleInner * Utils.FDEG2RAD), + center.y + innerRadius * (float) Math.sin(endAngleInner * Utils.FDEG2RAD)); + + mPathBuffer.arcTo( + mInnerRectBuffer, + endAngleInner, + -sweepAngleInner + ); + } + } else { + + if (sweepAngleOuter % 360f > Utils.FLOAT_EPSILON) { + if (accountForSliceSpacing) { + + float angleMiddle = startAngleOuter + sweepAngleOuter / 2.f; + + float sliceSpaceOffset = + calculateMinimumRadiusForSpacedSlice( + center, + radius, + sliceAngle * phaseY, + arcStartPointX, + arcStartPointY, + startAngleOuter, + sweepAngleOuter); + + float arcEndPointX = center.x + + sliceSpaceOffset * (float) Math.cos(angleMiddle * Utils.FDEG2RAD); + float arcEndPointY = center.y + + sliceSpaceOffset * (float) Math.sin(angleMiddle * Utils.FDEG2RAD); + + mPathBuffer.lineTo( + arcEndPointX, + arcEndPointY); + + } else { + mPathBuffer.lineTo( + center.x, + center.y); + } + } + + } + + mPathBuffer.close(); + + mBitmapCanvas.drawPath(mPathBuffer, mRenderPaint); + + angle += sliceAngle * phaseX; + } + + MPPointF.recycleInstance(center); + } + + @Override + public void drawValues(Canvas c) { + + MPPointF center = mChart.getCenterCircleBox(); + + // get whole the radius + float radius = mChart.getRadius(); + float rotationAngle = mChart.getRotationAngle(); + float[] drawAngles = mChart.getDrawAngles(); + float[] absoluteAngles = mChart.getAbsoluteAngles(); + + float phaseX = mAnimator.getPhaseX(); + float phaseY = mAnimator.getPhaseY(); + + final float roundedRadius = (radius - (radius * mChart.getHoleRadius() / 100f)) / 2f; + final float holeRadiusPercent = mChart.getHoleRadius() / 100.f; + float labelRadiusOffset = radius / 10f * 3.6f; + + if (mChart.isDrawHoleEnabled()) { + labelRadiusOffset = (radius - (radius * holeRadiusPercent)) / 2f; + + if (!mChart.isDrawSlicesUnderHoleEnabled() && mChart.isDrawRoundedSlicesEnabled()) { + // Add curved circle slice and spacing to rotation angle, so that it sits nicely inside + rotationAngle += roundedRadius * 360 / (Math.PI * 2 * radius); + } + } + + final float labelRadius = radius - labelRadiusOffset; + + PieData data = mChart.getData(); + List<IPieDataSet> dataSets = data.getDataSets(); + + float yValueSum = data.getYValueSum(); + + boolean drawEntryLabels = mChart.isDrawEntryLabelsEnabled(); + + float angle; + int xIndex = 0; + + c.save(); + + float offset = Utils.convertDpToPixel(5.f); + + for (int i = 0; i < dataSets.size(); i++) { + + IPieDataSet dataSet = dataSets.get(i); + + final boolean drawValues = dataSet.isDrawValuesEnabled(); + + if (!drawValues && !drawEntryLabels) + continue; + + final PieDataSet.ValuePosition xValuePosition = dataSet.getXValuePosition(); + final PieDataSet.ValuePosition yValuePosition = dataSet.getYValuePosition(); + + // apply the text-styling defined by the DataSet + applyValueTextStyle(dataSet); + + float lineHeight = Utils.calcTextHeight(mValuePaint, "Q") + + Utils.convertDpToPixel(4f); + + IValueFormatter formatter = dataSet.getValueFormatter(); + + int entryCount = dataSet.getEntryCount(); + + boolean isUseValueColorForLineEnabled = dataSet.isUseValueColorForLineEnabled(); + int valueLineColor = dataSet.getValueLineColor(); + + mValueLinePaint.setStrokeWidth(Utils.convertDpToPixel(dataSet.getValueLineWidth())); + + final float sliceSpace = getSliceSpace(dataSet); + + MPPointF iconsOffset = MPPointF.getInstance(dataSet.getIconsOffset()); + iconsOffset.x = Utils.convertDpToPixel(iconsOffset.x); + iconsOffset.y = Utils.convertDpToPixel(iconsOffset.y); + + for (int j = 0; j < entryCount; j++) { + + PieEntry entry = dataSet.getEntryForIndex(j); + + if (xIndex == 0) + angle = 0.f; + else + angle = absoluteAngles[xIndex - 1] * phaseX; + + final float sliceAngle = drawAngles[xIndex]; + final float sliceSpaceMiddleAngle = sliceSpace / (Utils.FDEG2RAD * labelRadius); + + // offset needed to center the drawn text in the slice + final float angleOffset = (sliceAngle - sliceSpaceMiddleAngle / 2.f) / 2.f; + + angle = angle + angleOffset; + + final float transformedAngle = rotationAngle + angle * phaseY; + + float value = mChart.isUsePercentValuesEnabled() ? entry.getY() + / yValueSum * 100f : entry.getY(); + String entryLabel = entry.getLabel(); + + final float sliceXBase = (float) Math.cos(transformedAngle * Utils.FDEG2RAD); + final float sliceYBase = (float) Math.sin(transformedAngle * Utils.FDEG2RAD); + + final boolean drawXOutside = drawEntryLabels && + xValuePosition == PieDataSet.ValuePosition.OUTSIDE_SLICE; + final boolean drawYOutside = drawValues && + yValuePosition == PieDataSet.ValuePosition.OUTSIDE_SLICE; + final boolean drawXInside = drawEntryLabels && + xValuePosition == PieDataSet.ValuePosition.INSIDE_SLICE; + final boolean drawYInside = drawValues && + yValuePosition == PieDataSet.ValuePosition.INSIDE_SLICE; + + if (drawXOutside || drawYOutside) { + + final float valueLineLength1 = dataSet.getValueLinePart1Length(); + final float valueLineLength2 = dataSet.getValueLinePart2Length(); + final float valueLinePart1OffsetPercentage = dataSet.getValueLinePart1OffsetPercentage() / 100.f; + + float pt2x, pt2y; + float labelPtx, labelPty; + + float line1Radius; + + if (mChart.isDrawHoleEnabled()) + line1Radius = (radius - (radius * holeRadiusPercent)) + * valueLinePart1OffsetPercentage + + (radius * holeRadiusPercent); + else + line1Radius = radius * valueLinePart1OffsetPercentage; + + final float polyline2Width = dataSet.isValueLineVariableLength() + ? labelRadius * valueLineLength2 * (float) Math.abs(Math.sin( + transformedAngle * Utils.FDEG2RAD)) + : labelRadius * valueLineLength2; + + final float pt0x = line1Radius * sliceXBase + center.x; + final float pt0y = line1Radius * sliceYBase + center.y; + + final float pt1x = labelRadius * (1 + valueLineLength1) * sliceXBase + center.x; + final float pt1y = labelRadius * (1 + valueLineLength1) * sliceYBase + center.y; + + if (transformedAngle % 360.0 >= 90.0 && transformedAngle % 360.0 <= 270.0) { + pt2x = pt1x - polyline2Width; + pt2y = pt1y; + + mValuePaint.setTextAlign(Align.RIGHT); + + if(drawXOutside) + mEntryLabelsPaint.setTextAlign(Align.RIGHT); + + labelPtx = pt2x - offset; + labelPty = pt2y; + } else { + pt2x = pt1x + polyline2Width; + pt2y = pt1y; + mValuePaint.setTextAlign(Align.LEFT); + + if(drawXOutside) + mEntryLabelsPaint.setTextAlign(Align.LEFT); + + labelPtx = pt2x + offset; + labelPty = pt2y; + } + + int lineColor = ColorTemplate.COLOR_NONE; + + if (isUseValueColorForLineEnabled) + lineColor = dataSet.getColor(j); + else if (valueLineColor != ColorTemplate.COLOR_NONE) + lineColor = valueLineColor; + + if (lineColor != ColorTemplate.COLOR_NONE) { + mValueLinePaint.setColor(lineColor); + c.drawLine(pt0x, pt0y, pt1x, pt1y, mValueLinePaint); + c.drawLine(pt1x, pt1y, pt2x, pt2y, mValueLinePaint); + } + + // draw everything, depending on settings + if (drawXOutside && drawYOutside) { + + drawValue(c, + formatter, + value, + entry, + 0, + labelPtx, + labelPty, + dataSet.getValueTextColor(j)); + + if (j < data.getEntryCount() && entryLabel != null) { + drawEntryLabel(c, entryLabel, labelPtx, labelPty + lineHeight); + } + + } else if (drawXOutside) { + if (j < data.getEntryCount() && entryLabel != null) { + drawEntryLabel(c, entryLabel, labelPtx, labelPty + lineHeight / 2.f); + } + } else if (drawYOutside) { + + drawValue(c, formatter, value, entry, 0, labelPtx, labelPty + lineHeight / 2.f, dataSet + .getValueTextColor(j)); + } + } + + if (drawXInside || drawYInside) { + // calculate the text position + float x = labelRadius * sliceXBase + center.x; + float y = labelRadius * sliceYBase + center.y; + + mValuePaint.setTextAlign(Align.CENTER); + + // draw everything, depending on settings + if (drawXInside && drawYInside) { + + drawValue(c, formatter, value, entry, 0, x, y, dataSet.getValueTextColor(j)); + + if (j < data.getEntryCount() && entryLabel != null) { + drawEntryLabel(c, entryLabel, x, y + lineHeight); + } + + } else if (drawXInside) { + if (j < data.getEntryCount() && entryLabel != null) { + drawEntryLabel(c, entryLabel, x, y + lineHeight / 2f); + } + } else if (drawYInside) { + + drawValue(c, formatter, value, entry, 0, x, y + lineHeight / 2f, dataSet.getValueTextColor(j)); + } + } + + if (entry.getIcon() != null && dataSet.isDrawIconsEnabled()) { + + Drawable icon = entry.getIcon(); + + float x = (labelRadius + iconsOffset.y) * sliceXBase + center.x; + float y = (labelRadius + iconsOffset.y) * sliceYBase + center.y; + y += iconsOffset.x; + + Utils.drawImage( + c, + icon, + (int)x, + (int)y, + icon.getIntrinsicWidth(), + icon.getIntrinsicHeight()); + } + + xIndex++; + } + + MPPointF.recycleInstance(iconsOffset); + } + MPPointF.recycleInstance(center); + c.restore(); + } + + /** + * Draws an entry label at the specified position. + * + * @param c + * @param label + * @param x + * @param y + */ + protected void drawEntryLabel(Canvas c, String label, float x, float y) { + c.drawText(label, x, y, mEntryLabelsPaint); + } + + @Override + public void drawExtras(Canvas c) { + drawHole(c); + c.drawBitmap(mDrawBitmap.get(), 0, 0, null); + drawCenterText(c); + } + + private Path mHoleCirclePath = new Path(); + + /** + * draws the hole in the center of the chart and the transparent circle / + * hole + */ + protected void drawHole(Canvas c) { + + if (mChart.isDrawHoleEnabled() && mBitmapCanvas != null) { + + float radius = mChart.getRadius(); + float holeRadius = radius * (mChart.getHoleRadius() / 100); + MPPointF center = mChart.getCenterCircleBox(); + + if (Color.alpha(mHolePaint.getColor()) > 0) { + // draw the hole-circle + mBitmapCanvas.drawCircle( + center.x, center.y, + holeRadius, mHolePaint); + } + + // only draw the circle if it can be seen (not covered by the hole) + if (Color.alpha(mTransparentCirclePaint.getColor()) > 0 && + mChart.getTransparentCircleRadius() > mChart.getHoleRadius()) { + + int alpha = mTransparentCirclePaint.getAlpha(); + float secondHoleRadius = radius * (mChart.getTransparentCircleRadius() / 100); + + mTransparentCirclePaint.setAlpha((int) ((float) alpha * mAnimator.getPhaseX() * mAnimator.getPhaseY())); + + // draw the transparent-circle + mHoleCirclePath.reset(); + mHoleCirclePath.addCircle(center.x, center.y, secondHoleRadius, Path.Direction.CW); + mHoleCirclePath.addCircle(center.x, center.y, holeRadius, Path.Direction.CCW); + mBitmapCanvas.drawPath(mHoleCirclePath, mTransparentCirclePaint); + + // reset alpha + mTransparentCirclePaint.setAlpha(alpha); + } + MPPointF.recycleInstance(center); + } + } + + protected Path mDrawCenterTextPathBuffer = new Path(); + /** + * draws the description text in the center of the pie chart makes most + * sense when center-hole is enabled + */ + protected void drawCenterText(Canvas c) { + + CharSequence centerText = mChart.getCenterText(); + + if (mChart.isDrawCenterTextEnabled() && centerText != null) { + + MPPointF center = mChart.getCenterCircleBox(); + MPPointF offset = mChart.getCenterTextOffset(); + + float x = center.x + offset.x; + float y = center.y + offset.y; + + float innerRadius = mChart.isDrawHoleEnabled() && !mChart.isDrawSlicesUnderHoleEnabled() + ? mChart.getRadius() * (mChart.getHoleRadius() / 100f) + : mChart.getRadius(); + + RectF holeRect = mRectBuffer[0]; + holeRect.left = x - innerRadius; + holeRect.top = y - innerRadius; + holeRect.right = x + innerRadius; + holeRect.bottom = y + innerRadius; + RectF boundingRect = mRectBuffer[1]; + boundingRect.set(holeRect); + + float radiusPercent = mChart.getCenterTextRadiusPercent() / 100f; + if (radiusPercent > 0.0) { + boundingRect.inset( + (boundingRect.width() - boundingRect.width() * radiusPercent) / 2.f, + (boundingRect.height() - boundingRect.height() * radiusPercent) / 2.f + ); + } + + if (!centerText.equals(mCenterTextLastValue) || !boundingRect.equals(mCenterTextLastBounds)) { + + // Next time we won't recalculate StaticLayout... + mCenterTextLastBounds.set(boundingRect); + mCenterTextLastValue = centerText; + + float width = mCenterTextLastBounds.width(); + + // If width is 0, it will crash. Always have a minimum of 1 + mCenterTextLayout = new StaticLayout(centerText, 0, centerText.length(), + mCenterTextPaint, + (int) Math.max(Math.ceil(width), 1.f), + Layout.Alignment.ALIGN_CENTER, 1.f, 0.f, false); + } + + //float layoutWidth = Utils.getStaticLayoutMaxWidth(mCenterTextLayout); + float layoutHeight = mCenterTextLayout.getHeight(); + + c.save(); + if (Build.VERSION.SDK_INT >= 18) { + Path path = mDrawCenterTextPathBuffer; + path.reset(); + path.addOval(holeRect, Path.Direction.CW); + c.clipPath(path); + } + + c.translate(boundingRect.left, boundingRect.top + (boundingRect.height() - layoutHeight) / 2.f); + mCenterTextLayout.draw(c); + + c.restore(); + + MPPointF.recycleInstance(center); + MPPointF.recycleInstance(offset); + } + } + + protected RectF mDrawHighlightedRectF = new RectF(); + @Override + public void drawHighlighted(Canvas c, Highlight[] indices) { + + /* Skip entirely if using rounded circle slices, because it doesn't make sense to highlight + * in this way. + * TODO: add support for changing slice color with highlighting rather than only shifting the slice + */ + + final boolean drawInnerArc = mChart.isDrawHoleEnabled() && !mChart.isDrawSlicesUnderHoleEnabled(); + if (drawInnerArc && mChart.isDrawRoundedSlicesEnabled()) + return; + + float phaseX = mAnimator.getPhaseX(); + float phaseY = mAnimator.getPhaseY(); + + float angle; + float rotationAngle = mChart.getRotationAngle(); + + float[] drawAngles = mChart.getDrawAngles(); + float[] absoluteAngles = mChart.getAbsoluteAngles(); + final MPPointF center = mChart.getCenterCircleBox(); + final float radius = mChart.getRadius(); + final float userInnerRadius = drawInnerArc + ? radius * (mChart.getHoleRadius() / 100.f) + : 0.f; + + final RectF highlightedCircleBox = mDrawHighlightedRectF; + highlightedCircleBox.set(0,0,0,0); + + for (int i = 0; i < indices.length; i++) { + + // get the index to highlight + int index = (int) indices[i].getX(); + + if (index >= drawAngles.length) + continue; + + IPieDataSet set = mChart.getData() + .getDataSetByIndex(indices[i].getDataSetIndex()); + + if (set == null || !set.isHighlightEnabled()) + continue; + + final int entryCount = set.getEntryCount(); + int visibleAngleCount = 0; + for (int j = 0; j < entryCount; j++) { + // draw only if the value is greater than zero + if ((Math.abs(set.getEntryForIndex(j).getY()) > Utils.FLOAT_EPSILON)) { + visibleAngleCount++; + } + } + + if (index == 0) + angle = 0.f; + else + angle = absoluteAngles[index - 1] * phaseX; + + final float sliceSpace = visibleAngleCount <= 1 ? 0.f : set.getSliceSpace(); + + float sliceAngle = drawAngles[index]; + float innerRadius = userInnerRadius; + + float shift = set.getSelectionShift(); + final float highlightedRadius = radius + shift; + highlightedCircleBox.set(mChart.getCircleBox()); + highlightedCircleBox.inset(-shift, -shift); + + final boolean accountForSliceSpacing = sliceSpace > 0.f && sliceAngle <= 180.f; + + Integer highlightColor = set.getHighlightColor(); + if (highlightColor == null) + highlightColor = set.getColor(index); + mRenderPaint.setColor(highlightColor); + + final float sliceSpaceAngleOuter = visibleAngleCount == 1 ? + 0.f : + sliceSpace / (Utils.FDEG2RAD * radius); + + final float sliceSpaceAngleShifted = visibleAngleCount == 1 ? + 0.f : + sliceSpace / (Utils.FDEG2RAD * highlightedRadius); + + final float startAngleOuter = rotationAngle + (angle + sliceSpaceAngleOuter / 2.f) * phaseY; + float sweepAngleOuter = (sliceAngle - sliceSpaceAngleOuter) * phaseY; + if (sweepAngleOuter < 0.f) { + sweepAngleOuter = 0.f; + } + + final float startAngleShifted = rotationAngle + (angle + sliceSpaceAngleShifted / 2.f) * phaseY; + float sweepAngleShifted = (sliceAngle - sliceSpaceAngleShifted) * phaseY; + if (sweepAngleShifted < 0.f) { + sweepAngleShifted = 0.f; + } + + mPathBuffer.reset(); + + if (sweepAngleOuter >= 360.f && sweepAngleOuter % 360f <= Utils.FLOAT_EPSILON) { + // Android is doing "mod 360" + mPathBuffer.addCircle(center.x, center.y, highlightedRadius, Path.Direction.CW); + } else { + + mPathBuffer.moveTo( + center.x + highlightedRadius * (float) Math.cos(startAngleShifted * Utils.FDEG2RAD), + center.y + highlightedRadius * (float) Math.sin(startAngleShifted * Utils.FDEG2RAD)); + + mPathBuffer.arcTo( + highlightedCircleBox, + startAngleShifted, + sweepAngleShifted + ); + } + + float sliceSpaceRadius = 0.f; + if (accountForSliceSpacing) { + sliceSpaceRadius = + calculateMinimumRadiusForSpacedSlice( + center, radius, + sliceAngle * phaseY, + center.x + radius * (float) Math.cos(startAngleOuter * Utils.FDEG2RAD), + center.y + radius * (float) Math.sin(startAngleOuter * Utils.FDEG2RAD), + startAngleOuter, + sweepAngleOuter); + } + + // API < 21 does not receive floats in addArc, but a RectF + mInnerRectBuffer.set( + center.x - innerRadius, + center.y - innerRadius, + center.x + innerRadius, + center.y + innerRadius); + + if (drawInnerArc && + (innerRadius > 0.f || accountForSliceSpacing)) { + + if (accountForSliceSpacing) { + float minSpacedRadius = sliceSpaceRadius; + + if (minSpacedRadius < 0.f) + minSpacedRadius = -minSpacedRadius; + + innerRadius = Math.max(innerRadius, minSpacedRadius); + } + + final float sliceSpaceAngleInner = visibleAngleCount == 1 || innerRadius == 0.f ? + 0.f : + sliceSpace / (Utils.FDEG2RAD * innerRadius); + final float startAngleInner = rotationAngle + (angle + sliceSpaceAngleInner / 2.f) * phaseY; + float sweepAngleInner = (sliceAngle - sliceSpaceAngleInner) * phaseY; + if (sweepAngleInner < 0.f) { + sweepAngleInner = 0.f; + } + final float endAngleInner = startAngleInner + sweepAngleInner; + + if (sweepAngleOuter >= 360.f && sweepAngleOuter % 360f <= Utils.FLOAT_EPSILON) { + // Android is doing "mod 360" + mPathBuffer.addCircle(center.x, center.y, innerRadius, Path.Direction.CCW); + } else { + + mPathBuffer.lineTo( + center.x + innerRadius * (float) Math.cos(endAngleInner * Utils.FDEG2RAD), + center.y + innerRadius * (float) Math.sin(endAngleInner * Utils.FDEG2RAD)); + + mPathBuffer.arcTo( + mInnerRectBuffer, + endAngleInner, + -sweepAngleInner + ); + } + } else { + + if (sweepAngleOuter % 360f > Utils.FLOAT_EPSILON) { + + if (accountForSliceSpacing) { + final float angleMiddle = startAngleOuter + sweepAngleOuter / 2.f; + + final float arcEndPointX = center.x + + sliceSpaceRadius * (float) Math.cos(angleMiddle * Utils.FDEG2RAD); + final float arcEndPointY = center.y + + sliceSpaceRadius * (float) Math.sin(angleMiddle * Utils.FDEG2RAD); + + mPathBuffer.lineTo( + arcEndPointX, + arcEndPointY); + + } else { + + mPathBuffer.lineTo( + center.x, + center.y); + } + + } + + } + + mPathBuffer.close(); + + mBitmapCanvas.drawPath(mPathBuffer, mRenderPaint); + } + + MPPointF.recycleInstance(center); + } + + /** + * This gives all pie-slices a rounded edge. + * + * @param c + */ + protected void drawRoundedSlices(Canvas c) { + + if (!mChart.isDrawRoundedSlicesEnabled()) + return; + + IPieDataSet dataSet = mChart.getData().getDataSet(); + + if (!dataSet.isVisible()) + return; + + float phaseX = mAnimator.getPhaseX(); + float phaseY = mAnimator.getPhaseY(); + + MPPointF center = mChart.getCenterCircleBox(); + float r = mChart.getRadius(); + + // calculate the radius of the "slice-circle" + float circleRadius = (r - (r * mChart.getHoleRadius() / 100f)) / 2f; + + float[] drawAngles = mChart.getDrawAngles(); + float angle = mChart.getRotationAngle(); + + for (int j = 0; j < dataSet.getEntryCount(); j++) { + + float sliceAngle = drawAngles[j]; + + Entry e = dataSet.getEntryForIndex(j); + + // draw only if the value is greater than zero + if ((Math.abs(e.getY()) > Utils.FLOAT_EPSILON)) { + + float x = (float) ((r - circleRadius) + * Math.cos(Math.toRadians((angle + sliceAngle) + * phaseY)) + center.x); + float y = (float) ((r - circleRadius) + * Math.sin(Math.toRadians((angle + sliceAngle) + * phaseY)) + center.y); + + mRenderPaint.setColor(dataSet.getColor(j)); + mBitmapCanvas.drawCircle(x, y, circleRadius, mRenderPaint); + } + + angle += sliceAngle * phaseX; + } + MPPointF.recycleInstance(center); + } + + /** + * Releases the drawing bitmap. This should be called when {@link LineChart#onDetachedFromWindow()}. + */ + public void releaseBitmap() { + if (mBitmapCanvas != null) { + mBitmapCanvas.setBitmap(null); + mBitmapCanvas = null; + } + if (mDrawBitmap != null) { + Bitmap drawBitmap = mDrawBitmap.get(); + if (drawBitmap != null) { + drawBitmap.recycle(); + } + mDrawBitmap.clear(); + mDrawBitmap = null; + } + } +} diff --git a/MPChartLib/src/main/java/com/github/mikephil/charting/renderer/RadarChartRenderer.java b/MPChartLib/src/main/java/com/github/mikephil/charting/renderer/RadarChartRenderer.java new file mode 100644 index 00000000..dbf0e8f8 --- /dev/null +++ b/MPChartLib/src/main/java/com/github/mikephil/charting/renderer/RadarChartRenderer.java @@ -0,0 +1,398 @@ + +package com.github.mikephil.charting.renderer; + +import android.graphics.Canvas; +import android.graphics.Color; +import android.graphics.Paint; +import android.graphics.Path; +import android.graphics.drawable.Drawable; + +import com.github.mikephil.charting.animation.ChartAnimator; +import com.github.mikephil.charting.charts.RadarChart; +import com.github.mikephil.charting.data.RadarData; +import com.github.mikephil.charting.data.RadarEntry; +import com.github.mikephil.charting.highlight.Highlight; +import com.github.mikephil.charting.interfaces.datasets.IRadarDataSet; +import com.github.mikephil.charting.utils.ColorTemplate; +import com.github.mikephil.charting.utils.MPPointF; +import com.github.mikephil.charting.utils.Utils; +import com.github.mikephil.charting.utils.ViewPortHandler; + +public class RadarChartRenderer extends LineRadarRenderer { + + protected RadarChart mChart; + + /** + * paint for drawing the web + */ + protected Paint mWebPaint; + protected Paint mHighlightCirclePaint; + + public RadarChartRenderer(RadarChart chart, ChartAnimator animator, + ViewPortHandler viewPortHandler) { + super(animator, viewPortHandler); + mChart = chart; + + mHighlightPaint = new Paint(Paint.ANTI_ALIAS_FLAG); + mHighlightPaint.setStyle(Paint.Style.STROKE); + mHighlightPaint.setStrokeWidth(2f); + mHighlightPaint.setColor(Color.rgb(255, 187, 115)); + + mWebPaint = new Paint(Paint.ANTI_ALIAS_FLAG); + mWebPaint.setStyle(Paint.Style.STROKE); + + mHighlightCirclePaint = new Paint(Paint.ANTI_ALIAS_FLAG); + } + + public Paint getWebPaint() { + return mWebPaint; + } + + @Override + public void initBuffers() { + // TODO Auto-generated method stub + + } + + @Override + public void drawData(Canvas c) { + + RadarData radarData = mChart.getData(); + + int mostEntries = radarData.getMaxEntryCountSet().getEntryCount(); + + for (IRadarDataSet set : radarData.getDataSets()) { + + if (set.isVisible()) { + drawDataSet(c, set, mostEntries); + } + } + } + + protected Path mDrawDataSetSurfacePathBuffer = new Path(); + /** + * Draws the RadarDataSet + * + * @param c + * @param dataSet + * @param mostEntries the entry count of the dataset with the most entries + */ + protected void drawDataSet(Canvas c, IRadarDataSet dataSet, int mostEntries) { + + float phaseX = mAnimator.getPhaseX(); + float phaseY = mAnimator.getPhaseY(); + + float sliceangle = mChart.getSliceAngle(); + + // calculate the factor that is needed for transforming the value to + // pixels + float factor = mChart.getFactor(); + + MPPointF center = mChart.getCenterOffsets(); + MPPointF pOut = MPPointF.getInstance(0,0); + Path surface = mDrawDataSetSurfacePathBuffer; + surface.reset(); + + boolean hasMovedToPoint = false; + + for (int j = 0; j < dataSet.getEntryCount(); j++) { + + mRenderPaint.setColor(dataSet.getColor(j)); + + RadarEntry e = dataSet.getEntryForIndex(j); + + Utils.getPosition( + center, + (e.getY() - mChart.getYChartMin()) * factor * phaseY, + sliceangle * j * phaseX + mChart.getRotationAngle(), pOut); + + if (Float.isNaN(pOut.x)) + continue; + + if (!hasMovedToPoint) { + surface.moveTo(pOut.x, pOut.y); + hasMovedToPoint = true; + } else + surface.lineTo(pOut.x, pOut.y); + } + + if (dataSet.getEntryCount() > mostEntries) { + // if this is not the largest set, draw a line to the center before closing + surface.lineTo(center.x, center.y); + } + + surface.close(); + + if (dataSet.isDrawFilledEnabled()) { + + final Drawable drawable = dataSet.getFillDrawable(); + if (drawable != null) { + + drawFilledPath(c, surface, drawable); + } else { + + drawFilledPath(c, surface, dataSet.getFillColor(), dataSet.getFillAlpha()); + } + } + + mRenderPaint.setStrokeWidth(dataSet.getLineWidth()); + mRenderPaint.setStyle(Paint.Style.STROKE); + + // draw the line (only if filled is disabled or alpha is below 255) + if (!dataSet.isDrawFilledEnabled() || dataSet.getFillAlpha() < 255) + c.drawPath(surface, mRenderPaint); + + MPPointF.recycleInstance(center); + MPPointF.recycleInstance(pOut); + } + + @Override + public void drawValues(Canvas c) { + + float phaseX = mAnimator.getPhaseX(); + float phaseY = mAnimator.getPhaseY(); + + float sliceangle = mChart.getSliceAngle(); + + // calculate the factor that is needed for transforming the value to + // pixels + float factor = mChart.getFactor(); + + MPPointF center = mChart.getCenterOffsets(); + MPPointF pOut = MPPointF.getInstance(0,0); + MPPointF pIcon = MPPointF.getInstance(0,0); + + float yoffset = Utils.convertDpToPixel(5f); + + for (int i = 0; i < mChart.getData().getDataSetCount(); i++) { + + IRadarDataSet dataSet = mChart.getData().getDataSetByIndex(i); + + if (!shouldDrawValues(dataSet)) + continue; + + // apply the text-styling defined by the DataSet + applyValueTextStyle(dataSet); + + MPPointF iconsOffset = MPPointF.getInstance(dataSet.getIconsOffset()); + iconsOffset.x = Utils.convertDpToPixel(iconsOffset.x); + iconsOffset.y = Utils.convertDpToPixel(iconsOffset.y); + + for (int j = 0; j < dataSet.getEntryCount(); j++) { + + RadarEntry entry = dataSet.getEntryForIndex(j); + + Utils.getPosition( + center, + (entry.getY() - mChart.getYChartMin()) * factor * phaseY, + sliceangle * j * phaseX + mChart.getRotationAngle(), + pOut); + + if (dataSet.isDrawValuesEnabled()) { + drawValue(c, + dataSet.getValueFormatter(), + entry.getY(), + entry, + i, + pOut.x, + pOut.y - yoffset, + dataSet.getValueTextColor + (j)); + } + + if (entry.getIcon() != null && dataSet.isDrawIconsEnabled()) { + + Drawable icon = entry.getIcon(); + + Utils.getPosition( + center, + (entry.getY()) * factor * phaseY + iconsOffset.y, + sliceangle * j * phaseX + mChart.getRotationAngle(), + pIcon); + + //noinspection SuspiciousNameCombination + pIcon.y += iconsOffset.x; + + Utils.drawImage( + c, + icon, + (int)pIcon.x, + (int)pIcon.y, + icon.getIntrinsicWidth(), + icon.getIntrinsicHeight()); + } + } + + MPPointF.recycleInstance(iconsOffset); + } + + MPPointF.recycleInstance(center); + MPPointF.recycleInstance(pOut); + MPPointF.recycleInstance(pIcon); + } + + @Override + public void drawExtras(Canvas c) { + drawWeb(c); + } + + protected void drawWeb(Canvas c) { + + float sliceangle = mChart.getSliceAngle(); + + // calculate the factor that is needed for transforming the value to + // pixels + float factor = mChart.getFactor(); + float rotationangle = mChart.getRotationAngle(); + + MPPointF center = mChart.getCenterOffsets(); + + // draw the web lines that come from the center + mWebPaint.setStrokeWidth(mChart.getWebLineWidth()); + mWebPaint.setColor(mChart.getWebColor()); + mWebPaint.setAlpha(mChart.getWebAlpha()); + + final int xIncrements = 1 + mChart.getSkipWebLineCount(); + int maxEntryCount = mChart.getData().getMaxEntryCountSet().getEntryCount(); + + MPPointF p = MPPointF.getInstance(0,0); + for (int i = 0; i < maxEntryCount; i += xIncrements) { + + Utils.getPosition( + center, + mChart.getYRange() * factor, + sliceangle * i + rotationangle, + p); + + c.drawLine(center.x, center.y, p.x, p.y, mWebPaint); + } + MPPointF.recycleInstance(p); + + // draw the inner-web + mWebPaint.setStrokeWidth(mChart.getWebLineWidthInner()); + mWebPaint.setColor(mChart.getWebColorInner()); + mWebPaint.setAlpha(mChart.getWebAlpha()); + + int labelCount = mChart.getYAxis().mEntryCount; + + MPPointF p1out = MPPointF.getInstance(0,0); + MPPointF p2out = MPPointF.getInstance(0,0); + for (int j = 0; j < labelCount; j++) { + + for (int i = 0; i < mChart.getData().getEntryCount(); i++) { + + float r = (mChart.getYAxis().mEntries[j] - mChart.getYChartMin()) * factor; + + Utils.getPosition(center, r, sliceangle * i + rotationangle, p1out); + Utils.getPosition(center, r, sliceangle * (i + 1) + rotationangle, p2out); + + c.drawLine(p1out.x, p1out.y, p2out.x, p2out.y, mWebPaint); + + + } + } + MPPointF.recycleInstance(p1out); + MPPointF.recycleInstance(p2out); + } + + @Override + public void drawHighlighted(Canvas c, Highlight[] indices) { + + float sliceangle = mChart.getSliceAngle(); + + // calculate the factor that is needed for transforming the value to + // pixels + float factor = mChart.getFactor(); + + MPPointF center = mChart.getCenterOffsets(); + MPPointF pOut = MPPointF.getInstance(0,0); + + RadarData radarData = mChart.getData(); + + for (Highlight high : indices) { + + IRadarDataSet set = radarData.getDataSetByIndex(high.getDataSetIndex()); + + if (set == null || !set.isHighlightEnabled()) + continue; + + RadarEntry e = set.getEntryForIndex((int) high.getX()); + + if (!isInBoundsX(e, set)) + continue; + + float y = (e.getY() - mChart.getYChartMin()); + + Utils.getPosition(center, + y * factor * mAnimator.getPhaseY(), + sliceangle * high.getX() * mAnimator.getPhaseX() + mChart.getRotationAngle(), + pOut); + + high.setDraw(pOut.x, pOut.y); + + // draw the lines + drawHighlightLines(c, pOut.x, pOut.y, set); + + if (set.isDrawHighlightCircleEnabled()) { + + if (!Float.isNaN(pOut.x) && !Float.isNaN(pOut.y)) { + + int strokeColor = set.getHighlightCircleStrokeColor(); + if (strokeColor == ColorTemplate.COLOR_NONE) { + strokeColor = set.getColor(0); + } + + if (set.getHighlightCircleStrokeAlpha() < 255) { + strokeColor = ColorTemplate.colorWithAlpha(strokeColor, set.getHighlightCircleStrokeAlpha()); + } + + drawHighlightCircle(c, + pOut, + set.getHighlightCircleInnerRadius(), + set.getHighlightCircleOuterRadius(), + set.getHighlightCircleFillColor(), + strokeColor, + set.getHighlightCircleStrokeWidth()); + } + } + } + + MPPointF.recycleInstance(center); + MPPointF.recycleInstance(pOut); + } + + protected Path mDrawHighlightCirclePathBuffer = new Path(); + public void drawHighlightCircle(Canvas c, + MPPointF point, + float innerRadius, + float outerRadius, + int fillColor, + int strokeColor, + float strokeWidth) { + c.save(); + + outerRadius = Utils.convertDpToPixel(outerRadius); + innerRadius = Utils.convertDpToPixel(innerRadius); + + if (fillColor != ColorTemplate.COLOR_NONE) { + Path p = mDrawHighlightCirclePathBuffer; + p.reset(); + p.addCircle(point.x, point.y, outerRadius, Path.Direction.CW); + if (innerRadius > 0.f) { + p.addCircle(point.x, point.y, innerRadius, Path.Direction.CCW); + } + mHighlightCirclePaint.setColor(fillColor); + mHighlightCirclePaint.setStyle(Paint.Style.FILL); + c.drawPath(p, mHighlightCirclePaint); + } + + if (strokeColor != ColorTemplate.COLOR_NONE) { + mHighlightCirclePaint.setColor(strokeColor); + mHighlightCirclePaint.setStyle(Paint.Style.STROKE); + mHighlightCirclePaint.setStrokeWidth(Utils.convertDpToPixel(strokeWidth)); + c.drawCircle(point.x, point.y, outerRadius, mHighlightCirclePaint); + } + + c.restore(); + } +} diff --git a/MPChartLib/src/main/java/com/github/mikephil/charting/renderer/Renderer.java b/MPChartLib/src/main/java/com/github/mikephil/charting/renderer/Renderer.java new file mode 100644 index 00000000..90f49683 --- /dev/null +++ b/MPChartLib/src/main/java/com/github/mikephil/charting/renderer/Renderer.java @@ -0,0 +1,21 @@ + +package com.github.mikephil.charting.renderer; + +import com.github.mikephil.charting.utils.ViewPortHandler; + +/** + * Abstract baseclass of all Renderers. + * + * @author Philipp Jahoda + */ +public abstract class Renderer { + + /** + * the component that handles the drawing area of the chart and it's offsets + */ + protected ViewPortHandler mViewPortHandler; + + public Renderer(ViewPortHandler viewPortHandler) { + this.mViewPortHandler = viewPortHandler; + } +} diff --git a/MPChartLib/src/main/java/com/github/mikephil/charting/renderer/ScatterChartRenderer.java b/MPChartLib/src/main/java/com/github/mikephil/charting/renderer/ScatterChartRenderer.java new file mode 100644 index 00000000..ccd077e5 --- /dev/null +++ b/MPChartLib/src/main/java/com/github/mikephil/charting/renderer/ScatterChartRenderer.java @@ -0,0 +1,197 @@ + +package com.github.mikephil.charting.renderer; + +import android.graphics.Canvas; +import android.graphics.drawable.Drawable; +import android.util.Log; + +import com.github.mikephil.charting.animation.ChartAnimator; +import com.github.mikephil.charting.data.Entry; +import com.github.mikephil.charting.data.ScatterData; +import com.github.mikephil.charting.highlight.Highlight; +import com.github.mikephil.charting.interfaces.dataprovider.ScatterDataProvider; +import com.github.mikephil.charting.interfaces.datasets.IScatterDataSet; +import com.github.mikephil.charting.renderer.scatter.IShapeRenderer; +import com.github.mikephil.charting.utils.MPPointD; +import com.github.mikephil.charting.utils.MPPointF; +import com.github.mikephil.charting.utils.Transformer; +import com.github.mikephil.charting.utils.Utils; +import com.github.mikephil.charting.utils.ViewPortHandler; + +import java.util.List; + +public class ScatterChartRenderer extends LineScatterCandleRadarRenderer { + + protected ScatterDataProvider mChart; + + public ScatterChartRenderer(ScatterDataProvider chart, ChartAnimator animator, ViewPortHandler viewPortHandler) { + super(animator, viewPortHandler); + mChart = chart; + } + + @Override + public void initBuffers() { + } + + @Override + public void drawData(Canvas c) { + + ScatterData scatterData = mChart.getScatterData(); + + for (IScatterDataSet set : scatterData.getDataSets()) { + + if (set.isVisible()) + drawDataSet(c, set); + } + } + + float[] mPixelBuffer = new float[2]; + + protected void drawDataSet(Canvas c, IScatterDataSet dataSet) { + + if (dataSet.getEntryCount() < 1) + return; + + ViewPortHandler viewPortHandler = mViewPortHandler; + + Transformer trans = mChart.getTransformer(dataSet.getAxisDependency()); + + float phaseY = mAnimator.getPhaseY(); + + IShapeRenderer renderer = dataSet.getShapeRenderer(); + if (renderer == null) { + Log.i("MISSING", "There's no IShapeRenderer specified for ScatterDataSet"); + return; + } + + int max = (int)(Math.min( + Math.ceil((float)dataSet.getEntryCount() * mAnimator.getPhaseX()), + (float)dataSet.getEntryCount())); + + for (int i = 0; i < max; i++) { + + Entry e = dataSet.getEntryForIndex(i); + + mPixelBuffer[0] = e.getX(); + mPixelBuffer[1] = e.getY() * phaseY; + + trans.pointValuesToPixel(mPixelBuffer); + + if (!viewPortHandler.isInBoundsRight(mPixelBuffer[0])) + break; + + if (!viewPortHandler.isInBoundsLeft(mPixelBuffer[0]) + || !viewPortHandler.isInBoundsY(mPixelBuffer[1])) + continue; + + mRenderPaint.setColor(dataSet.getColor(i / 2)); + renderer.renderShape( + c, dataSet, mViewPortHandler, + mPixelBuffer[0], mPixelBuffer[1], + mRenderPaint); + } + } + + @Override + public void drawValues(Canvas c) { + + // if values are drawn + if (isDrawingValuesAllowed(mChart)) { + + List<IScatterDataSet> dataSets = mChart.getScatterData().getDataSets(); + + for (int i = 0; i < mChart.getScatterData().getDataSetCount(); i++) { + + IScatterDataSet dataSet = dataSets.get(i); + + if (!shouldDrawValues(dataSet) || dataSet.getEntryCount() < 1) + continue; + + // apply the text-styling defined by the DataSet + applyValueTextStyle(dataSet); + + mXBounds.set(mChart, dataSet); + + float[] positions = mChart.getTransformer(dataSet.getAxisDependency()) + .generateTransformedValuesScatter(dataSet, + mAnimator.getPhaseX(), mAnimator.getPhaseY(), mXBounds.min, mXBounds.max); + + float shapeSize = Utils.convertDpToPixel(dataSet.getScatterShapeSize()); + + MPPointF iconsOffset = MPPointF.getInstance(dataSet.getIconsOffset()); + iconsOffset.x = Utils.convertDpToPixel(iconsOffset.x); + iconsOffset.y = Utils.convertDpToPixel(iconsOffset.y); + + for (int j = 0; j < positions.length; j += 2) { + + if (!mViewPortHandler.isInBoundsRight(positions[j])) + break; + + // make sure the lines don't do shitty things outside bounds + if ((!mViewPortHandler.isInBoundsLeft(positions[j]) + || !mViewPortHandler.isInBoundsY(positions[j + 1]))) + continue; + + Entry entry = dataSet.getEntryForIndex(j / 2 + mXBounds.min); + + if (dataSet.isDrawValuesEnabled()) { + drawValue(c, + dataSet.getValueFormatter(), + entry.getY(), + entry, + i, + positions[j], + positions[j + 1] - shapeSize, + dataSet.getValueTextColor(j / 2 + mXBounds.min)); + } + + if (entry.getIcon() != null && dataSet.isDrawIconsEnabled()) { + + Drawable icon = entry.getIcon(); + + Utils.drawImage( + c, + icon, + (int)(positions[j] + iconsOffset.x), + (int)(positions[j + 1] + iconsOffset.y), + icon.getIntrinsicWidth(), + icon.getIntrinsicHeight()); + } + } + + MPPointF.recycleInstance(iconsOffset); + } + } + } + + @Override + public void drawExtras(Canvas c) { + } + + @Override + public void drawHighlighted(Canvas c, Highlight[] indices) { + + ScatterData scatterData = mChart.getScatterData(); + + for (Highlight high : indices) { + + IScatterDataSet set = scatterData.getDataSetByIndex(high.getDataSetIndex()); + + if (set == null || !set.isHighlightEnabled()) + continue; + + final Entry e = set.getEntryForXValue(high.getX(), high.getY()); + + if (!isInBoundsX(e, set)) + continue; + + MPPointD pix = mChart.getTransformer(set.getAxisDependency()).getPixelForValues(e.getX(), e.getY() * mAnimator + .getPhaseY()); + + high.setDraw((float) pix.x, (float) pix.y); + + // draw the lines + drawHighlightLines(c, (float) pix.x, (float) pix.y, set); + } + } +} diff --git a/MPChartLib/src/main/java/com/github/mikephil/charting/renderer/XAxisRenderer.java b/MPChartLib/src/main/java/com/github/mikephil/charting/renderer/XAxisRenderer.java new file mode 100644 index 00000000..8adb56c7 --- /dev/null +++ b/MPChartLib/src/main/java/com/github/mikephil/charting/renderer/XAxisRenderer.java @@ -0,0 +1,401 @@ + +package com.github.mikephil.charting.renderer; + +import android.graphics.Canvas; +import android.graphics.Color; +import android.graphics.Paint; +import android.graphics.Paint.Align; +import android.graphics.Path; +import android.graphics.RectF; + +import com.github.mikephil.charting.components.LimitLine; +import com.github.mikephil.charting.components.XAxis; +import com.github.mikephil.charting.components.XAxis.XAxisPosition; +import com.github.mikephil.charting.utils.FSize; +import com.github.mikephil.charting.utils.MPPointD; +import com.github.mikephil.charting.utils.MPPointF; +import com.github.mikephil.charting.utils.Transformer; +import com.github.mikephil.charting.utils.Utils; +import com.github.mikephil.charting.utils.ViewPortHandler; + +import java.util.List; + +public class XAxisRenderer extends AxisRenderer { + + protected XAxis mXAxis; + + public XAxisRenderer(ViewPortHandler viewPortHandler, XAxis xAxis, Transformer trans) { + super(viewPortHandler, trans, xAxis); + + this.mXAxis = xAxis; + + mAxisLabelPaint.setColor(Color.BLACK); + mAxisLabelPaint.setTextAlign(Align.CENTER); + mAxisLabelPaint.setTextSize(Utils.convertDpToPixel(10f)); + } + + protected void setupGridPaint() { + mGridPaint.setColor(mXAxis.getGridColor()); + mGridPaint.setStrokeWidth(mXAxis.getGridLineWidth()); + mGridPaint.setPathEffect(mXAxis.getGridDashPathEffect()); + } + + @Override + public void computeAxis(float min, float max, boolean inverted) { + + // calculate the starting and entry point of the y-labels (depending on + // zoom / contentrect bounds) + if (mViewPortHandler.contentWidth() > 10 && !mViewPortHandler.isFullyZoomedOutX()) { + + MPPointD p1 = mTrans.getValuesByTouchPoint(mViewPortHandler.contentLeft(), mViewPortHandler.contentTop()); + MPPointD p2 = mTrans.getValuesByTouchPoint(mViewPortHandler.contentRight(), mViewPortHandler.contentTop()); + + if (inverted) { + + min = (float) p2.x; + max = (float) p1.x; + } else { + + min = (float) p1.x; + max = (float) p2.x; + } + + MPPointD.recycleInstance(p1); + MPPointD.recycleInstance(p2); + } + + computeAxisValues(min, max); + } + + @Override + protected void computeAxisValues(float min, float max) { + super.computeAxisValues(min, max); + + computeSize(); + } + + protected void computeSize() { + + String longest = mXAxis.getLongestLabel(); + + mAxisLabelPaint.setTypeface(mXAxis.getTypeface()); + mAxisLabelPaint.setTextSize(mXAxis.getTextSize()); + + final FSize labelSize = Utils.calcTextSize(mAxisLabelPaint, longest); + + final float labelWidth = labelSize.width; + final float labelHeight = Utils.calcTextHeight(mAxisLabelPaint, "Q"); + + final FSize labelRotatedSize = Utils.getSizeOfRotatedRectangleByDegrees( + labelWidth, + labelHeight, + mXAxis.getLabelRotationAngle()); + + + mXAxis.mLabelWidth = Math.round(labelWidth); + mXAxis.mLabelHeight = Math.round(labelHeight); + mXAxis.mLabelRotatedWidth = Math.round(labelRotatedSize.width); + mXAxis.mLabelRotatedHeight = Math.round(labelRotatedSize.height); + + FSize.recycleInstance(labelRotatedSize); + FSize.recycleInstance(labelSize); + } + + @Override + public void renderAxisLabels(Canvas c) { + + if (!mXAxis.isEnabled() || !mXAxis.isDrawLabelsEnabled()) + return; + + float yoffset = mXAxis.getYOffset(); + + mAxisLabelPaint.setTypeface(mXAxis.getTypeface()); + mAxisLabelPaint.setTextSize(mXAxis.getTextSize()); + mAxisLabelPaint.setColor(mXAxis.getTextColor()); + + MPPointF pointF = MPPointF.getInstance(0,0); + if (mXAxis.getPosition() == XAxisPosition.TOP) { + pointF.x = 0.5f; + pointF.y = 1.0f; + drawLabels(c, mViewPortHandler.contentTop() - yoffset, pointF); + + } else if (mXAxis.getPosition() == XAxisPosition.TOP_INSIDE) { + pointF.x = 0.5f; + pointF.y = 1.0f; + drawLabels(c, mViewPortHandler.contentTop() + yoffset + mXAxis.mLabelRotatedHeight, pointF); + + } else if (mXAxis.getPosition() == XAxisPosition.BOTTOM) { + pointF.x = 0.5f; + pointF.y = 0.0f; + drawLabels(c, mViewPortHandler.contentBottom() + yoffset, pointF); + + } else if (mXAxis.getPosition() == XAxisPosition.BOTTOM_INSIDE) { + pointF.x = 0.5f; + pointF.y = 0.0f; + drawLabels(c, mViewPortHandler.contentBottom() - yoffset - mXAxis.mLabelRotatedHeight, pointF); + + } else { // BOTH SIDED + pointF.x = 0.5f; + pointF.y = 1.0f; + drawLabels(c, mViewPortHandler.contentTop() - yoffset, pointF); + pointF.x = 0.5f; + pointF.y = 0.0f; + drawLabels(c, mViewPortHandler.contentBottom() + yoffset, pointF); + } + MPPointF.recycleInstance(pointF); + } + + @Override + public void renderAxisLine(Canvas c) { + + if (!mXAxis.isDrawAxisLineEnabled() || !mXAxis.isEnabled()) + return; + + mAxisLinePaint.setColor(mXAxis.getAxisLineColor()); + mAxisLinePaint.setStrokeWidth(mXAxis.getAxisLineWidth()); + mAxisLinePaint.setPathEffect(mXAxis.getAxisLineDashPathEffect()); + + if (mXAxis.getPosition() == XAxisPosition.TOP + || mXAxis.getPosition() == XAxisPosition.TOP_INSIDE + || mXAxis.getPosition() == XAxisPosition.BOTH_SIDED) { + c.drawLine(mViewPortHandler.contentLeft(), + mViewPortHandler.contentTop(), mViewPortHandler.contentRight(), + mViewPortHandler.contentTop(), mAxisLinePaint); + } + + if (mXAxis.getPosition() == XAxisPosition.BOTTOM + || mXAxis.getPosition() == XAxisPosition.BOTTOM_INSIDE + || mXAxis.getPosition() == XAxisPosition.BOTH_SIDED) { + c.drawLine(mViewPortHandler.contentLeft(), + mViewPortHandler.contentBottom(), mViewPortHandler.contentRight(), + mViewPortHandler.contentBottom(), mAxisLinePaint); + } + } + + /** + * draws the x-labels on the specified y-position + * + * @param pos + */ + protected void drawLabels(Canvas c, float pos, MPPointF anchor) { + + final float labelRotationAngleDegrees = mXAxis.getLabelRotationAngle(); + boolean centeringEnabled = mXAxis.isCenterAxisLabelsEnabled(); + + float[] positions = new float[mXAxis.mEntryCount * 2]; + + for (int i = 0; i < positions.length; i += 2) { + + // only fill x values + if (centeringEnabled) { + positions[i] = mXAxis.mCenteredEntries[i / 2]; + } else { + positions[i] = mXAxis.mEntries[i / 2]; + } + } + + mTrans.pointValuesToPixel(positions); + + for (int i = 0; i < positions.length; i += 2) { + + float x = positions[i]; + + if (mViewPortHandler.isInBoundsX(x)) { + + String label = mXAxis.getValueFormatter().getFormattedValue(mXAxis.mEntries[i / 2], mXAxis); + + if (mXAxis.isAvoidFirstLastClippingEnabled()) { + + // avoid clipping of the last + if (i / 2 == mXAxis.mEntryCount - 1 && mXAxis.mEntryCount > 1) { + float width = Utils.calcTextWidth(mAxisLabelPaint, label); + + if (width > mViewPortHandler.offsetRight() * 2 + && x + width > mViewPortHandler.getChartWidth()) + x -= width / 2; + + // avoid clipping of the first + } else if (i == 0) { + + float width = Utils.calcTextWidth(mAxisLabelPaint, label); + x += width / 2; + } + } + + drawLabel(c, label, x, pos, anchor, labelRotationAngleDegrees); + } + } + } + + protected void drawLabel(Canvas c, String formattedLabel, float x, float y, MPPointF anchor, float angleDegrees) { + Utils.drawXAxisValue(c, formattedLabel, x, y, mAxisLabelPaint, anchor, angleDegrees); + } + protected Path mRenderGridLinesPath = new Path(); + protected float[] mRenderGridLinesBuffer = new float[2]; + @Override + public void renderGridLines(Canvas c) { + + if (!mXAxis.isDrawGridLinesEnabled() || !mXAxis.isEnabled()) + return; + + int clipRestoreCount = c.save(); + c.clipRect(getGridClippingRect()); + + if(mRenderGridLinesBuffer.length != mAxis.mEntryCount * 2){ + mRenderGridLinesBuffer = new float[mXAxis.mEntryCount * 2]; + } + float[] positions = mRenderGridLinesBuffer; + + for (int i = 0; i < positions.length; i += 2) { + positions[i] = mXAxis.mEntries[i / 2]; + positions[i + 1] = mXAxis.mEntries[i / 2]; + } + + mTrans.pointValuesToPixel(positions); + + setupGridPaint(); + + Path gridLinePath = mRenderGridLinesPath; + gridLinePath.reset(); + + for (int i = 0; i < positions.length; i += 2) { + + drawGridLine(c, positions[i], positions[i + 1], gridLinePath); + } + + c.restoreToCount(clipRestoreCount); + } + + protected RectF mGridClippingRect = new RectF(); + + public RectF getGridClippingRect() { + mGridClippingRect.set(mViewPortHandler.getContentRect()); + mGridClippingRect.inset(-mAxis.getGridLineWidth(), 0.f); + return mGridClippingRect; + } + + /** + * Draws the grid line at the specified position using the provided path. + * + * @param c + * @param x + * @param y + * @param gridLinePath + */ + protected void drawGridLine(Canvas c, float x, float y, Path gridLinePath) { + + gridLinePath.moveTo(x, mViewPortHandler.contentBottom()); + gridLinePath.lineTo(x, mViewPortHandler.contentTop()); + + // draw a path because lines don't support dashing on lower android versions + c.drawPath(gridLinePath, mGridPaint); + + gridLinePath.reset(); + } + + protected float[] mRenderLimitLinesBuffer = new float[2]; + protected RectF mLimitLineClippingRect = new RectF(); + + /** + * Draws the LimitLines associated with this axis to the screen. + * + * @param c + */ + @Override + public void renderLimitLines(Canvas c) { + + List<LimitLine> limitLines = mXAxis.getLimitLines(); + + if (limitLines == null || limitLines.size() <= 0) + return; + + float[] position = mRenderLimitLinesBuffer; + position[0] = 0; + position[1] = 0; + + for (int i = 0; i < limitLines.size(); i++) { + + LimitLine l = limitLines.get(i); + + if (!l.isEnabled()) + continue; + + int clipRestoreCount = c.save(); + mLimitLineClippingRect.set(mViewPortHandler.getContentRect()); + mLimitLineClippingRect.inset(-l.getLineWidth(), 0.f); + c.clipRect(mLimitLineClippingRect); + + position[0] = l.getLimit(); + position[1] = 0.f; + + mTrans.pointValuesToPixel(position); + + renderLimitLineLine(c, l, position); + renderLimitLineLabel(c, l, position, 2.f + l.getYOffset()); + + c.restoreToCount(clipRestoreCount); + } + } + + float[] mLimitLineSegmentsBuffer = new float[4]; + private Path mLimitLinePath = new Path(); + + public void renderLimitLineLine(Canvas c, LimitLine limitLine, float[] position) { + mLimitLineSegmentsBuffer[0] = position[0]; + mLimitLineSegmentsBuffer[1] = mViewPortHandler.contentTop(); + mLimitLineSegmentsBuffer[2] = position[0]; + mLimitLineSegmentsBuffer[3] = mViewPortHandler.contentBottom(); + + mLimitLinePath.reset(); + mLimitLinePath.moveTo(mLimitLineSegmentsBuffer[0], mLimitLineSegmentsBuffer[1]); + mLimitLinePath.lineTo(mLimitLineSegmentsBuffer[2], mLimitLineSegmentsBuffer[3]); + + mLimitLinePaint.setStyle(Paint.Style.STROKE); + mLimitLinePaint.setColor(limitLine.getLineColor()); + mLimitLinePaint.setStrokeWidth(limitLine.getLineWidth()); + mLimitLinePaint.setPathEffect(limitLine.getDashPathEffect()); + + c.drawPath(mLimitLinePath, mLimitLinePaint); + } + + public void renderLimitLineLabel(Canvas c, LimitLine limitLine, float[] position, float yOffset) { + String label = limitLine.getLabel(); + + // if drawing the limit-value label is enabled + if (label != null && !label.equals("")) { + + mLimitLinePaint.setStyle(limitLine.getTextStyle()); + mLimitLinePaint.setPathEffect(null); + mLimitLinePaint.setColor(limitLine.getTextColor()); + mLimitLinePaint.setStrokeWidth(0.5f); + mLimitLinePaint.setTextSize(limitLine.getTextSize()); + + + float xOffset = limitLine.getLineWidth() + limitLine.getXOffset(); + + final LimitLine.LimitLabelPosition labelPosition = limitLine.getLabelPosition(); + + if (labelPosition == LimitLine.LimitLabelPosition.RIGHT_TOP) { + + final float labelLineHeight = Utils.calcTextHeight(mLimitLinePaint, label); + mLimitLinePaint.setTextAlign(Align.LEFT); + c.drawText(label, position[0] + xOffset, mViewPortHandler.contentTop() + yOffset + labelLineHeight, + mLimitLinePaint); + } else if (labelPosition == LimitLine.LimitLabelPosition.RIGHT_BOTTOM) { + + mLimitLinePaint.setTextAlign(Align.LEFT); + c.drawText(label, position[0] + xOffset, mViewPortHandler.contentBottom() - yOffset, mLimitLinePaint); + } else if (labelPosition == LimitLine.LimitLabelPosition.LEFT_TOP) { + + mLimitLinePaint.setTextAlign(Align.RIGHT); + final float labelLineHeight = Utils.calcTextHeight(mLimitLinePaint, label); + c.drawText(label, position[0] - xOffset, mViewPortHandler.contentTop() + yOffset + labelLineHeight, + mLimitLinePaint); + } else { + + mLimitLinePaint.setTextAlign(Align.RIGHT); + c.drawText(label, position[0] - xOffset, mViewPortHandler.contentBottom() - yOffset, mLimitLinePaint); + } + } + } +} diff --git a/MPChartLib/src/main/java/com/github/mikephil/charting/renderer/XAxisRendererHorizontalBarChart.java b/MPChartLib/src/main/java/com/github/mikephil/charting/renderer/XAxisRendererHorizontalBarChart.java new file mode 100644 index 00000000..86047cf1 --- /dev/null +++ b/MPChartLib/src/main/java/com/github/mikephil/charting/renderer/XAxisRendererHorizontalBarChart.java @@ -0,0 +1,310 @@ + +package com.github.mikephil.charting.renderer; + +import android.graphics.Canvas; +import android.graphics.Paint; +import android.graphics.Paint.Align; +import android.graphics.Path; +import android.graphics.RectF; + +import com.github.mikephil.charting.charts.BarChart; +import com.github.mikephil.charting.components.LimitLine; +import com.github.mikephil.charting.components.XAxis; +import com.github.mikephil.charting.components.XAxis.XAxisPosition; +import com.github.mikephil.charting.utils.FSize; +import com.github.mikephil.charting.utils.MPPointF; +import com.github.mikephil.charting.utils.MPPointD; +import com.github.mikephil.charting.utils.Transformer; +import com.github.mikephil.charting.utils.Utils; +import com.github.mikephil.charting.utils.ViewPortHandler; + +import java.util.List; + +public class XAxisRendererHorizontalBarChart extends XAxisRenderer { + + protected BarChart mChart; + + public XAxisRendererHorizontalBarChart(ViewPortHandler viewPortHandler, XAxis xAxis, + Transformer trans, BarChart chart) { + super(viewPortHandler, xAxis, trans); + + this.mChart = chart; + } + + @Override + public void computeAxis(float min, float max, boolean inverted) { + + // calculate the starting and entry point of the y-labels (depending on + // zoom / contentrect bounds) + if (mViewPortHandler.contentWidth() > 10 && !mViewPortHandler.isFullyZoomedOutY()) { + + MPPointD p1 = mTrans.getValuesByTouchPoint(mViewPortHandler.contentLeft(), mViewPortHandler.contentBottom()); + MPPointD p2 = mTrans.getValuesByTouchPoint(mViewPortHandler.contentLeft(), mViewPortHandler.contentTop()); + + if (inverted) { + + min = (float) p2.y; + max = (float) p1.y; + } else { + + min = (float) p1.y; + max = (float) p2.y; + } + + MPPointD.recycleInstance(p1); + MPPointD.recycleInstance(p2); + } + + computeAxisValues(min, max); + } + + @Override + protected void computeSize() { + + mAxisLabelPaint.setTypeface(mXAxis.getTypeface()); + mAxisLabelPaint.setTextSize(mXAxis.getTextSize()); + + String longest = mXAxis.getLongestLabel(); + + final FSize labelSize = Utils.calcTextSize(mAxisLabelPaint, longest); + + final float labelWidth = (int)(labelSize.width + mXAxis.getXOffset() * 3.5f); + final float labelHeight = labelSize.height; + + final FSize labelRotatedSize = Utils.getSizeOfRotatedRectangleByDegrees( + labelSize.width, + labelHeight, + mXAxis.getLabelRotationAngle()); + + mXAxis.mLabelWidth = Math.round(labelWidth); + mXAxis.mLabelHeight = Math.round(labelHeight); + mXAxis.mLabelRotatedWidth = (int)(labelRotatedSize.width + mXAxis.getXOffset() * 3.5f); + mXAxis.mLabelRotatedHeight = Math.round(labelRotatedSize.height); + + FSize.recycleInstance(labelRotatedSize); + } + + @Override + public void renderAxisLabels(Canvas c) { + + if (!mXAxis.isEnabled() || !mXAxis.isDrawLabelsEnabled()) + return; + + float xoffset = mXAxis.getXOffset(); + + mAxisLabelPaint.setTypeface(mXAxis.getTypeface()); + mAxisLabelPaint.setTextSize(mXAxis.getTextSize()); + mAxisLabelPaint.setColor(mXAxis.getTextColor()); + + MPPointF pointF = MPPointF.getInstance(0,0); + + if (mXAxis.getPosition() == XAxisPosition.TOP) { + pointF.x = 0.0f; + pointF.y = 0.5f; + drawLabels(c, mViewPortHandler.contentRight() + xoffset, pointF); + + } else if (mXAxis.getPosition() == XAxisPosition.TOP_INSIDE) { + pointF.x = 1.0f; + pointF.y = 0.5f; + drawLabels(c, mViewPortHandler.contentRight() - xoffset, pointF); + + } else if (mXAxis.getPosition() == XAxisPosition.BOTTOM) { + pointF.x = 1.0f; + pointF.y = 0.5f; + drawLabels(c, mViewPortHandler.contentLeft() - xoffset, pointF); + + } else if (mXAxis.getPosition() == XAxisPosition.BOTTOM_INSIDE) { + pointF.x = 1.0f; + pointF.y = 0.5f; + drawLabels(c, mViewPortHandler.contentLeft() + xoffset, pointF); + + } else { // BOTH SIDED + pointF.x = 0.0f; + pointF.y = 0.5f; + drawLabels(c, mViewPortHandler.contentRight() + xoffset, pointF); + pointF.x = 1.0f; + pointF.y = 0.5f; + drawLabels(c, mViewPortHandler.contentLeft() - xoffset, pointF); + } + + MPPointF.recycleInstance(pointF); + } + + @Override + protected void drawLabels(Canvas c, float pos, MPPointF anchor) { + + final float labelRotationAngleDegrees = mXAxis.getLabelRotationAngle(); + boolean centeringEnabled = mXAxis.isCenterAxisLabelsEnabled(); + + float[] positions = new float[mXAxis.mEntryCount * 2]; + + for (int i = 0; i < positions.length; i += 2) { + + // only fill x values + if (centeringEnabled) { + positions[i + 1] = mXAxis.mCenteredEntries[i / 2]; + } else { + positions[i + 1] = mXAxis.mEntries[i / 2]; + } + } + + mTrans.pointValuesToPixel(positions); + + for (int i = 0; i < positions.length; i += 2) { + + float y = positions[i + 1]; + + if (mViewPortHandler.isInBoundsY(y)) { + + String label = mXAxis.getValueFormatter().getFormattedValue(mXAxis.mEntries[i / 2], mXAxis); + drawLabel(c, label, pos, y, anchor, labelRotationAngleDegrees); + } + } + } + + @Override + public RectF getGridClippingRect() { + mGridClippingRect.set(mViewPortHandler.getContentRect()); + mGridClippingRect.inset(0.f, -mAxis.getGridLineWidth()); + return mGridClippingRect; + } + + @Override + protected void drawGridLine(Canvas c, float x, float y, Path gridLinePath) { + + gridLinePath.moveTo(mViewPortHandler.contentRight(), y); + gridLinePath.lineTo(mViewPortHandler.contentLeft(), y); + + // draw a path because lines don't support dashing on lower android versions + c.drawPath(gridLinePath, mGridPaint); + + gridLinePath.reset(); + } + + @Override + public void renderAxisLine(Canvas c) { + + if (!mXAxis.isDrawAxisLineEnabled() || !mXAxis.isEnabled()) + return; + + mAxisLinePaint.setColor(mXAxis.getAxisLineColor()); + mAxisLinePaint.setStrokeWidth(mXAxis.getAxisLineWidth()); + + if (mXAxis.getPosition() == XAxisPosition.TOP + || mXAxis.getPosition() == XAxisPosition.TOP_INSIDE + || mXAxis.getPosition() == XAxisPosition.BOTH_SIDED) { + c.drawLine(mViewPortHandler.contentRight(), + mViewPortHandler.contentTop(), mViewPortHandler.contentRight(), + mViewPortHandler.contentBottom(), mAxisLinePaint); + } + + if (mXAxis.getPosition() == XAxisPosition.BOTTOM + || mXAxis.getPosition() == XAxisPosition.BOTTOM_INSIDE + || mXAxis.getPosition() == XAxisPosition.BOTH_SIDED) { + c.drawLine(mViewPortHandler.contentLeft(), + mViewPortHandler.contentTop(), mViewPortHandler.contentLeft(), + mViewPortHandler.contentBottom(), mAxisLinePaint); + } + } + + protected Path mRenderLimitLinesPathBuffer = new Path(); + /** + * Draws the LimitLines associated with this axis to the screen. + * This is the standard YAxis renderer using the XAxis limit lines. + * + * @param c + */ + @Override + public void renderLimitLines(Canvas c) { + + List<LimitLine> limitLines = mXAxis.getLimitLines(); + + if (limitLines == null || limitLines.size() <= 0) + return; + + float[] pts = mRenderLimitLinesBuffer; + pts[0] = 0; + pts[1] = 0; + + Path limitLinePath = mRenderLimitLinesPathBuffer; + limitLinePath.reset(); + + for (int i = 0; i < limitLines.size(); i++) { + + LimitLine l = limitLines.get(i); + + if(!l.isEnabled()) + continue; + + int clipRestoreCount = c.save(); + mLimitLineClippingRect.set(mViewPortHandler.getContentRect()); + mLimitLineClippingRect.inset(0.f, -l.getLineWidth()); + c.clipRect(mLimitLineClippingRect); + + mLimitLinePaint.setStyle(Paint.Style.STROKE); + mLimitLinePaint.setColor(l.getLineColor()); + mLimitLinePaint.setStrokeWidth(l.getLineWidth()); + mLimitLinePaint.setPathEffect(l.getDashPathEffect()); + + pts[1] = l.getLimit(); + + mTrans.pointValuesToPixel(pts); + + limitLinePath.moveTo(mViewPortHandler.contentLeft(), pts[1]); + limitLinePath.lineTo(mViewPortHandler.contentRight(), pts[1]); + + c.drawPath(limitLinePath, mLimitLinePaint); + limitLinePath.reset(); + // c.drawLines(pts, mLimitLinePaint); + + String label = l.getLabel(); + + // if drawing the limit-value label is enabled + if (label != null && !label.equals("")) { + + mLimitLinePaint.setStyle(l.getTextStyle()); + mLimitLinePaint.setPathEffect(null); + mLimitLinePaint.setColor(l.getTextColor()); + mLimitLinePaint.setStrokeWidth(0.5f); + mLimitLinePaint.setTextSize(l.getTextSize()); + + final float labelLineHeight = Utils.calcTextHeight(mLimitLinePaint, label); + float xOffset = Utils.convertDpToPixel(4f) + l.getXOffset(); + float yOffset = l.getLineWidth() + labelLineHeight + l.getYOffset(); + + final LimitLine.LimitLabelPosition position = l.getLabelPosition(); + + if (position == LimitLine.LimitLabelPosition.RIGHT_TOP) { + + mLimitLinePaint.setTextAlign(Align.RIGHT); + c.drawText(label, + mViewPortHandler.contentRight() - xOffset, + pts[1] - yOffset + labelLineHeight, mLimitLinePaint); + + } else if (position == LimitLine.LimitLabelPosition.RIGHT_BOTTOM) { + + mLimitLinePaint.setTextAlign(Align.RIGHT); + c.drawText(label, + mViewPortHandler.contentRight() - xOffset, + pts[1] + yOffset, mLimitLinePaint); + + } else if (position == LimitLine.LimitLabelPosition.LEFT_TOP) { + + mLimitLinePaint.setTextAlign(Align.LEFT); + c.drawText(label, + mViewPortHandler.contentLeft() + xOffset, + pts[1] - yOffset + labelLineHeight, mLimitLinePaint); + + } else { + + mLimitLinePaint.setTextAlign(Align.LEFT); + c.drawText(label, + mViewPortHandler.offsetLeft() + xOffset, + pts[1] + yOffset, mLimitLinePaint); + } + } + + c.restoreToCount(clipRestoreCount); + } + } +} diff --git a/MPChartLib/src/main/java/com/github/mikephil/charting/renderer/XAxisRendererRadarChart.java b/MPChartLib/src/main/java/com/github/mikephil/charting/renderer/XAxisRendererRadarChart.java new file mode 100644 index 00000000..956e8c7d --- /dev/null +++ b/MPChartLib/src/main/java/com/github/mikephil/charting/renderer/XAxisRendererRadarChart.java @@ -0,0 +1,71 @@ + +package com.github.mikephil.charting.renderer; + +import android.graphics.Canvas; +import android.graphics.PointF; + +import com.github.mikephil.charting.charts.RadarChart; +import com.github.mikephil.charting.components.XAxis; +import com.github.mikephil.charting.utils.MPPointF; +import com.github.mikephil.charting.utils.Utils; +import com.github.mikephil.charting.utils.ViewPortHandler; + +public class XAxisRendererRadarChart extends XAxisRenderer { + + private RadarChart mChart; + + public XAxisRendererRadarChart(ViewPortHandler viewPortHandler, XAxis xAxis, RadarChart chart) { + super(viewPortHandler, xAxis, null); + + mChart = chart; + } + + @Override + public void renderAxisLabels(Canvas c) { + + if (!mXAxis.isEnabled() || !mXAxis.isDrawLabelsEnabled()) + return; + + final float labelRotationAngleDegrees = mXAxis.getLabelRotationAngle(); + final MPPointF drawLabelAnchor = MPPointF.getInstance(0.5f, 0.25f); + + mAxisLabelPaint.setTypeface(mXAxis.getTypeface()); + mAxisLabelPaint.setTextSize(mXAxis.getTextSize()); + mAxisLabelPaint.setColor(mXAxis.getTextColor()); + + float sliceangle = mChart.getSliceAngle(); + + // calculate the factor that is needed for transforming the value to + // pixels + float factor = mChart.getFactor(); + + MPPointF center = mChart.getCenterOffsets(); + MPPointF pOut = MPPointF.getInstance(0,0); + for (int i = 0; i < mChart.getData().getMaxEntryCountSet().getEntryCount(); i++) { + + String label = mXAxis.getValueFormatter().getFormattedValue(i, mXAxis); + + float angle = (sliceangle * i + mChart.getRotationAngle()) % 360f; + + Utils.getPosition(center, mChart.getYRange() * factor + + mXAxis.mLabelRotatedWidth / 2f, angle, pOut); + + drawLabel(c, label, pOut.x, pOut.y - mXAxis.mLabelRotatedHeight / 2.f, + drawLabelAnchor, labelRotationAngleDegrees); + } + + MPPointF.recycleInstance(center); + MPPointF.recycleInstance(pOut); + MPPointF.recycleInstance(drawLabelAnchor); + } + + /** + * XAxis LimitLines on RadarChart not yet supported. + * + * @param c + */ + @Override + public void renderLimitLines(Canvas c) { + // this space intentionally left blank + } +} diff --git a/MPChartLib/src/main/java/com/github/mikephil/charting/renderer/YAxisRenderer.java b/MPChartLib/src/main/java/com/github/mikephil/charting/renderer/YAxisRenderer.java new file mode 100644 index 00000000..53cca7ee --- /dev/null +++ b/MPChartLib/src/main/java/com/github/mikephil/charting/renderer/YAxisRenderer.java @@ -0,0 +1,352 @@ +package com.github.mikephil.charting.renderer; + +import android.graphics.Canvas; +import android.graphics.Color; +import android.graphics.Paint; +import android.graphics.Paint.Align; +import android.graphics.Path; +import android.graphics.RectF; + +import com.github.mikephil.charting.components.LimitLine; +import com.github.mikephil.charting.components.YAxis; +import com.github.mikephil.charting.components.YAxis.AxisDependency; +import com.github.mikephil.charting.components.YAxis.YAxisLabelPosition; +import com.github.mikephil.charting.utils.MPPointD; +import com.github.mikephil.charting.utils.Transformer; +import com.github.mikephil.charting.utils.Utils; +import com.github.mikephil.charting.utils.ViewPortHandler; + +import java.util.List; + +public class YAxisRenderer extends AxisRenderer { + + protected YAxis mYAxis; + + protected Paint mZeroLinePaint; + + public YAxisRenderer(ViewPortHandler viewPortHandler, YAxis yAxis, Transformer trans) { + super(viewPortHandler, trans, yAxis); + + this.mYAxis = yAxis; + + if(mViewPortHandler != null) { + + mAxisLabelPaint.setColor(Color.BLACK); + mAxisLabelPaint.setTextSize(Utils.convertDpToPixel(10f)); + + mZeroLinePaint = new Paint(Paint.ANTI_ALIAS_FLAG); + mZeroLinePaint.setColor(Color.GRAY); + mZeroLinePaint.setStrokeWidth(1f); + mZeroLinePaint.setStyle(Paint.Style.STROKE); + } + } + + /** + * draws the y-axis labels to the screen + */ + @Override + public void renderAxisLabels(Canvas c) { + + if (!mYAxis.isEnabled() || !mYAxis.isDrawLabelsEnabled()) + return; + + float[] positions = getTransformedPositions(); + + mAxisLabelPaint.setTypeface(mYAxis.getTypeface()); + mAxisLabelPaint.setTextSize(mYAxis.getTextSize()); + mAxisLabelPaint.setColor(mYAxis.getTextColor()); + + float xoffset = mYAxis.getXOffset(); + float yoffset = Utils.calcTextHeight(mAxisLabelPaint, "A") / 2.5f + mYAxis.getYOffset(); + + AxisDependency dependency = mYAxis.getAxisDependency(); + YAxisLabelPosition labelPosition = mYAxis.getLabelPosition(); + + float xPos = 0f; + + if (dependency == AxisDependency.LEFT) { + + if (labelPosition == YAxisLabelPosition.OUTSIDE_CHART) { + mAxisLabelPaint.setTextAlign(Align.RIGHT); + xPos = mViewPortHandler.offsetLeft() - xoffset; + } else { + mAxisLabelPaint.setTextAlign(Align.LEFT); + xPos = mViewPortHandler.offsetLeft() + xoffset; + } + + } else { + + if (labelPosition == YAxisLabelPosition.OUTSIDE_CHART) { + mAxisLabelPaint.setTextAlign(Align.LEFT); + xPos = mViewPortHandler.contentRight() + xoffset; + } else { + mAxisLabelPaint.setTextAlign(Align.RIGHT); + xPos = mViewPortHandler.contentRight() - xoffset; + } + } + + drawYLabels(c, xPos, positions, yoffset); + } + + @Override + public void renderAxisLine(Canvas c) { + + if (!mYAxis.isEnabled() || !mYAxis.isDrawAxisLineEnabled()) + return; + + mAxisLinePaint.setColor(mYAxis.getAxisLineColor()); + mAxisLinePaint.setStrokeWidth(mYAxis.getAxisLineWidth()); + + if (mYAxis.getAxisDependency() == AxisDependency.LEFT) { + c.drawLine(mViewPortHandler.contentLeft(), mViewPortHandler.contentTop(), mViewPortHandler.contentLeft(), + mViewPortHandler.contentBottom(), mAxisLinePaint); + } else { + c.drawLine(mViewPortHandler.contentRight(), mViewPortHandler.contentTop(), mViewPortHandler.contentRight(), + mViewPortHandler.contentBottom(), mAxisLinePaint); + } + } + + /** + * draws the y-labels on the specified x-position + * + * @param fixedPosition + * @param positions + */ + protected void drawYLabels(Canvas c, float fixedPosition, float[] positions, float offset) { + + final int from = mYAxis.isDrawBottomYLabelEntryEnabled() ? 0 : 1; + final int to = mYAxis.isDrawTopYLabelEntryEnabled() + ? mYAxis.mEntryCount + : (mYAxis.mEntryCount - 1); + + float xOffset = mYAxis.getLabelXOffset(); + + // draw + for (int i = from; i < to; i++) { + + String text = mYAxis.getFormattedLabel(i); + + c.drawText(text, + fixedPosition + xOffset, + positions[i * 2 + 1] + offset, + mAxisLabelPaint); + } + } + + protected Path mRenderGridLinesPath = new Path(); + @Override + public void renderGridLines(Canvas c) { + + if (!mYAxis.isEnabled()) + return; + + if (mYAxis.isDrawGridLinesEnabled()) { + + int clipRestoreCount = c.save(); + c.clipRect(getGridClippingRect()); + + float[] positions = getTransformedPositions(); + + mGridPaint.setColor(mYAxis.getGridColor()); + mGridPaint.setStrokeWidth(mYAxis.getGridLineWidth()); + mGridPaint.setPathEffect(mYAxis.getGridDashPathEffect()); + + Path gridLinePath = mRenderGridLinesPath; + gridLinePath.reset(); + + // draw the grid + for (int i = 0; i < positions.length; i += 2) { + + // draw a path because lines don't support dashing on lower android versions + c.drawPath(linePath(gridLinePath, i, positions), mGridPaint); + gridLinePath.reset(); + } + + c.restoreToCount(clipRestoreCount); + } + + if (mYAxis.isDrawZeroLineEnabled()) { + drawZeroLine(c); + } + } + + protected RectF mGridClippingRect = new RectF(); + + public RectF getGridClippingRect() { + mGridClippingRect.set(mViewPortHandler.getContentRect()); + mGridClippingRect.inset(0.f, -mAxis.getGridLineWidth()); + return mGridClippingRect; + } + + /** + * Calculates the path for a grid line. + * + * @param p + * @param i + * @param positions + * @return + */ + protected Path linePath(Path p, int i, float[] positions) { + + p.moveTo(mViewPortHandler.offsetLeft(), positions[i + 1]); + p.lineTo(mViewPortHandler.contentRight(), positions[i + 1]); + + return p; + } + + protected float[] mGetTransformedPositionsBuffer = new float[2]; + /** + * Transforms the values contained in the axis entries to screen pixels and returns them in form of a float array + * of x- and y-coordinates. + * + * @return + */ + protected float[] getTransformedPositions() { + + if(mGetTransformedPositionsBuffer.length != mYAxis.mEntryCount * 2){ + mGetTransformedPositionsBuffer = new float[mYAxis.mEntryCount * 2]; + } + float[] positions = mGetTransformedPositionsBuffer; + + for (int i = 0; i < positions.length; i += 2) { + // only fill y values, x values are not needed for y-labels + positions[i + 1] = mYAxis.mEntries[i / 2]; + } + + mTrans.pointValuesToPixel(positions); + return positions; + } + + protected Path mDrawZeroLinePath = new Path(); + protected RectF mZeroLineClippingRect = new RectF(); + + /** + * Draws the zero line. + */ + protected void drawZeroLine(Canvas c) { + + int clipRestoreCount = c.save(); + mZeroLineClippingRect.set(mViewPortHandler.getContentRect()); + mZeroLineClippingRect.inset(0.f, -mYAxis.getZeroLineWidth()); + c.clipRect(mZeroLineClippingRect); + + // draw zero line + MPPointD pos = mTrans.getPixelForValues(0f, 0f); + + mZeroLinePaint.setColor(mYAxis.getZeroLineColor()); + mZeroLinePaint.setStrokeWidth(mYAxis.getZeroLineWidth()); + + Path zeroLinePath = mDrawZeroLinePath; + zeroLinePath.reset(); + + zeroLinePath.moveTo(mViewPortHandler.contentLeft(), (float) pos.y); + zeroLinePath.lineTo(mViewPortHandler.contentRight(), (float) pos.y); + + // draw a path because lines don't support dashing on lower android versions + c.drawPath(zeroLinePath, mZeroLinePaint); + + c.restoreToCount(clipRestoreCount); + } + + protected Path mRenderLimitLines = new Path(); + protected float[] mRenderLimitLinesBuffer = new float[2]; + protected RectF mLimitLineClippingRect = new RectF(); + /** + * Draws the LimitLines associated with this axis to the screen. + * + * @param c + */ + @Override + public void renderLimitLines(Canvas c) { + + List<LimitLine> limitLines = mYAxis.getLimitLines(); + + if (limitLines == null || limitLines.size() <= 0) + return; + + float[] pts = mRenderLimitLinesBuffer; + pts[0] = 0; + pts[1] = 0; + Path limitLinePath = mRenderLimitLines; + limitLinePath.reset(); + + for (int i = 0; i < limitLines.size(); i++) { + + LimitLine l = limitLines.get(i); + + if (!l.isEnabled()) + continue; + + int clipRestoreCount = c.save(); + mLimitLineClippingRect.set(mViewPortHandler.getContentRect()); + mLimitLineClippingRect.inset(0.f, -l.getLineWidth()); + c.clipRect(mLimitLineClippingRect); + + mLimitLinePaint.setStyle(Paint.Style.STROKE); + mLimitLinePaint.setColor(l.getLineColor()); + mLimitLinePaint.setStrokeWidth(l.getLineWidth()); + mLimitLinePaint.setPathEffect(l.getDashPathEffect()); + + pts[1] = l.getLimit(); + + mTrans.pointValuesToPixel(pts); + + limitLinePath.moveTo(mViewPortHandler.contentLeft(), pts[1]); + limitLinePath.lineTo(mViewPortHandler.contentRight(), pts[1]); + + c.drawPath(limitLinePath, mLimitLinePaint); + limitLinePath.reset(); + // c.drawLines(pts, mLimitLinePaint); + + String label = l.getLabel(); + + // if drawing the limit-value label is enabled + if (label != null && !label.equals("")) { + + mLimitLinePaint.setStyle(l.getTextStyle()); + mLimitLinePaint.setPathEffect(null); + mLimitLinePaint.setColor(l.getTextColor()); + mLimitLinePaint.setTypeface(l.getTypeface()); + mLimitLinePaint.setStrokeWidth(0.5f); + mLimitLinePaint.setTextSize(l.getTextSize()); + + final float labelLineHeight = Utils.calcTextHeight(mLimitLinePaint, label); + float xOffset = Utils.convertDpToPixel(4f) + l.getXOffset(); + float yOffset = l.getLineWidth() + labelLineHeight + l.getYOffset(); + + final LimitLine.LimitLabelPosition position = l.getLabelPosition(); + + if (position == LimitLine.LimitLabelPosition.RIGHT_TOP) { + + mLimitLinePaint.setTextAlign(Align.RIGHT); + c.drawText(label, + mViewPortHandler.contentRight() - xOffset, + pts[1] - yOffset + labelLineHeight, mLimitLinePaint); + + } else if (position == LimitLine.LimitLabelPosition.RIGHT_BOTTOM) { + + mLimitLinePaint.setTextAlign(Align.RIGHT); + c.drawText(label, + mViewPortHandler.contentRight() - xOffset, + pts[1] + yOffset, mLimitLinePaint); + + } else if (position == LimitLine.LimitLabelPosition.LEFT_TOP) { + + mLimitLinePaint.setTextAlign(Align.LEFT); + c.drawText(label, + mViewPortHandler.contentLeft() + xOffset, + pts[1] - yOffset + labelLineHeight, mLimitLinePaint); + + } else { + + mLimitLinePaint.setTextAlign(Align.LEFT); + c.drawText(label, + mViewPortHandler.offsetLeft() + xOffset, + pts[1] + yOffset, mLimitLinePaint); + } + } + + c.restoreToCount(clipRestoreCount); + } + } +} diff --git a/MPChartLib/src/main/java/com/github/mikephil/charting/renderer/YAxisRendererHorizontalBarChart.java b/MPChartLib/src/main/java/com/github/mikephil/charting/renderer/YAxisRendererHorizontalBarChart.java new file mode 100644 index 00000000..fedf8054 --- /dev/null +++ b/MPChartLib/src/main/java/com/github/mikephil/charting/renderer/YAxisRendererHorizontalBarChart.java @@ -0,0 +1,315 @@ + +package com.github.mikephil.charting.renderer; + +import android.graphics.Canvas; +import android.graphics.Paint; +import android.graphics.Paint.Align; +import android.graphics.Path; +import android.graphics.RectF; + +import com.github.mikephil.charting.components.LimitLine; +import com.github.mikephil.charting.components.YAxis; +import com.github.mikephil.charting.components.YAxis.AxisDependency; +import com.github.mikephil.charting.components.YAxis.YAxisLabelPosition; +import com.github.mikephil.charting.utils.MPPointD; +import com.github.mikephil.charting.utils.Transformer; +import com.github.mikephil.charting.utils.Utils; +import com.github.mikephil.charting.utils.ViewPortHandler; + +import java.util.List; + +public class YAxisRendererHorizontalBarChart extends YAxisRenderer { + + public YAxisRendererHorizontalBarChart(ViewPortHandler viewPortHandler, YAxis yAxis, + Transformer trans) { + super(viewPortHandler, yAxis, trans); + + mLimitLinePaint.setTextAlign(Align.LEFT); + } + + /** + * Computes the axis values. + * + * @param yMin - the minimum y-value in the data object for this axis + * @param yMax - the maximum y-value in the data object for this axis + */ + @Override + public void computeAxis(float yMin, float yMax, boolean inverted) { + + // calculate the starting and entry point of the y-labels (depending on + // zoom / contentrect bounds) + if (mViewPortHandler.contentHeight() > 10 && !mViewPortHandler.isFullyZoomedOutX()) { + + MPPointD p1 = mTrans.getValuesByTouchPoint(mViewPortHandler.contentLeft(), + mViewPortHandler.contentTop()); + MPPointD p2 = mTrans.getValuesByTouchPoint(mViewPortHandler.contentRight(), + mViewPortHandler.contentTop()); + + if (!inverted) { + yMin = (float) p1.x; + yMax = (float) p2.x; + } else { + yMin = (float) p2.x; + yMax = (float) p1.x; + } + + MPPointD.recycleInstance(p1); + MPPointD.recycleInstance(p2); + } + + computeAxisValues(yMin, yMax); + } + + /** + * draws the y-axis labels to the screen + */ + @Override + public void renderAxisLabels(Canvas c) { + + if (!mYAxis.isEnabled() || !mYAxis.isDrawLabelsEnabled()) + return; + + float[] positions = getTransformedPositions(); + + mAxisLabelPaint.setTypeface(mYAxis.getTypeface()); + mAxisLabelPaint.setTextSize(mYAxis.getTextSize()); + mAxisLabelPaint.setColor(mYAxis.getTextColor()); + mAxisLabelPaint.setTextAlign(Align.CENTER); + + float baseYOffset = Utils.convertDpToPixel(2.5f); + float textHeight = Utils.calcTextHeight(mAxisLabelPaint, "Q"); + + AxisDependency dependency = mYAxis.getAxisDependency(); + YAxisLabelPosition labelPosition = mYAxis.getLabelPosition(); + + float yPos = 0f; + + if (dependency == AxisDependency.LEFT) { + + if (labelPosition == YAxisLabelPosition.OUTSIDE_CHART) { + yPos = mViewPortHandler.contentTop() - baseYOffset; + } else { + yPos = mViewPortHandler.contentTop() - baseYOffset; + } + + } else { + + if (labelPosition == YAxisLabelPosition.OUTSIDE_CHART) { + yPos = mViewPortHandler.contentBottom() + textHeight + baseYOffset; + } else { + yPos = mViewPortHandler.contentBottom() + textHeight + baseYOffset; + } + } + + drawYLabels(c, yPos, positions, mYAxis.getYOffset()); + } + + @Override + public void renderAxisLine(Canvas c) { + + if (!mYAxis.isEnabled() || !mYAxis.isDrawAxisLineEnabled()) + return; + + mAxisLinePaint.setColor(mYAxis.getAxisLineColor()); + mAxisLinePaint.setStrokeWidth(mYAxis.getAxisLineWidth()); + + if (mYAxis.getAxisDependency() == AxisDependency.LEFT) { + c.drawLine(mViewPortHandler.contentLeft(), + mViewPortHandler.contentTop(), mViewPortHandler.contentRight(), + mViewPortHandler.contentTop(), mAxisLinePaint); + } else { + c.drawLine(mViewPortHandler.contentLeft(), + mViewPortHandler.contentBottom(), mViewPortHandler.contentRight(), + mViewPortHandler.contentBottom(), mAxisLinePaint); + } + } + + /** + * draws the y-labels on the specified x-position + * + * @param fixedPosition + * @param positions + */ + @Override + protected void drawYLabels(Canvas c, float fixedPosition, float[] positions, float offset) { + + mAxisLabelPaint.setTypeface(mYAxis.getTypeface()); + mAxisLabelPaint.setTextSize(mYAxis.getTextSize()); + mAxisLabelPaint.setColor(mYAxis.getTextColor()); + + final int from = mYAxis.isDrawBottomYLabelEntryEnabled() ? 0 : 1; + final int to = mYAxis.isDrawTopYLabelEntryEnabled() + ? mYAxis.mEntryCount + : (mYAxis.mEntryCount - 1); + + float xOffset = mYAxis.getLabelXOffset(); + + for (int i = from; i < to; i++) { + + String text = mYAxis.getFormattedLabel(i); + + c.drawText(text, + positions[i * 2], + fixedPosition - offset + xOffset, + mAxisLabelPaint); + } + } + + @Override + protected float[] getTransformedPositions() { + + if(mGetTransformedPositionsBuffer.length != mYAxis.mEntryCount * 2) { + mGetTransformedPositionsBuffer = new float[mYAxis.mEntryCount * 2]; + } + float[] positions = mGetTransformedPositionsBuffer; + + for (int i = 0; i < positions.length; i += 2) { + // only fill x values, y values are not needed for x-labels + positions[i] = mYAxis.mEntries[i / 2]; + } + + mTrans.pointValuesToPixel(positions); + return positions; + } + + @Override + public RectF getGridClippingRect() { + mGridClippingRect.set(mViewPortHandler.getContentRect()); + mGridClippingRect.inset(-mAxis.getGridLineWidth(), 0.f); + return mGridClippingRect; + } + + @Override + protected Path linePath(Path p, int i, float[] positions) { + + p.moveTo(positions[i], mViewPortHandler.contentTop()); + p.lineTo(positions[i], mViewPortHandler.contentBottom()); + + return p; + } + + protected Path mDrawZeroLinePathBuffer = new Path(); + + @Override + protected void drawZeroLine(Canvas c) { + + int clipRestoreCount = c.save(); + mZeroLineClippingRect.set(mViewPortHandler.getContentRect()); + mZeroLineClippingRect.inset(-mYAxis.getZeroLineWidth(), 0.f); + c.clipRect(mLimitLineClippingRect); + + // draw zero line + MPPointD pos = mTrans.getPixelForValues(0f, 0f); + + mZeroLinePaint.setColor(mYAxis.getZeroLineColor()); + mZeroLinePaint.setStrokeWidth(mYAxis.getZeroLineWidth()); + + Path zeroLinePath = mDrawZeroLinePathBuffer; + zeroLinePath.reset(); + + zeroLinePath.moveTo((float) pos.x - 1, mViewPortHandler.contentTop()); + zeroLinePath.lineTo((float) pos.x - 1, mViewPortHandler.contentBottom()); + + // draw a path because lines don't support dashing on lower android versions + c.drawPath(zeroLinePath, mZeroLinePaint); + + c.restoreToCount(clipRestoreCount); + } + + protected Path mRenderLimitLinesPathBuffer = new Path(); + protected float[] mRenderLimitLinesBuffer = new float[4]; + /** + * Draws the LimitLines associated with this axis to the screen. + * This is the standard XAxis renderer using the YAxis limit lines. + * + * @param c + */ + @Override + public void renderLimitLines(Canvas c) { + + List<LimitLine> limitLines = mYAxis.getLimitLines(); + + if (limitLines == null || limitLines.size() <= 0) + return; + + float[] pts = mRenderLimitLinesBuffer; + pts[0] = 0; + pts[1] = 0; + pts[2] = 0; + pts[3] = 0; + Path limitLinePath = mRenderLimitLinesPathBuffer; + limitLinePath.reset(); + + for (int i = 0; i < limitLines.size(); i++) { + + LimitLine l = limitLines.get(i); + + if (!l.isEnabled()) + continue; + + int clipRestoreCount = c.save(); + mLimitLineClippingRect.set(mViewPortHandler.getContentRect()); + mLimitLineClippingRect.inset(-l.getLineWidth(), 0.f); + c.clipRect(mLimitLineClippingRect); + + pts[0] = l.getLimit(); + pts[2] = l.getLimit(); + + mTrans.pointValuesToPixel(pts); + + pts[1] = mViewPortHandler.contentTop(); + pts[3] = mViewPortHandler.contentBottom(); + + limitLinePath.moveTo(pts[0], pts[1]); + limitLinePath.lineTo(pts[2], pts[3]); + + mLimitLinePaint.setStyle(Paint.Style.STROKE); + mLimitLinePaint.setColor(l.getLineColor()); + mLimitLinePaint.setPathEffect(l.getDashPathEffect()); + mLimitLinePaint.setStrokeWidth(l.getLineWidth()); + + c.drawPath(limitLinePath, mLimitLinePaint); + limitLinePath.reset(); + + String label = l.getLabel(); + + // if drawing the limit-value label is enabled + if (label != null && !label.equals("")) { + + mLimitLinePaint.setStyle(l.getTextStyle()); + mLimitLinePaint.setPathEffect(null); + mLimitLinePaint.setColor(l.getTextColor()); + mLimitLinePaint.setTypeface(l.getTypeface()); + mLimitLinePaint.setStrokeWidth(0.5f); + mLimitLinePaint.setTextSize(l.getTextSize()); + + float xOffset = l.getLineWidth() + l.getXOffset(); + float yOffset = Utils.convertDpToPixel(2f) + l.getYOffset(); + + final LimitLine.LimitLabelPosition position = l.getLabelPosition(); + + if (position == LimitLine.LimitLabelPosition.RIGHT_TOP) { + + final float labelLineHeight = Utils.calcTextHeight(mLimitLinePaint, label); + mLimitLinePaint.setTextAlign(Align.LEFT); + c.drawText(label, pts[0] + xOffset, mViewPortHandler.contentTop() + yOffset + labelLineHeight, mLimitLinePaint); + } else if (position == LimitLine.LimitLabelPosition.RIGHT_BOTTOM) { + + mLimitLinePaint.setTextAlign(Align.LEFT); + c.drawText(label, pts[0] + xOffset, mViewPortHandler.contentBottom() - yOffset, mLimitLinePaint); + } else if (position == LimitLine.LimitLabelPosition.LEFT_TOP) { + + mLimitLinePaint.setTextAlign(Align.RIGHT); + final float labelLineHeight = Utils.calcTextHeight(mLimitLinePaint, label); + c.drawText(label, pts[0] - xOffset, mViewPortHandler.contentTop() + yOffset + labelLineHeight, mLimitLinePaint); + } else { + + mLimitLinePaint.setTextAlign(Align.RIGHT); + c.drawText(label, pts[0] - xOffset, mViewPortHandler.contentBottom() - yOffset, mLimitLinePaint); + } + } + + c.restoreToCount(clipRestoreCount); + } + } +} diff --git a/MPChartLib/src/main/java/com/github/mikephil/charting/renderer/YAxisRendererRadarChart.java b/MPChartLib/src/main/java/com/github/mikephil/charting/renderer/YAxisRendererRadarChart.java new file mode 100644 index 00000000..f7b1ad9e --- /dev/null +++ b/MPChartLib/src/main/java/com/github/mikephil/charting/renderer/YAxisRendererRadarChart.java @@ -0,0 +1,232 @@ +package com.github.mikephil.charting.renderer; + +import android.graphics.Canvas; +import android.graphics.Path; +import android.graphics.PointF; + +import com.github.mikephil.charting.charts.RadarChart; +import com.github.mikephil.charting.components.LimitLine; +import com.github.mikephil.charting.components.YAxis; +import com.github.mikephil.charting.utils.MPPointF; +import com.github.mikephil.charting.utils.Utils; +import com.github.mikephil.charting.utils.ViewPortHandler; + +import java.util.List; + +public class YAxisRendererRadarChart extends YAxisRenderer { + + private RadarChart mChart; + + public YAxisRendererRadarChart(ViewPortHandler viewPortHandler, YAxis yAxis, RadarChart chart) { + super(viewPortHandler, yAxis, null); + + this.mChart = chart; + } + + @Override + protected void computeAxisValues(float min, float max) { + + float yMin = min; + float yMax = max; + + int labelCount = mAxis.getLabelCount(); + double range = Math.abs(yMax - yMin); + + if (labelCount == 0 || range <= 0 || Double.isInfinite(range)) { + mAxis.mEntries = new float[]{}; + mAxis.mCenteredEntries = new float[]{}; + mAxis.mEntryCount = 0; + return; + } + + // Find out how much spacing (in y value space) between axis values + double rawInterval = range / labelCount; + double interval = Utils.roundToNextSignificant(rawInterval); + + // If granularity is enabled, then do not allow the interval to go below specified granularity. + // This is used to avoid repeated values when rounding values for display. + if (mAxis.isGranularityEnabled()) + interval = interval < mAxis.getGranularity() ? mAxis.getGranularity() : interval; + + // Normalize interval + double intervalMagnitude = Utils.roundToNextSignificant(Math.pow(10, (int) Math.log10(interval))); + int intervalSigDigit = (int) (interval / intervalMagnitude); + if (intervalSigDigit > 5) { + // Use one order of magnitude higher, to avoid intervals like 0.9 or 90 + // if it's 0.0 after floor(), we use the old value + interval = Math.floor(10.0 * intervalMagnitude) == 0.0 + ? interval + : Math.floor(10.0 * intervalMagnitude); + } + + boolean centeringEnabled = mAxis.isCenterAxisLabelsEnabled(); + int n = centeringEnabled ? 1 : 0; + + // force label count + if (mAxis.isForceLabelsEnabled()) { + + float step = (float) range / (float) (labelCount - 1); + mAxis.mEntryCount = labelCount; + + if (mAxis.mEntries.length < labelCount) { + // Ensure stops contains at least numStops elements. + mAxis.mEntries = new float[labelCount]; + } + + float v = min; + + for (int i = 0; i < labelCount; i++) { + mAxis.mEntries[i] = v; + v += step; + } + + n = labelCount; + + // no forced count + } else { + + double first = interval == 0.0 ? 0.0 : Math.ceil(yMin / interval) * interval; + if (centeringEnabled) { + first -= interval; + } + + double last = interval == 0.0 ? 0.0 : Utils.nextUp(Math.floor(yMax / interval) * interval); + + double f; + int i; + + if (interval != 0.0) { + for (f = first; f <= last; f += interval) { + ++n; + } + } + + n++; + + mAxis.mEntryCount = n; + + if (mAxis.mEntries.length < n) { + // Ensure stops contains at least numStops elements. + mAxis.mEntries = new float[n]; + } + + for (f = first, i = 0; i < n; f += interval, ++i) { + + if (f == 0.0) // Fix for negative zero case (Where value == -0.0, and 0.0 == -0.0) + f = 0.0; + + mAxis.mEntries[i] = (float) f; + } + } + + // set decimals + if (interval < 1) { + mAxis.mDecimals = (int) Math.ceil(-Math.log10(interval)); + } else { + mAxis.mDecimals = 0; + } + + if (centeringEnabled) { + + if (mAxis.mCenteredEntries.length < n) { + mAxis.mCenteredEntries = new float[n]; + } + + float offset = (mAxis.mEntries[1] - mAxis.mEntries[0]) / 2f; + + for (int i = 0; i < n; i++) { + mAxis.mCenteredEntries[i] = mAxis.mEntries[i] + offset; + } + } + + mAxis.mAxisMinimum = mAxis.mEntries[0]; + mAxis.mAxisMaximum = mAxis.mEntries[n-1]; + mAxis.mAxisRange = Math.abs(mAxis.mAxisMaximum - mAxis.mAxisMinimum); + } + + @Override + public void renderAxisLabels(Canvas c) { + + if (!mYAxis.isEnabled() || !mYAxis.isDrawLabelsEnabled()) + return; + + mAxisLabelPaint.setTypeface(mYAxis.getTypeface()); + mAxisLabelPaint.setTextSize(mYAxis.getTextSize()); + mAxisLabelPaint.setColor(mYAxis.getTextColor()); + + MPPointF center = mChart.getCenterOffsets(); + MPPointF pOut = MPPointF.getInstance(0,0); + float factor = mChart.getFactor(); + + final int from = mYAxis.isDrawBottomYLabelEntryEnabled() ? 0 : 1; + final int to = mYAxis.isDrawTopYLabelEntryEnabled() + ? mYAxis.mEntryCount + : (mYAxis.mEntryCount - 1); + + float xOffset = mYAxis.getLabelXOffset(); + + for (int j = from; j < to; j++) { + + float r = (mYAxis.mEntries[j] - mYAxis.mAxisMinimum) * factor; + + Utils.getPosition(center, r, mChart.getRotationAngle(), pOut); + + String label = mYAxis.getFormattedLabel(j); + + c.drawText(label, pOut.x + xOffset, pOut.y, mAxisLabelPaint); + } + MPPointF.recycleInstance(center); + MPPointF.recycleInstance(pOut); + } + + private Path mRenderLimitLinesPathBuffer = new Path(); + @Override + public void renderLimitLines(Canvas c) { + + List<LimitLine> limitLines = mYAxis.getLimitLines(); + + if (limitLines == null) + return; + + float sliceangle = mChart.getSliceAngle(); + + // calculate the factor that is needed for transforming the value to + // pixels + float factor = mChart.getFactor(); + + MPPointF center = mChart.getCenterOffsets(); + MPPointF pOut = MPPointF.getInstance(0,0); + for (int i = 0; i < limitLines.size(); i++) { + + LimitLine l = limitLines.get(i); + + if (!l.isEnabled()) + continue; + + mLimitLinePaint.setColor(l.getLineColor()); + mLimitLinePaint.setPathEffect(l.getDashPathEffect()); + mLimitLinePaint.setStrokeWidth(l.getLineWidth()); + + float r = (l.getLimit() - mChart.getYChartMin()) * factor; + + Path limitPath = mRenderLimitLinesPathBuffer; + limitPath.reset(); + + + for (int j = 0; j < mChart.getData().getMaxEntryCountSet().getEntryCount(); j++) { + + Utils.getPosition(center, r, sliceangle * j + mChart.getRotationAngle(), pOut); + + if (j == 0) + limitPath.moveTo(pOut.x, pOut.y); + else + limitPath.lineTo(pOut.x, pOut.y); + } + limitPath.close(); + + c.drawPath(limitPath, mLimitLinePaint); + } + MPPointF.recycleInstance(center); + MPPointF.recycleInstance(pOut); + } +} diff --git a/MPChartLib/src/main/java/com/github/mikephil/charting/renderer/scatter/ChevronDownShapeRenderer.java b/MPChartLib/src/main/java/com/github/mikephil/charting/renderer/scatter/ChevronDownShapeRenderer.java new file mode 100644 index 00000000..9328b276 --- /dev/null +++ b/MPChartLib/src/main/java/com/github/mikephil/charting/renderer/scatter/ChevronDownShapeRenderer.java @@ -0,0 +1,41 @@ +package com.github.mikephil.charting.renderer.scatter; + +import android.graphics.Canvas; +import android.graphics.Paint; + +import com.github.mikephil.charting.interfaces.datasets.IScatterDataSet; +import com.github.mikephil.charting.utils.Utils; +import com.github.mikephil.charting.utils.ViewPortHandler; + +/** + * Created by wajdic on 15/06/2016. + * Created at Time 09:08 + */ +public class ChevronDownShapeRenderer implements IShapeRenderer +{ + + + @Override + public void renderShape(Canvas c, IScatterDataSet dataSet, ViewPortHandler viewPortHandler, + float posX, float posY, Paint renderPaint) { + + final float shapeHalf = dataSet.getScatterShapeSize() / 2f; + + renderPaint.setStyle(Paint.Style.STROKE); + renderPaint.setStrokeWidth(Utils.convertDpToPixel(1f)); + + c.drawLine( + posX, + posY + (2 * shapeHalf), + posX + (2 * shapeHalf), + posY, + renderPaint); + + c.drawLine( + posX, + posY + (2 * shapeHalf), + posX - (2 * shapeHalf), + posY, + renderPaint); + } +} diff --git a/MPChartLib/src/main/java/com/github/mikephil/charting/renderer/scatter/ChevronUpShapeRenderer.java b/MPChartLib/src/main/java/com/github/mikephil/charting/renderer/scatter/ChevronUpShapeRenderer.java new file mode 100644 index 00000000..6dea0abf --- /dev/null +++ b/MPChartLib/src/main/java/com/github/mikephil/charting/renderer/scatter/ChevronUpShapeRenderer.java @@ -0,0 +1,42 @@ +package com.github.mikephil.charting.renderer.scatter; + +import android.graphics.Canvas; +import android.graphics.Paint; + +import com.github.mikephil.charting.interfaces.datasets.IScatterDataSet; +import com.github.mikephil.charting.utils.Utils; +import com.github.mikephil.charting.utils.ViewPortHandler; + +/** + * Created by wajdic on 15/06/2016. + * Created at Time 09:08 + */ +public class ChevronUpShapeRenderer implements IShapeRenderer +{ + + + @Override + public void renderShape(Canvas c, IScatterDataSet dataSet, ViewPortHandler viewPortHandler, + float posX, float posY, Paint renderPaint) { + + final float shapeHalf = dataSet.getScatterShapeSize() / 2f; + + renderPaint.setStyle(Paint.Style.STROKE); + renderPaint.setStrokeWidth(Utils.convertDpToPixel(1f)); + + c.drawLine( + posX, + posY - (2 * shapeHalf), + posX + (2 * shapeHalf), + posY, + renderPaint); + + c.drawLine( + posX, + posY - (2 * shapeHalf), + posX - (2 * shapeHalf), + posY, + renderPaint); + + } +} diff --git a/MPChartLib/src/main/java/com/github/mikephil/charting/renderer/scatter/CircleShapeRenderer.java b/MPChartLib/src/main/java/com/github/mikephil/charting/renderer/scatter/CircleShapeRenderer.java new file mode 100644 index 00000000..ac7abb92 --- /dev/null +++ b/MPChartLib/src/main/java/com/github/mikephil/charting/renderer/scatter/CircleShapeRenderer.java @@ -0,0 +1,63 @@ +package com.github.mikephil.charting.renderer.scatter; + +import android.graphics.Canvas; +import android.graphics.Paint; + +import com.github.mikephil.charting.interfaces.datasets.IScatterDataSet; +import com.github.mikephil.charting.utils.ColorTemplate; +import com.github.mikephil.charting.utils.Utils; +import com.github.mikephil.charting.utils.ViewPortHandler; + +/** + * Created by wajdic on 15/06/2016. + * Created at Time 09:08 + */ +public class CircleShapeRenderer implements IShapeRenderer +{ + + @Override + public void renderShape(Canvas c, IScatterDataSet dataSet, ViewPortHandler viewPortHandler, + float posX, float posY, Paint renderPaint) { + + final float shapeSize = dataSet.getScatterShapeSize(); + final float shapeHalf = shapeSize / 2f; + final float shapeHoleSizeHalf = Utils.convertDpToPixel(dataSet.getScatterShapeHoleRadius()); + final float shapeHoleSize = shapeHoleSizeHalf * 2.f; + final float shapeStrokeSize = (shapeSize - shapeHoleSize) / 2.f; + final float shapeStrokeSizeHalf = shapeStrokeSize / 2.f; + + final int shapeHoleColor = dataSet.getScatterShapeHoleColor(); + + if (shapeSize > 0.0) { + renderPaint.setStyle(Paint.Style.STROKE); + renderPaint.setStrokeWidth(shapeStrokeSize); + + c.drawCircle( + posX, + posY, + shapeHoleSizeHalf + shapeStrokeSizeHalf, + renderPaint); + + if (shapeHoleColor != ColorTemplate.COLOR_NONE) { + renderPaint.setStyle(Paint.Style.FILL); + + renderPaint.setColor(shapeHoleColor); + c.drawCircle( + posX, + posY, + shapeHoleSizeHalf, + renderPaint); + } + } else { + renderPaint.setStyle(Paint.Style.FILL); + + c.drawCircle( + posX, + posY, + shapeHalf, + renderPaint); + } + + } + +} diff --git a/MPChartLib/src/main/java/com/github/mikephil/charting/renderer/scatter/CrossShapeRenderer.java b/MPChartLib/src/main/java/com/github/mikephil/charting/renderer/scatter/CrossShapeRenderer.java new file mode 100644 index 00000000..202670d6 --- /dev/null +++ b/MPChartLib/src/main/java/com/github/mikephil/charting/renderer/scatter/CrossShapeRenderer.java @@ -0,0 +1,41 @@ +package com.github.mikephil.charting.renderer.scatter; + +import android.graphics.Canvas; +import android.graphics.Paint; + +import com.github.mikephil.charting.interfaces.datasets.IScatterDataSet; +import com.github.mikephil.charting.utils.Utils; +import com.github.mikephil.charting.utils.ViewPortHandler; + +/** + * Created by wajdic on 15/06/2016. + * Created at Time 09:08 + */ +public class CrossShapeRenderer implements IShapeRenderer +{ + + + @Override + public void renderShape(Canvas c, IScatterDataSet dataSet, ViewPortHandler viewPortHandler, + float posX, float posY, Paint renderPaint) { + + final float shapeHalf = dataSet.getScatterShapeSize() / 2f; + + renderPaint.setStyle(Paint.Style.STROKE); + renderPaint.setStrokeWidth(Utils.convertDpToPixel(1f)); + + c.drawLine( + posX - shapeHalf, + posY, + posX + shapeHalf, + posY, + renderPaint); + c.drawLine( + posX, + posY - shapeHalf, + posX, + posY + shapeHalf, + renderPaint); + + } +} diff --git a/MPChartLib/src/main/java/com/github/mikephil/charting/renderer/scatter/IShapeRenderer.java b/MPChartLib/src/main/java/com/github/mikephil/charting/renderer/scatter/IShapeRenderer.java new file mode 100644 index 00000000..20b57a90 --- /dev/null +++ b/MPChartLib/src/main/java/com/github/mikephil/charting/renderer/scatter/IShapeRenderer.java @@ -0,0 +1,28 @@ +package com.github.mikephil.charting.renderer.scatter; + +import android.graphics.Canvas; +import android.graphics.Paint; + +import com.github.mikephil.charting.interfaces.datasets.IScatterDataSet; +import com.github.mikephil.charting.utils.ViewPortHandler; + +/** + * Created by wajdic on 15/06/2016. + * Created at Time 09:07 + */ +public interface IShapeRenderer +{ + + /** + * Renders the provided ScatterDataSet with a shape. + * + * @param c Canvas object for drawing the shape + * @param dataSet The DataSet to be drawn + * @param viewPortHandler Contains information about the current state of the view + * @param posX Position to draw the shape at + * @param posY Position to draw the shape at + * @param renderPaint Paint object used for styling and drawing + */ + void renderShape(Canvas c, IScatterDataSet dataSet, ViewPortHandler viewPortHandler, + float posX, float posY, Paint renderPaint); +} diff --git a/MPChartLib/src/main/java/com/github/mikephil/charting/renderer/scatter/SquareShapeRenderer.java b/MPChartLib/src/main/java/com/github/mikephil/charting/renderer/scatter/SquareShapeRenderer.java new file mode 100644 index 00000000..ac986792 --- /dev/null +++ b/MPChartLib/src/main/java/com/github/mikephil/charting/renderer/scatter/SquareShapeRenderer.java @@ -0,0 +1,63 @@ +package com.github.mikephil.charting.renderer.scatter; + +import android.graphics.Canvas; +import android.graphics.Paint; + +import com.github.mikephil.charting.interfaces.datasets.IScatterDataSet; +import com.github.mikephil.charting.utils.ColorTemplate; +import com.github.mikephil.charting.utils.Utils; +import com.github.mikephil.charting.utils.ViewPortHandler; + +/** + * Created by wajdic on 15/06/2016. + * Created at Time 09:08 + */ +public class SquareShapeRenderer implements IShapeRenderer +{ + + + @Override + public void renderShape(Canvas c, IScatterDataSet dataSet, ViewPortHandler viewPortHandler, + float posX, float posY, Paint renderPaint) { + + final float shapeSize = dataSet.getScatterShapeSize(); + final float shapeHalf = shapeSize / 2f; + final float shapeHoleSizeHalf = Utils.convertDpToPixel(dataSet.getScatterShapeHoleRadius()); + final float shapeHoleSize = shapeHoleSizeHalf * 2.f; + final float shapeStrokeSize = (shapeSize - shapeHoleSize) / 2.f; + final float shapeStrokeSizeHalf = shapeStrokeSize / 2.f; + + final int shapeHoleColor = dataSet.getScatterShapeHoleColor(); + + if (shapeSize > 0.0) { + renderPaint.setStyle(Paint.Style.STROKE); + renderPaint.setStrokeWidth(shapeStrokeSize); + + c.drawRect(posX - shapeHoleSizeHalf - shapeStrokeSizeHalf, + posY - shapeHoleSizeHalf - shapeStrokeSizeHalf, + posX + shapeHoleSizeHalf + shapeStrokeSizeHalf, + posY + shapeHoleSizeHalf + shapeStrokeSizeHalf, + renderPaint); + + if (shapeHoleColor != ColorTemplate.COLOR_NONE) { + renderPaint.setStyle(Paint.Style.FILL); + + renderPaint.setColor(shapeHoleColor); + c.drawRect(posX - shapeHoleSizeHalf, + posY - shapeHoleSizeHalf, + posX + shapeHoleSizeHalf, + posY + shapeHoleSizeHalf, + renderPaint); + } + + } else { + renderPaint.setStyle(Paint.Style.FILL); + + c.drawRect(posX - shapeHalf, + posY - shapeHalf, + posX + shapeHalf, + posY + shapeHalf, + renderPaint); + } + } +} diff --git a/MPChartLib/src/main/java/com/github/mikephil/charting/renderer/scatter/TriangleShapeRenderer.java b/MPChartLib/src/main/java/com/github/mikephil/charting/renderer/scatter/TriangleShapeRenderer.java new file mode 100644 index 00000000..5343454b --- /dev/null +++ b/MPChartLib/src/main/java/com/github/mikephil/charting/renderer/scatter/TriangleShapeRenderer.java @@ -0,0 +1,80 @@ +package com.github.mikephil.charting.renderer.scatter; + +import android.graphics.Canvas; +import android.graphics.Paint; +import android.graphics.Path; + +import com.github.mikephil.charting.interfaces.datasets.IScatterDataSet; +import com.github.mikephil.charting.utils.ColorTemplate; +import com.github.mikephil.charting.utils.Utils; +import com.github.mikephil.charting.utils.ViewPortHandler; + +/** + * Created by wajdic on 15/06/2016. + * Created at Time 09:08 + */ +public class TriangleShapeRenderer implements IShapeRenderer +{ + + protected Path mTrianglePathBuffer = new Path(); + + @Override + public void renderShape(Canvas c, IScatterDataSet dataSet, ViewPortHandler viewPortHandler, + float posX, float posY, Paint renderPaint) { + + final float shapeSize = dataSet.getScatterShapeSize(); + final float shapeHalf = shapeSize / 2f; + final float shapeHoleSizeHalf = Utils.convertDpToPixel(dataSet.getScatterShapeHoleRadius()); + final float shapeHoleSize = shapeHoleSizeHalf * 2.f; + final float shapeStrokeSize = (shapeSize - shapeHoleSize) / 2.f; + + final int shapeHoleColor = dataSet.getScatterShapeHoleColor(); + + renderPaint.setStyle(Paint.Style.FILL); + + // create a triangle path + Path tri = mTrianglePathBuffer; + tri.reset(); + + tri.moveTo(posX, posY - shapeHalf); + tri.lineTo(posX + shapeHalf, posY + shapeHalf); + tri.lineTo(posX - shapeHalf, posY + shapeHalf); + + if (shapeSize > 0.0) { + tri.lineTo(posX, posY - shapeHalf); + + tri.moveTo(posX - shapeHalf + shapeStrokeSize, + posY + shapeHalf - shapeStrokeSize); + tri.lineTo(posX + shapeHalf - shapeStrokeSize, + posY + shapeHalf - shapeStrokeSize); + tri.lineTo(posX, + posY - shapeHalf + shapeStrokeSize); + tri.lineTo(posX - shapeHalf + shapeStrokeSize, + posY + shapeHalf - shapeStrokeSize); + } + + tri.close(); + + c.drawPath(tri, renderPaint); + tri.reset(); + + if (shapeSize > 0.0 && + shapeHoleColor != ColorTemplate.COLOR_NONE) { + + renderPaint.setColor(shapeHoleColor); + + tri.moveTo(posX, + posY - shapeHalf + shapeStrokeSize); + tri.lineTo(posX + shapeHalf - shapeStrokeSize, + posY + shapeHalf - shapeStrokeSize); + tri.lineTo(posX - shapeHalf + shapeStrokeSize, + posY + shapeHalf - shapeStrokeSize); + tri.close(); + + c.drawPath(tri, renderPaint); + tri.reset(); + } + + } + +}
\ No newline at end of file diff --git a/MPChartLib/src/main/java/com/github/mikephil/charting/renderer/scatter/XShapeRenderer.java b/MPChartLib/src/main/java/com/github/mikephil/charting/renderer/scatter/XShapeRenderer.java new file mode 100644 index 00000000..225640ec --- /dev/null +++ b/MPChartLib/src/main/java/com/github/mikephil/charting/renderer/scatter/XShapeRenderer.java @@ -0,0 +1,42 @@ +package com.github.mikephil.charting.renderer.scatter; + +import android.graphics.Canvas; +import android.graphics.Paint; + +import com.github.mikephil.charting.interfaces.datasets.IScatterDataSet; +import com.github.mikephil.charting.utils.Utils; +import com.github.mikephil.charting.utils.ViewPortHandler; + +/** + * Created by wajdic on 15/06/2016. + * Created at Time 09:08 + */ +public class XShapeRenderer implements IShapeRenderer +{ + + + @Override + public void renderShape(Canvas c, IScatterDataSet dataSet, ViewPortHandler viewPortHandler, + float posX, float posY, Paint renderPaint) { + + final float shapeHalf = dataSet.getScatterShapeSize() / 2f; + + renderPaint.setStyle(Paint.Style.STROKE); + renderPaint.setStrokeWidth(Utils.convertDpToPixel(1f)); + + c.drawLine( + posX - shapeHalf, + posY - shapeHalf, + posX + shapeHalf, + posY + shapeHalf, + renderPaint); + c.drawLine( + posX + shapeHalf, + posY - shapeHalf, + posX - shapeHalf, + posY + shapeHalf, + renderPaint); + + } + +}
\ No newline at end of file diff --git a/MPChartLib/src/main/java/com/github/mikephil/charting/utils/ColorTemplate.java b/MPChartLib/src/main/java/com/github/mikephil/charting/utils/ColorTemplate.java new file mode 100644 index 00000000..4d9c1de7 --- /dev/null +++ b/MPChartLib/src/main/java/com/github/mikephil/charting/utils/ColorTemplate.java @@ -0,0 +1,128 @@ + +package com.github.mikephil.charting.utils; + +import android.content.res.Resources; +import android.graphics.Color; + +import java.util.ArrayList; +import java.util.List; + +/** + * Class that holds predefined color integer arrays (e.g. + * ColorTemplate.VORDIPLOM_COLORS) and convenience methods for loading colors + * from resources. + * + * @author Philipp Jahoda + */ +public class ColorTemplate { + + /** + * an "invalid" color that indicates that no color is set + */ + public static final int COLOR_NONE = 0x00112233; + + /** + * this "color" is used for the Legend creation and indicates that the next + * form should be skipped + */ + public static final int COLOR_SKIP = 0x00112234; + + /** + * THE COLOR THEMES ARE PREDEFINED (predefined color integer arrays), FEEL + * FREE TO CREATE YOUR OWN WITH AS MANY DIFFERENT COLORS AS YOU WANT + */ + public static final int[] LIBERTY_COLORS = { + Color.rgb(207, 248, 246), Color.rgb(148, 212, 212), Color.rgb(136, 180, 187), + Color.rgb(118, 174, 175), Color.rgb(42, 109, 130) + }; + public static final int[] JOYFUL_COLORS = { + Color.rgb(217, 80, 138), Color.rgb(254, 149, 7), Color.rgb(254, 247, 120), + Color.rgb(106, 167, 134), Color.rgb(53, 194, 209) + }; + public static final int[] PASTEL_COLORS = { + Color.rgb(64, 89, 128), Color.rgb(149, 165, 124), Color.rgb(217, 184, 162), + Color.rgb(191, 134, 134), Color.rgb(179, 48, 80) + }; + public static final int[] COLORFUL_COLORS = { + Color.rgb(193, 37, 82), Color.rgb(255, 102, 0), Color.rgb(245, 199, 0), + Color.rgb(106, 150, 31), Color.rgb(179, 100, 53) + }; + public static final int[] VORDIPLOM_COLORS = { + Color.rgb(192, 255, 140), Color.rgb(255, 247, 140), Color.rgb(255, 208, 140), + Color.rgb(140, 234, 255), Color.rgb(255, 140, 157) + }; + public static final int[] MATERIAL_COLORS = { + rgb("#2ecc71"), rgb("#f1c40f"), rgb("#e74c3c"), rgb("#3498db") + }; + + /** + * Converts the given hex-color-string to rgb. + * + * @param hex + * @return + */ + public static int rgb(String hex) { + int color = (int) Long.parseLong(hex.replace("#", ""), 16); + int r = (color >> 16) & 0xFF; + int g = (color >> 8) & 0xFF; + int b = (color >> 0) & 0xFF; + return Color.rgb(r, g, b); + } + + /** + * Returns the Android ICS holo blue light color. + * + * @return + */ + public static int getHoloBlue() { + return Color.rgb(51, 181, 229); + } + + /** + * Sets the alpha component of the given color. + * + * @param color + * @param alpha 0 - 255 + * @return + */ + public static int colorWithAlpha(int color, int alpha) { + return (color & 0xffffff) | ((alpha & 0xff) << 24); + } + + /** + * turn an array of resource-colors (contains resource-id integers) into an + * array list of actual color integers + * + * @param r + * @param colors an integer array of resource id's of colors + * @return + */ + public static List<Integer> createColors(Resources r, int[] colors) { + + List<Integer> result = new ArrayList<Integer>(); + + for (int i : colors) { + result.add(r.getColor(i)); + } + + return result; + } + + /** + * Turns an array of colors (integer color values) into an ArrayList of + * colors. + * + * @param colors + * @return + */ + public static List<Integer> createColors(int[] colors) { + + List<Integer> result = new ArrayList<Integer>(); + + for (int i : colors) { + result.add(i); + } + + return result; + } +} diff --git a/MPChartLib/src/main/java/com/github/mikephil/charting/utils/EntryXComparator.java b/MPChartLib/src/main/java/com/github/mikephil/charting/utils/EntryXComparator.java new file mode 100644 index 00000000..8f59c12d --- /dev/null +++ b/MPChartLib/src/main/java/com/github/mikephil/charting/utils/EntryXComparator.java @@ -0,0 +1,22 @@ +package com.github.mikephil.charting.utils; + +import com.github.mikephil.charting.data.Entry; + +import java.util.Comparator; + +/** + * Comparator for comparing Entry-objects by their x-value. + * Created by philipp on 17/06/15. + */ +public class EntryXComparator implements Comparator<Entry> { + @Override + public int compare(Entry entry1, Entry entry2) { + float diff = entry1.getX() - entry2.getX(); + + if (diff == 0f) return 0; + else { + if (diff > 0f) return 1; + else return -1; + } + } +} diff --git a/MPChartLib/src/main/java/com/github/mikephil/charting/utils/FSize.java b/MPChartLib/src/main/java/com/github/mikephil/charting/utils/FSize.java new file mode 100644 index 00000000..a12bc459 --- /dev/null +++ b/MPChartLib/src/main/java/com/github/mikephil/charting/utils/FSize.java @@ -0,0 +1,79 @@ + +package com.github.mikephil.charting.utils; + +import java.util.List; + +/** + * Class for describing width and height dimensions in some arbitrary + * unit. Replacement for the android.Util.SizeF which is available only on API >= 21. + */ +public final class FSize extends ObjectPool.Poolable{ + + // TODO : Encapsulate width & height + + public float width; + public float height; + + private static ObjectPool<FSize> pool; + + static { + pool = ObjectPool.create(256, new FSize(0,0)); + pool.setReplenishPercentage(0.5f); + } + + + protected ObjectPool.Poolable instantiate(){ + return new FSize(0,0); + } + + public static FSize getInstance(final float width, final float height){ + FSize result = pool.get(); + result.width = width; + result.height = height; + return result; + } + + public static void recycleInstance(FSize instance){ + pool.recycle(instance); + } + + public static void recycleInstances(List<FSize> instances){ + pool.recycle(instances); + } + + public FSize() { + } + + public FSize(final float width, final float height) { + this.width = width; + this.height = height; + } + + @Override + public boolean equals(final Object obj) { + if (obj == null) { + return false; + } + if (this == obj) { + return true; + } + if (obj instanceof FSize) { + final FSize other = (FSize) obj; + return width == other.width && height == other.height; + } + return false; + } + + @Override + public String toString() { + return width + "x" + height; + } + + /** + * {@inheritDoc} + */ + @Override + public int hashCode() { + return Float.floatToIntBits(width) ^ Float.floatToIntBits(height); + } +} diff --git a/MPChartLib/src/main/java/com/github/mikephil/charting/utils/FileUtils.java b/MPChartLib/src/main/java/com/github/mikephil/charting/utils/FileUtils.java new file mode 100644 index 00000000..5aff51ff --- /dev/null +++ b/MPChartLib/src/main/java/com/github/mikephil/charting/utils/FileUtils.java @@ -0,0 +1,301 @@ + +package com.github.mikephil.charting.utils; + +import android.content.res.AssetManager; +import android.os.Environment; +import android.util.Log; + +import com.github.mikephil.charting.data.BarEntry; +import com.github.mikephil.charting.data.Entry; + +import java.io.BufferedReader; +import java.io.BufferedWriter; +import java.io.File; +import java.io.FileReader; +import java.io.FileWriter; +import java.io.IOException; +import java.io.InputStreamReader; +import java.util.ArrayList; +import java.util.List; + +/** + * Utilities class for interacting with the assets and the devices storage to + * load and save DataSet objects from and to .txt files. + * + * @author Philipp Jahoda + */ +public class FileUtils { + + private static final String LOG = "MPChart-FileUtils"; + + /** + * Loads a an Array of Entries from a textfile from the sd-card. + * + * @param path the name of the file on the sd-card (+ path if needed) + * @return + */ + public static List<Entry> loadEntriesFromFile(String path) { + + File sdcard = Environment.getExternalStorageDirectory(); + + // Get the text file + File file = new File(sdcard, path); + + List<Entry> entries = new ArrayList<Entry>(); + + try { + @SuppressWarnings("resource") + BufferedReader br = new BufferedReader(new FileReader(file)); + String line; + + while ((line = br.readLine()) != null) { + String[] split = line.split("#"); + + if (split.length <= 2) { + entries.add(new Entry(Float.parseFloat(split[0]), Integer.parseInt(split[1]))); + } else { + + float[] vals = new float[split.length - 1]; + + for (int i = 0; i < vals.length; i++) { + vals[i] = Float.parseFloat(split[i]); + } + + entries.add(new BarEntry(Integer.parseInt(split[split.length - 1]), vals)); + } + } + } catch (IOException e) { + Log.e(LOG, e.toString()); + } + + return entries; + + // File sdcard = Environment.getExternalStorageDirectory(); + // + // // Get the text file + // File file = new File(sdcard, path); + // + // List<Entry> entries = new ArrayList<Entry>(); + // String label = ""; + // + // try { + // @SuppressWarnings("resource") + // BufferedReader br = new BufferedReader(new FileReader(file)); + // String line = br.readLine(); + // + // // firstline is the label + // label = line; + // + // while ((line = br.readLine()) != null) { + // String[] split = line.split("#"); + // entries.add(new Entry(Float.parseFloat(split[0]), + // Integer.parseInt(split[1]))); + // } + // } catch (IOException e) { + // Log.e(LOG, e.toString()); + // } + // + // DataSet ds = new DataSet(entries, label); + // return ds; + } + + /** + * Loads an array of Entries from a textfile from the assets folder. + * + * @param am + * @param path the name of the file in the assets folder (+ path if needed) + * @return + */ + public static List<Entry> loadEntriesFromAssets(AssetManager am, String path) { + + List<Entry> entries = new ArrayList<Entry>(); + + BufferedReader reader = null; + try { + reader = new BufferedReader( + new InputStreamReader(am.open(path), "UTF-8")); + + String line = reader.readLine(); + + while (line != null) { + // process line + String[] split = line.split("#"); + + if (split.length <= 2) { + entries.add(new Entry(Float.parseFloat(split[1]), Float.parseFloat(split[0]))); + } else { + + float[] vals = new float[split.length - 1]; + + for (int i = 0; i < vals.length; i++) { + vals[i] = Float.parseFloat(split[i]); + } + + entries.add(new BarEntry(Integer.parseInt(split[split.length - 1]), vals)); + } + line = reader.readLine(); + } + } catch (IOException e) { + Log.e(LOG, e.toString()); + + } finally { + + if (reader != null) { + try { + reader.close(); + } catch (IOException e) { + Log.e(LOG, e.toString()); + } + } + } + + return entries; + + // String label = null; + // List<Entry> entries = new ArrayList<Entry>(); + // + // BufferedReader reader = null; + // try { + // reader = new BufferedReader( + // new InputStreamReader(am.open(path), "UTF-8")); + // + // // do reading, usually loop until end of file reading + // label = reader.readLine(); + // String line = reader.readLine(); + // + // while (line != null) { + // // process line + // String[] split = line.split("#"); + // entries.add(new Entry(Float.parseFloat(split[0]), + // Integer.parseInt(split[1]))); + // line = reader.readLine(); + // } + // } catch (IOException e) { + // Log.e(LOG, e.toString()); + // + // } finally { + // + // if (reader != null) { + // try { + // reader.close(); + // } catch (IOException e) { + // Log.e(LOG, e.toString()); + // } + // } + // } + // + // DataSet ds = new DataSet(entries, label); + // return ds; + } + + /** + * Saves an Array of Entries to the specified location on the sdcard + * + * @param entries + * @param path + */ + public static void saveToSdCard(List<Entry> entries, String path) { + + File sdcard = Environment.getExternalStorageDirectory(); + + File saved = new File(sdcard, path); + if (!saved.exists()) + { + try + { + saved.createNewFile(); + } catch (IOException e) + { + Log.e(LOG, e.toString()); + } + } + try + { + // BufferedWriter for performance, true to set append to file flag + BufferedWriter buf = new BufferedWriter(new FileWriter(saved, true)); + + for (Entry e : entries) { + + buf.append(e.getY() + "#" + e.getX()); + buf.newLine(); + } + + buf.close(); + } catch (IOException e) + { + Log.e(LOG, e.toString()); + } + } + + public static List<BarEntry> loadBarEntriesFromAssets(AssetManager am, String path) { + + List<BarEntry> entries = new ArrayList<BarEntry>(); + + BufferedReader reader = null; + try { + reader = new BufferedReader( + new InputStreamReader(am.open(path), "UTF-8")); + + String line = reader.readLine(); + + while (line != null) { + // process line + String[] split = line.split("#"); + + entries.add(new BarEntry(Float.parseFloat(split[1]), Float.parseFloat(split[0]))); + + line = reader.readLine(); + } + } catch (IOException e) { + Log.e(LOG, e.toString()); + + } finally { + + if (reader != null) { + try { + reader.close(); + } catch (IOException e) { + Log.e(LOG, e.toString()); + } + } + } + + return entries; + + // String label = null; + // ArrayList<Entry> entries = new ArrayList<Entry>(); + // + // BufferedReader reader = null; + // try { + // reader = new BufferedReader( + // new InputStreamReader(am.open(path), "UTF-8")); + // + // // do reading, usually loop until end of file reading + // label = reader.readLine(); + // String line = reader.readLine(); + // + // while (line != null) { + // // process line + // String[] split = line.split("#"); + // entries.add(new Entry(Float.parseFloat(split[0]), + // Integer.parseInt(split[1]))); + // line = reader.readLine(); + // } + // } catch (IOException e) { + // Log.e(LOG, e.toString()); + // + // } finally { + // + // if (reader != null) { + // try { + // reader.close(); + // } catch (IOException e) { + // Log.e(LOG, e.toString()); + // } + // } + // } + // + // DataSet ds = new DataSet(entries, label); + // return ds; + } +} diff --git a/MPChartLib/src/main/java/com/github/mikephil/charting/utils/Fill.java b/MPChartLib/src/main/java/com/github/mikephil/charting/utils/Fill.java new file mode 100644 index 00000000..d12e1fb8 --- /dev/null +++ b/MPChartLib/src/main/java/com/github/mikephil/charting/utils/Fill.java @@ -0,0 +1,342 @@ +package com.github.mikephil.charting.utils; + +import android.graphics.Canvas; +import android.graphics.LinearGradient; +import android.graphics.Paint; +import android.graphics.Path; +import android.graphics.RectF; +import android.graphics.drawable.Drawable; + +import androidx.annotation.NonNull; +import androidx.annotation.Nullable; + +public class Fill +{ + public enum Type + { + EMPTY, COLOR, LINEAR_GRADIENT, DRAWABLE + } + + public enum Direction + { + DOWN, UP, RIGHT, LEFT + } + + /** + * the type of fill + */ + private Type mType = Type.EMPTY; + + /** + * the color that is used for filling + */ + @Nullable + private Integer mColor = null; + + private Integer mFinalColor = null; + + /** + * the drawable to be used for filling + */ + @Nullable + protected Drawable mDrawable; + + @Nullable + private int[] mGradientColors; + + @Nullable + private float[] mGradientPositions; + + /** + * transparency used for filling + */ + private int mAlpha = 255; + + public Fill() + { + } + + public Fill(int color) + { + this.mType = Type.COLOR; + this.mColor = color; + calculateFinalColor(); + } + + public Fill(int startColor, int endColor) + { + this.mType = Type.LINEAR_GRADIENT; + this.mGradientColors = new int[]{startColor, endColor}; + } + + public Fill(@NonNull int[] gradientColors) + { + this.mType = Type.LINEAR_GRADIENT; + this.mGradientColors = gradientColors; + } + + public Fill(@NonNull int[] gradientColors, @NonNull float[] gradientPositions) + { + this.mType = Type.LINEAR_GRADIENT; + this.mGradientColors = gradientColors; + this.mGradientPositions = gradientPositions; + } + + public Fill(@NonNull Drawable drawable) + { + this.mType = Type.DRAWABLE; + this.mDrawable = drawable; + } + + public Type getType() + { + return mType; + } + + public void setType(Type type) + { + this.mType = type; + } + + @Nullable + public Integer getColor() + { + return mColor; + } + + public void setColor(int color) + { + this.mColor = color; + calculateFinalColor(); + } + + public int[] getGradientColors() + { + return mGradientColors; + } + + public void setGradientColors(int[] colors) + { + this.mGradientColors = colors; + } + + public float[] getGradientPositions() + { + return mGradientPositions; + } + + public void setGradientPositions(float[] positions) + { + this.mGradientPositions = positions; + } + + public void setGradientColors(int startColor, int endColor) + { + this.mGradientColors = new int[]{startColor, endColor}; + } + + public int getAlpha() + { + return mAlpha; + } + + public void setAlpha(int alpha) + { + this.mAlpha = alpha; + calculateFinalColor(); + } + + private void calculateFinalColor() + { + if (mColor == null) + { + mFinalColor = null; + } else + { + int alpha = (int) Math.floor(((mColor >> 24) / 255.0) * (mAlpha / 255.0) * 255.0); + mFinalColor = (alpha << 24) | (mColor & 0xffffff); + } + } + + public void fillRect(Canvas c, Paint paint, + float left, float top, float right, float bottom, + Direction gradientDirection) + { + switch (mType) + { + case EMPTY: + return; + + case COLOR: + { + if (mFinalColor == null) return; + + if (isClipPathSupported()) + { + int save = c.save(); + + c.clipRect(left, top, right, bottom); + c.drawColor(mFinalColor); + + c.restoreToCount(save); + } + else + { + // save + Paint.Style previous = paint.getStyle(); + int previousColor = paint.getColor(); + + // set + paint.setStyle(Paint.Style.FILL); + paint.setColor(mFinalColor); + + c.drawRect(left, top, right, bottom, paint); + + // restore + paint.setColor(previousColor); + paint.setStyle(previous); + } + } + break; + + case LINEAR_GRADIENT: + { + if (mGradientColors == null) return; + + LinearGradient gradient = new LinearGradient( + (int) (gradientDirection == Direction.RIGHT + ? right + : gradientDirection == Direction.LEFT + ? left + : left), + (int) (gradientDirection == Direction.UP + ? bottom + : gradientDirection == Direction.DOWN + ? top + : top), + (int) (gradientDirection == Direction.RIGHT + ? left + : gradientDirection == Direction.LEFT + ? right + : left), + (int) (gradientDirection == Direction.UP + ? top + : gradientDirection == Direction.DOWN + ? bottom + : top), + mGradientColors, + mGradientPositions, + android.graphics.Shader.TileMode.MIRROR); + + paint.setShader(gradient); + + c.drawRect(left, top, right, bottom, paint); + } + break; + + case DRAWABLE: + { + if (mDrawable == null) return; + + mDrawable.setBounds((int) left, (int) top, (int) right, (int) bottom); + mDrawable.draw(c); + } + break; + } + } + + public void fillPath(Canvas c, Path path, Paint paint, + @Nullable RectF clipRect) + { + switch (mType) + { + case EMPTY: + return; + + case COLOR: + { + if (mFinalColor == null) return; + + if (clipRect != null && isClipPathSupported()) + { + int save = c.save(); + + c.clipPath(path); + c.drawColor(mFinalColor); + + c.restoreToCount(save); + } + else + { + // save + Paint.Style previous = paint.getStyle(); + int previousColor = paint.getColor(); + + // set + paint.setStyle(Paint.Style.FILL); + paint.setColor(mFinalColor); + + c.drawPath(path, paint); + + // restore + paint.setColor(previousColor); + paint.setStyle(previous); + } + } + break; + + case LINEAR_GRADIENT: + { + if (mGradientColors == null) return; + + LinearGradient gradient = new LinearGradient( + 0, + 0, + c.getWidth(), + c.getHeight(), + mGradientColors, + mGradientPositions, + android.graphics.Shader.TileMode.MIRROR); + + paint.setShader(gradient); + + c.drawPath(path, paint); + } + break; + + case DRAWABLE: + { + if (mDrawable == null) return; + + ensureClipPathSupported(); + + int save = c.save(); + c.clipPath(path); + + mDrawable.setBounds( + clipRect == null ? 0 : (int) clipRect.left, + clipRect == null ? 0 : (int) clipRect.top, + clipRect == null ? c.getWidth() : (int) clipRect.right, + clipRect == null ? c.getHeight() : (int) clipRect.bottom); + mDrawable.draw(c); + + c.restoreToCount(save); + } + break; + } + } + + private boolean isClipPathSupported() + { + return Utils.getSDKInt() >= 18; + } + + private void ensureClipPathSupported() + { + if (Utils.getSDKInt() < 18) + { + throw new RuntimeException("Fill-drawables not (yet) supported below API level 18, " + + "this code was run on API level " + Utils.getSDKInt() + "."); + } + } +} diff --git a/MPChartLib/src/main/java/com/github/mikephil/charting/utils/HorizontalViewPortHandler.java b/MPChartLib/src/main/java/com/github/mikephil/charting/utils/HorizontalViewPortHandler.java new file mode 100644 index 00000000..5a415b04 --- /dev/null +++ b/MPChartLib/src/main/java/com/github/mikephil/charting/utils/HorizontalViewPortHandler.java @@ -0,0 +1,29 @@ + +package com.github.mikephil.charting.utils; + +/** + * ViewPortHandler for HorizontalBarChart. + */ +public class HorizontalViewPortHandler extends ViewPortHandler { + + +// @Override +// public void setMinimumScaleX(float xScale) { +// setMinimumScaleY(xScale); +// } +// +// @Override +// public void setMinimumScaleY(float yScale) { +// setMinimumScaleX(yScale); +// } +// +// @Override +// public void setMinMaxScaleX(float minScaleX, float maxScaleX) { +// setMinMaxScaleY(minScaleX, maxScaleX); +// } +// +// @Override +// public void setMinMaxScaleY(float minScaleY, float maxScaleY) { +// setMinMaxScaleX(minScaleY, maxScaleY); +// } +} diff --git a/MPChartLib/src/main/java/com/github/mikephil/charting/utils/MPPointD.java b/MPChartLib/src/main/java/com/github/mikephil/charting/utils/MPPointD.java new file mode 100644 index 00000000..f6220a72 --- /dev/null +++ b/MPChartLib/src/main/java/com/github/mikephil/charting/utils/MPPointD.java @@ -0,0 +1,53 @@ + +package com.github.mikephil.charting.utils; + +import java.util.List; + +/** + * Point encapsulating two double values. + * + * @author Philipp Jahoda + */ +public class MPPointD extends ObjectPool.Poolable { + + private static ObjectPool<MPPointD> pool; + + static { + pool = ObjectPool.create(64, new MPPointD(0,0)); + pool.setReplenishPercentage(0.5f); + } + + public static MPPointD getInstance(double x, double y){ + MPPointD result = pool.get(); + result.x = x; + result.y = y; + return result; + } + + public static void recycleInstance(MPPointD instance){ + pool.recycle(instance); + } + + public static void recycleInstances(List<MPPointD> instances){ + pool.recycle(instances); + } + + public double x; + public double y; + + protected ObjectPool.Poolable instantiate(){ + return new MPPointD(0,0); + } + + private MPPointD(double x, double y) { + this.x = x; + this.y = y; + } + + /** + * returns a string representation of the object + */ + public String toString() { + return "MPPointD, x: " + x + ", y: " + y; + } +}
\ No newline at end of file diff --git a/MPChartLib/src/main/java/com/github/mikephil/charting/utils/MPPointF.java b/MPChartLib/src/main/java/com/github/mikephil/charting/utils/MPPointF.java new file mode 100644 index 00000000..fb5a00f5 --- /dev/null +++ b/MPChartLib/src/main/java/com/github/mikephil/charting/utils/MPPointF.java @@ -0,0 +1,99 @@ +package com.github.mikephil.charting.utils; + +import android.os.Parcel; +import android.os.Parcelable; + +import java.util.List; + +/** + * Created by Tony Patino on 6/24/16. + */ +public class MPPointF extends ObjectPool.Poolable { + + private static ObjectPool<MPPointF> pool; + + public float x; + public float y; + + static { + pool = ObjectPool.create(32, new MPPointF(0,0)); + pool.setReplenishPercentage(0.5f); + } + + public MPPointF() { + } + + public MPPointF(float x, float y) { + this.x = x; + this.y = y; + } + + public static MPPointF getInstance(float x, float y) { + MPPointF result = pool.get(); + result.x = x; + result.y = y; + return result; + } + + public static MPPointF getInstance() { + return pool.get(); + } + + public static MPPointF getInstance(MPPointF copy) { + MPPointF result = pool.get(); + result.x = copy.x; + result.y = copy.y; + return result; + } + + public static void recycleInstance(MPPointF instance){ + pool.recycle(instance); + } + + public static void recycleInstances(List<MPPointF> instances){ + pool.recycle(instances); + } + + public static final Parcelable.Creator<MPPointF> CREATOR = new Parcelable.Creator<MPPointF>() { + /** + * Return a new point from the data in the specified parcel. + */ + public MPPointF createFromParcel(Parcel in) { + MPPointF r = new MPPointF(0,0); + r.my_readFromParcel(in); + return r; + } + + /** + * Return an array of rectangles of the specified size. + */ + public MPPointF[] newArray(int size) { + return new MPPointF[size]; + } + }; + + /** + * Set the point's coordinates from the data stored in the specified + * parcel. To write a point to a parcel, call writeToParcel(). + * Provided to support older Android devices. + * + * @param in The parcel to read the point's coordinates from + */ + public void my_readFromParcel(Parcel in) { + x = in.readFloat(); + y = in.readFloat(); + } + + public float getX(){ + return this.x; + } + + public float getY(){ + return this.y; + } + + @Override + protected ObjectPool.Poolable instantiate() { + return new MPPointF(0,0); + } +}
\ No newline at end of file diff --git a/MPChartLib/src/main/java/com/github/mikephil/charting/utils/ObjectPool.java b/MPChartLib/src/main/java/com/github/mikephil/charting/utils/ObjectPool.java new file mode 100644 index 00000000..d1d54371 --- /dev/null +++ b/MPChartLib/src/main/java/com/github/mikephil/charting/utils/ObjectPool.java @@ -0,0 +1,218 @@ +package com.github.mikephil.charting.utils; + +import java.util.List; + +/** + * An object pool for recycling of object instances extending Poolable. + * + * + * Cost/Benefit : + * Cost - The pool can only contain objects extending Poolable. + * Benefit - The pool can very quickly determine if an object is elligable for storage without iteration. + * Benefit - The pool can also know if an instance of Poolable is already stored in a different pool instance. + * Benefit - The pool can grow as needed, if it is empty + * Cost - However, refilling the pool when it is empty might incur a time cost with sufficiently large capacity. Set the replenishPercentage to a lower number if this is a concern. + * + * Created by Tony Patino on 6/20/16. + */ +public class ObjectPool<T extends ObjectPool.Poolable> { + + private static int ids = 0; + + private int poolId; + private int desiredCapacity; + private Object[] objects; + private int objectsPointer; + private T modelObject; + private float replenishPercentage; + + + /** + * Returns the id of the given pool instance. + * + * @return an integer ID belonging to this pool instance. + */ + public int getPoolId(){ + return poolId; + } + + /** + * Returns an ObjectPool instance, of a given starting capacity, that recycles instances of a given Poolable object. + * + * @param withCapacity A positive integer value. + * @param object An instance of the object that the pool should recycle. + * @return + */ + public static synchronized ObjectPool create(int withCapacity, Poolable object){ + ObjectPool result = new ObjectPool(withCapacity, object); + result.poolId = ids; + ids++; + + return result; + } + + private ObjectPool(int withCapacity, T object){ + if(withCapacity <= 0){ + throw new IllegalArgumentException("Object Pool must be instantiated with a capacity greater than 0!"); + } + this.desiredCapacity = withCapacity; + this.objects = new Object[this.desiredCapacity]; + this.objectsPointer = 0; + this.modelObject = object; + this.replenishPercentage = 1.0f; + this.refillPool(); + } + + /** + * Set the percentage of the pool to replenish on empty. Valid values are between + * 0.00f and 1.00f + * + * @param percentage a value between 0 and 1, representing the percentage of the pool to replenish. + */ + public void setReplenishPercentage(float percentage){ + float p = percentage; + if(p > 1){ + p = 1; + } + else if(p < 0f){ + p = 0f; + } + this.replenishPercentage = p; + } + + public float getReplenishPercentage(){ + return replenishPercentage; + } + + private void refillPool(){ + this.refillPool(this.replenishPercentage); + } + + private void refillPool(float percentage){ + int portionOfCapacity = (int) (desiredCapacity * percentage); + + if(portionOfCapacity < 1){ + portionOfCapacity = 1; + }else if(portionOfCapacity > desiredCapacity){ + portionOfCapacity = desiredCapacity; + } + + for(int i = 0 ; i < portionOfCapacity ; i++){ + this.objects[i] = modelObject.instantiate(); + } + objectsPointer = portionOfCapacity - 1; + } + + /** + * Returns an instance of Poolable. If get() is called with an empty pool, the pool will be + * replenished. If the pool capacity is sufficiently large, this could come at a performance + * cost. + * + * @return An instance of Poolable object T + */ + public synchronized T get(){ + + if(this.objectsPointer == -1 && this.replenishPercentage > 0.0f){ + this.refillPool(); + } + + T result = (T)objects[this.objectsPointer]; + result.currentOwnerId = Poolable.NO_OWNER; + this.objectsPointer--; + + return result; + } + + /** + * Recycle an instance of Poolable that this pool is capable of generating. + * The T instance passed must not already exist inside this or any other ObjectPool instance. + * + * @param object An object of type T to recycle + */ + public synchronized void recycle(T object){ + if(object.currentOwnerId != Poolable.NO_OWNER){ + if(object.currentOwnerId == this.poolId){ + throw new IllegalArgumentException("The object passed is already stored in this pool!"); + }else { + throw new IllegalArgumentException("The object to recycle already belongs to poolId " + object.currentOwnerId + ". Object cannot belong to two different pool instances simultaneously!"); + } + } + + this.objectsPointer++; + if(this.objectsPointer >= objects.length){ + this.resizePool(); + } + + object.currentOwnerId = this.poolId; + objects[this.objectsPointer] = object; + + } + + /** + * Recycle a List of Poolables that this pool is capable of generating. + * The T instances passed must not already exist inside this or any other ObjectPool instance. + * + * @param objects A list of objects of type T to recycle + */ + public synchronized void recycle(List<T> objects){ + while(objects.size() + this.objectsPointer + 1 > this.desiredCapacity){ + this.resizePool(); + } + final int objectsListSize = objects.size(); + + // Not relying on recycle(T object) because this is more performant. + for(int i = 0 ; i < objectsListSize ; i++){ + T object = objects.get(i); + if(object.currentOwnerId != Poolable.NO_OWNER){ + if(object.currentOwnerId == this.poolId){ + throw new IllegalArgumentException("The object passed is already stored in this pool!"); + }else { + throw new IllegalArgumentException("The object to recycle already belongs to poolId " + object.currentOwnerId + ". Object cannot belong to two different pool instances simultaneously!"); + } + } + object.currentOwnerId = this.poolId; + this.objects[this.objectsPointer + 1 + i] = object; + } + this.objectsPointer += objectsListSize; + } + + private void resizePool() { + final int oldCapacity = this.desiredCapacity; + this.desiredCapacity *= 2; + Object[] temp = new Object[this.desiredCapacity]; + for(int i = 0 ; i < oldCapacity ; i++){ + temp[i] = this.objects[i]; + } + this.objects = temp; + } + + /** + * Returns the capacity of this object pool. Note : The pool will automatically resize + * to contain additional objects if the user tries to add more objects than the pool's + * capacity allows, but this comes at a performance cost. + * + * @return The capacity of the pool. + */ + public int getPoolCapacity(){ + return this.objects.length; + } + + /** + * Returns the number of objects remaining in the pool, for diagnostic purposes. + * + * @return The number of objects remaining in the pool. + */ + public int getPoolCount(){ + return this.objectsPointer + 1; + } + + + public static abstract class Poolable{ + + public static int NO_OWNER = -1; + int currentOwnerId = NO_OWNER; + + protected abstract Poolable instantiate(); + + } +}
\ No newline at end of file diff --git a/MPChartLib/src/main/java/com/github/mikephil/charting/utils/Transformer.java b/MPChartLib/src/main/java/com/github/mikephil/charting/utils/Transformer.java new file mode 100644 index 00000000..0496bd06 --- /dev/null +++ b/MPChartLib/src/main/java/com/github/mikephil/charting/utils/Transformer.java @@ -0,0 +1,459 @@ + +package com.github.mikephil.charting.utils; + +import android.graphics.Matrix; +import android.graphics.Path; +import android.graphics.RectF; + +import com.github.mikephil.charting.data.CandleEntry; +import com.github.mikephil.charting.data.Entry; +import com.github.mikephil.charting.interfaces.datasets.IBubbleDataSet; +import com.github.mikephil.charting.interfaces.datasets.ICandleDataSet; +import com.github.mikephil.charting.interfaces.datasets.ILineDataSet; +import com.github.mikephil.charting.interfaces.datasets.IScatterDataSet; + +import java.util.List; + +/** + * Transformer class that contains all matrices and is responsible for + * transforming values into pixels on the screen and backwards. + * + * @author Philipp Jahoda + */ +public class Transformer { + + /** + * matrix to map the values to the screen pixels + */ + protected Matrix mMatrixValueToPx = new Matrix(); + + /** + * matrix for handling the different offsets of the chart + */ + protected Matrix mMatrixOffset = new Matrix(); + + protected ViewPortHandler mViewPortHandler; + + public Transformer(ViewPortHandler viewPortHandler) { + this.mViewPortHandler = viewPortHandler; + } + + /** + * Prepares the matrix that transforms values to pixels. Calculates the + * scale factors from the charts size and offsets. + * + * @param xChartMin + * @param deltaX + * @param deltaY + * @param yChartMin + */ + public void prepareMatrixValuePx(float xChartMin, float deltaX, float deltaY, float yChartMin) { + + float scaleX = (float) ((mViewPortHandler.contentWidth()) / deltaX); + float scaleY = (float) ((mViewPortHandler.contentHeight()) / deltaY); + + if (Float.isInfinite(scaleX)) { + scaleX = 0; + } + if (Float.isInfinite(scaleY)) { + scaleY = 0; + } + + // setup all matrices + mMatrixValueToPx.reset(); + mMatrixValueToPx.postTranslate(-xChartMin, -yChartMin); + mMatrixValueToPx.postScale(scaleX, -scaleY); + } + + /** + * Prepares the matrix that contains all offsets. + * + * @param inverted + */ + public void prepareMatrixOffset(boolean inverted) { + + mMatrixOffset.reset(); + + // offset.postTranslate(mOffsetLeft, getHeight() - mOffsetBottom); + + if (!inverted) + mMatrixOffset.postTranslate(mViewPortHandler.offsetLeft(), + mViewPortHandler.getChartHeight() - mViewPortHandler.offsetBottom()); + else { + mMatrixOffset + .setTranslate(mViewPortHandler.offsetLeft(), -mViewPortHandler.offsetTop()); + mMatrixOffset.postScale(1.0f, -1.0f); + } + } + + protected float[] valuePointsForGenerateTransformedValuesScatter = new float[1]; + + /** + * Transforms an List of Entry into a float array containing the x and + * y values transformed with all matrices for the SCATTERCHART. + * + * @param data + * @return + */ + public float[] generateTransformedValuesScatter(IScatterDataSet data, float phaseX, + float phaseY, int from, int to) { + + final int count = (int) ((to - from) * phaseX + 1) * 2; + + if (valuePointsForGenerateTransformedValuesScatter.length != count) { + valuePointsForGenerateTransformedValuesScatter = new float[count]; + } + float[] valuePoints = valuePointsForGenerateTransformedValuesScatter; + + for (int j = 0; j < count; j += 2) { + + Entry e = data.getEntryForIndex(j / 2 + from); + + if (e != null) { + valuePoints[j] = e.getX(); + valuePoints[j + 1] = e.getY() * phaseY; + } else { + valuePoints[j] = 0; + valuePoints[j + 1] = 0; + } + } + + getValueToPixelMatrix().mapPoints(valuePoints); + + return valuePoints; + } + + protected float[] valuePointsForGenerateTransformedValuesBubble = new float[1]; + + /** + * Transforms an List of Entry into a float array containing the x and + * y values transformed with all matrices for the BUBBLECHART. + * + * @param data + * @return + */ + public float[] generateTransformedValuesBubble(IBubbleDataSet data, float phaseY, int from, int to) { + + final int count = (to - from + 1) * 2; // (int) Math.ceil((to - from) * phaseX) * 2; + + if (valuePointsForGenerateTransformedValuesBubble.length != count) { + valuePointsForGenerateTransformedValuesBubble = new float[count]; + } + float[] valuePoints = valuePointsForGenerateTransformedValuesBubble; + + for (int j = 0; j < count; j += 2) { + + Entry e = data.getEntryForIndex(j / 2 + from); + + if (e != null) { + valuePoints[j] = e.getX(); + valuePoints[j + 1] = e.getY() * phaseY; + } else { + valuePoints[j] = 0; + valuePoints[j + 1] = 0; + } + } + + getValueToPixelMatrix().mapPoints(valuePoints); + + return valuePoints; + } + + protected float[] valuePointsForGenerateTransformedValuesLine = new float[1]; + + /** + * Transforms an List of Entry into a float array containing the x and + * y values transformed with all matrices for the LINECHART. + * + * @param data + * @return + */ + public float[] generateTransformedValuesLine(ILineDataSet data, + float phaseX, float phaseY, + int min, int max) { + + final int count = ((int) ((max - min) * phaseX) + 1) * 2; + + if (valuePointsForGenerateTransformedValuesLine.length != count) { + valuePointsForGenerateTransformedValuesLine = new float[count]; + } + float[] valuePoints = valuePointsForGenerateTransformedValuesLine; + + for (int j = 0; j < count; j += 2) { + + Entry e = data.getEntryForIndex(j / 2 + min); + + if (e != null) { + valuePoints[j] = e.getX(); + valuePoints[j + 1] = e.getY() * phaseY; + } else { + valuePoints[j] = 0; + valuePoints[j + 1] = 0; + } + } + + getValueToPixelMatrix().mapPoints(valuePoints); + + return valuePoints; + } + + protected float[] valuePointsForGenerateTransformedValuesCandle = new float[1]; + + /** + * Transforms an List of Entry into a float array containing the x and + * y values transformed with all matrices for the CANDLESTICKCHART. + * + * @param data + * @return + */ + public float[] generateTransformedValuesCandle(ICandleDataSet data, + float phaseX, float phaseY, int from, int to) { + + final int count = (int) ((to - from) * phaseX + 1) * 2; + + if (valuePointsForGenerateTransformedValuesCandle.length != count) { + valuePointsForGenerateTransformedValuesCandle = new float[count]; + } + float[] valuePoints = valuePointsForGenerateTransformedValuesCandle; + + for (int j = 0; j < count; j += 2) { + + CandleEntry e = data.getEntryForIndex(j / 2 + from); + + if (e != null) { + valuePoints[j] = e.getX(); + valuePoints[j + 1] = e.getHigh() * phaseY; + } else { + valuePoints[j] = 0; + valuePoints[j + 1] = 0; + } + } + + getValueToPixelMatrix().mapPoints(valuePoints); + + return valuePoints; + } + + /** + * transform a path with all the given matrices VERY IMPORTANT: keep order + * to value-touch-offset + * + * @param path + */ + public void pathValueToPixel(Path path) { + + path.transform(mMatrixValueToPx); + path.transform(mViewPortHandler.getMatrixTouch()); + path.transform(mMatrixOffset); + } + + /** + * Transforms multiple paths will all matrices. + * + * @param paths + */ + public void pathValuesToPixel(List<Path> paths) { + + for (int i = 0; i < paths.size(); i++) { + pathValueToPixel(paths.get(i)); + } + } + + /** + * Transform an array of points with all matrices. VERY IMPORTANT: Keep + * matrix order "value-touch-offset" when transforming. + * + * @param pts + */ + public void pointValuesToPixel(float[] pts) { + + mMatrixValueToPx.mapPoints(pts); + mViewPortHandler.getMatrixTouch().mapPoints(pts); + mMatrixOffset.mapPoints(pts); + } + + /** + * Transform a rectangle with all matrices. + * + * @param r + */ + public void rectValueToPixel(RectF r) { + + mMatrixValueToPx.mapRect(r); + mViewPortHandler.getMatrixTouch().mapRect(r); + mMatrixOffset.mapRect(r); + } + + /** + * Transform a rectangle with all matrices with potential animation phases. + * + * @param r + * @param phaseY + */ + public void rectToPixelPhase(RectF r, float phaseY) { + + // multiply the height of the rect with the phase + r.top *= phaseY; + r.bottom *= phaseY; + + mMatrixValueToPx.mapRect(r); + mViewPortHandler.getMatrixTouch().mapRect(r); + mMatrixOffset.mapRect(r); + } + + public void rectToPixelPhaseHorizontal(RectF r, float phaseY) { + + // multiply the height of the rect with the phase + r.left *= phaseY; + r.right *= phaseY; + + mMatrixValueToPx.mapRect(r); + mViewPortHandler.getMatrixTouch().mapRect(r); + mMatrixOffset.mapRect(r); + } + + /** + * Transform a rectangle with all matrices with potential animation phases. + * + * @param r + */ + public void rectValueToPixelHorizontal(RectF r) { + + mMatrixValueToPx.mapRect(r); + mViewPortHandler.getMatrixTouch().mapRect(r); + mMatrixOffset.mapRect(r); + } + + /** + * Transform a rectangle with all matrices with potential animation phases. + * + * @param r + * @param phaseY + */ + public void rectValueToPixelHorizontal(RectF r, float phaseY) { + + // multiply the height of the rect with the phase + r.left *= phaseY; + r.right *= phaseY; + + mMatrixValueToPx.mapRect(r); + mViewPortHandler.getMatrixTouch().mapRect(r); + mMatrixOffset.mapRect(r); + } + + /** + * transforms multiple rects with all matrices + * + * @param rects + */ + public void rectValuesToPixel(List<RectF> rects) { + + Matrix m = getValueToPixelMatrix(); + + for (int i = 0; i < rects.size(); i++) + m.mapRect(rects.get(i)); + } + + protected Matrix mPixelToValueMatrixBuffer = new Matrix(); + + /** + * Transforms the given array of touch positions (pixels) (x, y, x, y, ...) + * into values on the chart. + * + * @param pixels + */ + public void pixelsToValue(float[] pixels) { + + Matrix tmp = mPixelToValueMatrixBuffer; + tmp.reset(); + + // invert all matrixes to convert back to the original value + mMatrixOffset.invert(tmp); + tmp.mapPoints(pixels); + + mViewPortHandler.getMatrixTouch().invert(tmp); + tmp.mapPoints(pixels); + + mMatrixValueToPx.invert(tmp); + tmp.mapPoints(pixels); + } + + /** + * buffer for performance + */ + float[] ptsBuffer = new float[2]; + + /** + * Returns a recyclable MPPointD instance. + * returns the x and y values in the chart at the given touch point + * (encapsulated in a MPPointD). This method transforms pixel coordinates to + * coordinates / values in the chart. This is the opposite method to + * getPixelForValues(...). + * + * @param x + * @param y + * @return + */ + public MPPointD getValuesByTouchPoint(float x, float y) { + + MPPointD result = MPPointD.getInstance(0, 0); + getValuesByTouchPoint(x, y, result); + return result; + } + + public void getValuesByTouchPoint(float x, float y, MPPointD outputPoint) { + + ptsBuffer[0] = x; + ptsBuffer[1] = y; + + pixelsToValue(ptsBuffer); + + outputPoint.x = ptsBuffer[0]; + outputPoint.y = ptsBuffer[1]; + } + + /** + * Returns a recyclable MPPointD instance. + * Returns the x and y coordinates (pixels) for a given x and y value in the chart. + * + * @param x + * @param y + * @return + */ + public MPPointD getPixelForValues(float x, float y) { + + ptsBuffer[0] = x; + ptsBuffer[1] = y; + + pointValuesToPixel(ptsBuffer); + + double xPx = ptsBuffer[0]; + double yPx = ptsBuffer[1]; + + return MPPointD.getInstance(xPx, yPx); + } + + public Matrix getValueMatrix() { + return mMatrixValueToPx; + } + + public Matrix getOffsetMatrix() { + return mMatrixOffset; + } + + private Matrix mMBuffer1 = new Matrix(); + + public Matrix getValueToPixelMatrix() { + mMBuffer1.set(mMatrixValueToPx); + mMBuffer1.postConcat(mViewPortHandler.mMatrixTouch); + mMBuffer1.postConcat(mMatrixOffset); + return mMBuffer1; + } + + private Matrix mMBuffer2 = new Matrix(); + + public Matrix getPixelToValueMatrix() { + getValueToPixelMatrix().invert(mMBuffer2); + return mMBuffer2; + } +} diff --git a/MPChartLib/src/main/java/com/github/mikephil/charting/utils/TransformerHorizontalBarChart.java b/MPChartLib/src/main/java/com/github/mikephil/charting/utils/TransformerHorizontalBarChart.java new file mode 100644 index 00000000..05fa82ae --- /dev/null +++ b/MPChartLib/src/main/java/com/github/mikephil/charting/utils/TransformerHorizontalBarChart.java @@ -0,0 +1,44 @@ + +package com.github.mikephil.charting.utils; + +/** + * Transformer class for the HorizontalBarChart. + * + * @author Philipp Jahoda + */ +public class TransformerHorizontalBarChart extends Transformer { + + public TransformerHorizontalBarChart(ViewPortHandler viewPortHandler) { + super(viewPortHandler); + } + + /** + * Prepares the matrix that contains all offsets. + * + * @param inverted + */ + public void prepareMatrixOffset(boolean inverted) { + + mMatrixOffset.reset(); + + // offset.postTranslate(mOffsetLeft, getHeight() - mOffsetBottom); + + if (!inverted) + mMatrixOffset.postTranslate(mViewPortHandler.offsetLeft(), + mViewPortHandler.getChartHeight() - mViewPortHandler.offsetBottom()); + else { + mMatrixOffset + .setTranslate( + -(mViewPortHandler.getChartWidth() - mViewPortHandler.offsetRight()), + mViewPortHandler.getChartHeight() - mViewPortHandler.offsetBottom()); + mMatrixOffset.postScale(-1.0f, 1.0f); + } + + // mMatrixOffset.set(offset); + + // mMatrixOffset.reset(); + // + // mMatrixOffset.postTranslate(mOffsetLeft, getHeight() - + // mOffsetBottom); + } +} diff --git a/MPChartLib/src/main/java/com/github/mikephil/charting/utils/Utils.java b/MPChartLib/src/main/java/com/github/mikephil/charting/utils/Utils.java new file mode 100644 index 00000000..c3026739 --- /dev/null +++ b/MPChartLib/src/main/java/com/github/mikephil/charting/utils/Utils.java @@ -0,0 +1,779 @@ + +package com.github.mikephil.charting.utils; + +import android.annotation.SuppressLint; +import android.content.Context; +import android.content.res.Resources; +import android.graphics.Canvas; +import android.graphics.Paint; +import android.graphics.Rect; +import android.graphics.drawable.BitmapDrawable; +import android.graphics.drawable.Drawable; +import android.os.Build; +import android.text.Layout; +import android.text.StaticLayout; +import android.text.TextPaint; +import android.util.DisplayMetrics; +import android.util.Log; +import android.util.SizeF; +import android.view.MotionEvent; +import android.view.VelocityTracker; +import android.view.View; +import android.view.ViewConfiguration; + +import com.github.mikephil.charting.formatter.DefaultValueFormatter; +import com.github.mikephil.charting.formatter.IValueFormatter; + +import java.util.List; + +/** + * Utilities class that has some helper methods. Needs to be initialized by + * calling Utils.init(...) before usage. Inside the Chart.init() method, this is + * done, if the Utils are used before that, Utils.init(...) needs to be called + * manually. + * + * @author Philipp Jahoda + */ +public abstract class Utils { + + private static DisplayMetrics mMetrics; + private static int mMinimumFlingVelocity = 50; + private static int mMaximumFlingVelocity = 8000; + public final static double DEG2RAD = (Math.PI / 180.0); + public final static float FDEG2RAD = ((float) Math.PI / 180.f); + + @SuppressWarnings("unused") + public final static double DOUBLE_EPSILON = Double.longBitsToDouble(1); + + @SuppressWarnings("unused") + public final static float FLOAT_EPSILON = Float.intBitsToFloat(1); + + /** + * initialize method, called inside the Chart.init() method. + * + * @param context + */ + @SuppressWarnings("deprecation") + public static void init(Context context) { + + if (context == null) { + // noinspection deprecation + mMinimumFlingVelocity = ViewConfiguration.getMinimumFlingVelocity(); + // noinspection deprecation + mMaximumFlingVelocity = ViewConfiguration.getMaximumFlingVelocity(); + + Log.e("MPChartLib-Utils" + , "Utils.init(...) PROVIDED CONTEXT OBJECT IS NULL"); + + } else { + ViewConfiguration viewConfiguration = ViewConfiguration.get(context); + mMinimumFlingVelocity = viewConfiguration.getScaledMinimumFlingVelocity(); + mMaximumFlingVelocity = viewConfiguration.getScaledMaximumFlingVelocity(); + + Resources res = context.getResources(); + mMetrics = res.getDisplayMetrics(); + } + } + + /** + * initialize method, called inside the Chart.init() method. backwards + * compatibility - to not break existing code + * + * @param res + */ + @Deprecated + public static void init(Resources res) { + + mMetrics = res.getDisplayMetrics(); + + // noinspection deprecation + mMinimumFlingVelocity = ViewConfiguration.getMinimumFlingVelocity(); + // noinspection deprecation + mMaximumFlingVelocity = ViewConfiguration.getMaximumFlingVelocity(); + } + + /** + * This method converts dp unit to equivalent pixels, depending on device + * density. NEEDS UTILS TO BE INITIALIZED BEFORE USAGE. + * + * @param dp A value in dp (density independent pixels) unit. Which we need + * to convert into pixels + * @return A float value to represent px equivalent to dp depending on + * device density + */ + public static float convertDpToPixel(float dp) { + + if (mMetrics == null) { + + Log.e("MPChartLib-Utils", + "Utils NOT INITIALIZED. You need to call Utils.init(...) at least once before" + + " calling Utils.convertDpToPixel(...). Otherwise conversion does not " + + "take place."); + return dp; + } + + return dp * mMetrics.density; + } + + /** + * This method converts device specific pixels to density independent + * pixels. NEEDS UTILS TO BE INITIALIZED BEFORE USAGE. + * + * @param px A value in px (pixels) unit. Which we need to convert into db + * @return A float value to represent dp equivalent to px value + */ + public static float convertPixelsToDp(float px) { + + if (mMetrics == null) { + + Log.e("MPChartLib-Utils", + "Utils NOT INITIALIZED. You need to call Utils.init(...) at least once before" + + " calling Utils.convertPixelsToDp(...). Otherwise conversion does not" + + " take place."); + return px; + } + + return px / mMetrics.density; + } + + /** + * calculates the approximate width of a text, depending on a demo text + * avoid repeated calls (e.g. inside drawing methods) + * + * @param paint + * @param demoText + * @return + */ + public static int calcTextWidth(Paint paint, String demoText) { + return (int) paint.measureText(demoText); + } + + private static Rect mCalcTextHeightRect = new Rect(); + /** + * calculates the approximate height of a text, depending on a demo text + * avoid repeated calls (e.g. inside drawing methods) + * + * @param paint + * @param demoText + * @return + */ + public static int calcTextHeight(Paint paint, String demoText) { + + Rect r = mCalcTextHeightRect; + r.set(0,0,0,0); + paint.getTextBounds(demoText, 0, demoText.length(), r); + return r.height(); + } + + private static Paint.FontMetrics mFontMetrics = new Paint.FontMetrics(); + + public static float getLineHeight(Paint paint) { + return getLineHeight(paint, mFontMetrics); + } + + public static float getLineHeight(Paint paint, Paint.FontMetrics fontMetrics){ + paint.getFontMetrics(fontMetrics); + return fontMetrics.descent - fontMetrics.ascent; + } + + public static float getLineSpacing(Paint paint) { + return getLineSpacing(paint, mFontMetrics); + } + + public static float getLineSpacing(Paint paint, Paint.FontMetrics fontMetrics){ + paint.getFontMetrics(fontMetrics); + return fontMetrics.ascent - fontMetrics.top + fontMetrics.bottom; + } + + /** + * Returns a recyclable FSize instance. + * calculates the approximate size of a text, depending on a demo text + * avoid repeated calls (e.g. inside drawing methods) + * + * @param paint + * @param demoText + * @return A Recyclable FSize instance + */ + public static FSize calcTextSize(Paint paint, String demoText) { + + FSize result = FSize.getInstance(0,0); + calcTextSize(paint, demoText, result); + return result; + } + + private static Rect mCalcTextSizeRect = new Rect(); + /** + * calculates the approximate size of a text, depending on a demo text + * avoid repeated calls (e.g. inside drawing methods) + * + * @param paint + * @param demoText + * @param outputFSize An output variable, modified by the function. + */ + public static void calcTextSize(Paint paint, String demoText, FSize outputFSize) { + + Rect r = mCalcTextSizeRect; + r.set(0,0,0,0); + paint.getTextBounds(demoText, 0, demoText.length(), r); + outputFSize.width = r.width(); + outputFSize.height = r.height(); + + } + + + /** + * Math.pow(...) is very expensive, so avoid calling it and create it + * yourself. + */ + private static final int POW_10[] = { + 1, 10, 100, 1000, 10000, 100000, 1000000, 10000000, 100000000, 1000000000 + }; + + private static IValueFormatter mDefaultValueFormatter = generateDefaultValueFormatter(); + + private static IValueFormatter generateDefaultValueFormatter() { + final DefaultValueFormatter formatter = new DefaultValueFormatter(1); + return formatter; + } + + /// - returns: The default value formatter used for all chart components that needs a default + public static IValueFormatter getDefaultValueFormatter() + { + return mDefaultValueFormatter; + } + + /** + * Formats the given number to the given number of decimals, and returns the + * number as a string, maximum 35 characters. If thousands are separated, the separating + * character is a dot ("."). + * + * @param number + * @param digitCount + * @param separateThousands set this to true to separate thousands values + * @return + */ + public static String formatNumber(float number, int digitCount, boolean separateThousands) { + return formatNumber(number, digitCount, separateThousands, '.'); + } + + /** + * Formats the given number to the given number of decimals, and returns the + * number as a string, maximum 35 characters. + * + * @param number + * @param digitCount + * @param separateThousands set this to true to separate thousands values + * @param separateChar a caracter to be paced between the "thousands" + * @return + */ + public static String formatNumber(float number, int digitCount, boolean separateThousands, + char separateChar) { + + char[] out = new char[35]; + + boolean neg = false; + if (number == 0) { + return "0"; + } + + boolean zero = false; + if (number < 1 && number > -1) { + zero = true; + } + + if (number < 0) { + neg = true; + number = -number; + } + + if (digitCount > POW_10.length) { + digitCount = POW_10.length - 1; + } + + number *= POW_10[digitCount]; + long lval = Math.round(number); + int ind = out.length - 1; + int charCount = 0; + boolean decimalPointAdded = false; + + while (lval != 0 || charCount < (digitCount + 1)) { + int digit = (int) (lval % 10); + lval = lval / 10; + out[ind--] = (char) (digit + '0'); + charCount++; + + // add decimal point + if (charCount == digitCount) { + out[ind--] = ','; + charCount++; + decimalPointAdded = true; + + // add thousand separators + } else if (separateThousands && lval != 0 && charCount > digitCount) { + + if (decimalPointAdded) { + + if ((charCount - digitCount) % 4 == 0) { + out[ind--] = separateChar; + charCount++; + } + + } else { + + if ((charCount - digitCount) % 4 == 3) { + out[ind--] = separateChar; + charCount++; + } + } + } + } + + // if number around zero (between 1 and -1) + if (zero) { + out[ind--] = '0'; + charCount += 1; + } + + // if the number is negative + if (neg) { + out[ind--] = '-'; + charCount += 1; + } + + int start = out.length - charCount; + + // use this instead of "new String(...)" because of issue < Android 4.0 + return String.valueOf(out, start, out.length - start); + } + + /** + * rounds the given number to the next significant number + * + * @param number + * @return + */ + public static float roundToNextSignificant(double number) { + if (Double.isInfinite(number) || + Double.isNaN(number) || + number == 0.0) + return 0; + + final float d = (float) Math.ceil((float) Math.log10(number < 0 ? -number : number)); + final int pw = 1 - (int) d; + final float magnitude = (float) Math.pow(10, pw); + final long shifted = Math.round(number * magnitude); + return shifted / magnitude; + } + + /** + * Returns the appropriate number of decimals to be used for the provided + * number. + * + * @param number + * @return + */ + public static int getDecimals(float number) { + + float i = roundToNextSignificant(number); + + if (Float.isInfinite(i)) + return 0; + + return (int) Math.ceil(-Math.log10(i)) + 2; + } + + /** + * Converts the provided Integer List to an int array. + * + * @param integers + * @return + */ + public static int[] convertIntegers(List<Integer> integers) { + + int[] ret = new int[integers.size()]; + + copyIntegers(integers, ret); + + return ret; + } + + public static void copyIntegers(List<Integer> from, int[] to){ + int count = to.length < from.size() ? to.length : from.size(); + for(int i = 0 ; i < count ; i++){ + to[i] = from.get(i); + } + } + + /** + * Converts the provided String List to a String array. + * + * @param strings + * @return + */ + public static String[] convertStrings(List<String> strings) { + + String[] ret = new String[strings.size()]; + + for (int i = 0; i < ret.length; i++) { + ret[i] = strings.get(i); + } + + return ret; + } + + public static void copyStrings(List<String> from, String[] to){ + int count = to.length < from.size() ? to.length : from.size(); + for(int i = 0 ; i < count ; i++){ + to[i] = from.get(i); + } + } + + /** + * Replacement for the Math.nextUp(...) method that is only available in + * HONEYCOMB and higher. Dat's some seeeeek sheeet. + * + * @param d + * @return + */ + public static double nextUp(double d) { + if (d == Double.POSITIVE_INFINITY) + return d; + else { + d += 0.0d; + return Double.longBitsToDouble(Double.doubleToRawLongBits(d) + + ((d >= 0.0d) ? +1L : -1L)); + } + } + + /** + * Returns a recyclable MPPointF instance. + * Calculates the position around a center point, depending on the distance + * from the center, and the angle of the position around the center. + * + * @param center + * @param dist + * @param angle in degrees, converted to radians internally + * @return + */ + public static MPPointF getPosition(MPPointF center, float dist, float angle) { + + MPPointF p = MPPointF.getInstance(0,0); + getPosition(center, dist, angle, p); + return p; + } + + public static void getPosition(MPPointF center, float dist, float angle, MPPointF outputPoint){ + outputPoint.x = (float) (center.x + dist * Math.cos(Math.toRadians(angle))); + outputPoint.y = (float) (center.y + dist * Math.sin(Math.toRadians(angle))); + } + + public static void velocityTrackerPointerUpCleanUpIfNecessary(MotionEvent ev, + VelocityTracker tracker) { + + // Check the dot product of current velocities. + // If the pointer that left was opposing another velocity vector, clear. + tracker.computeCurrentVelocity(1000, mMaximumFlingVelocity); + final int upIndex = ev.getActionIndex(); + final int id1 = ev.getPointerId(upIndex); + final float x1 = tracker.getXVelocity(id1); + final float y1 = tracker.getYVelocity(id1); + for (int i = 0, count = ev.getPointerCount(); i < count; i++) { + if (i == upIndex) + continue; + + final int id2 = ev.getPointerId(i); + final float x = x1 * tracker.getXVelocity(id2); + final float y = y1 * tracker.getYVelocity(id2); + + final float dot = x + y; + if (dot < 0) { + tracker.clear(); + break; + } + } + } + + /** + * Original method view.postInvalidateOnAnimation() only supportd in API >= + * 16, This is a replica of the code from ViewCompat. + * + * @param view + */ + @SuppressLint("NewApi") + public static void postInvalidateOnAnimation(View view) { + if (Build.VERSION.SDK_INT >= 16) + view.postInvalidateOnAnimation(); + else + view.postInvalidateDelayed(10); + } + + public static int getMinimumFlingVelocity() { + return mMinimumFlingVelocity; + } + + public static int getMaximumFlingVelocity() { + return mMaximumFlingVelocity; + } + + /** + * returns an angle between 0.f < 360.f (not less than zero, less than 360) + */ + public static float getNormalizedAngle(float angle) { + while (angle < 0.f) + angle += 360.f; + + return angle % 360.f; + } + + private static Rect mDrawableBoundsCache = new Rect(); + + public static void drawImage(Canvas canvas, + Drawable drawable, + int x, int y, + int width, int height) { + + MPPointF drawOffset = MPPointF.getInstance(); + drawOffset.x = x - (width / 2); + drawOffset.y = y - (height / 2); + + drawable.copyBounds(mDrawableBoundsCache); + drawable.setBounds( + mDrawableBoundsCache.left, + mDrawableBoundsCache.top, + mDrawableBoundsCache.left + width, + mDrawableBoundsCache.top + width); + + int saveId = canvas.save(); + // translate to the correct position and draw + canvas.translate(drawOffset.x, drawOffset.y); + drawable.draw(canvas); + canvas.restoreToCount(saveId); + } + + private static Rect mDrawTextRectBuffer = new Rect(); + private static Paint.FontMetrics mFontMetricsBuffer = new Paint.FontMetrics(); + + public static void drawXAxisValue(Canvas c, String text, float x, float y, + Paint paint, + MPPointF anchor, float angleDegrees) { + + float drawOffsetX = 0.f; + float drawOffsetY = 0.f; + + final float lineHeight = paint.getFontMetrics(mFontMetricsBuffer); + paint.getTextBounds(text, 0, text.length(), mDrawTextRectBuffer); + + // Android sometimes has pre-padding + drawOffsetX -= mDrawTextRectBuffer.left; + + // Android does not snap the bounds to line boundaries, + // and draws from bottom to top. + // And we want to normalize it. + drawOffsetY += -mFontMetricsBuffer.ascent; + + // To have a consistent point of reference, we always draw left-aligned + Paint.Align originalTextAlign = paint.getTextAlign(); + paint.setTextAlign(Paint.Align.LEFT); + + if (angleDegrees != 0.f) { + + // Move the text drawing rect in a way that it always rotates around its center + drawOffsetX -= mDrawTextRectBuffer.width() * 0.5f; + drawOffsetY -= lineHeight * 0.5f; + + float translateX = x; + float translateY = y; + + // Move the "outer" rect relative to the anchor, assuming its centered + if (anchor.x != 0.5f || anchor.y != 0.5f) { + final FSize rotatedSize = getSizeOfRotatedRectangleByDegrees( + mDrawTextRectBuffer.width(), + lineHeight, + angleDegrees); + + translateX -= rotatedSize.width * (anchor.x - 0.5f); + translateY -= rotatedSize.height * (anchor.y - 0.5f); + FSize.recycleInstance(rotatedSize); + } + + c.save(); + c.translate(translateX, translateY); + c.rotate(angleDegrees); + + c.drawText(text, drawOffsetX, drawOffsetY, paint); + + c.restore(); + } else { + if (anchor.x != 0.f || anchor.y != 0.f) { + + drawOffsetX -= mDrawTextRectBuffer.width() * anchor.x; + drawOffsetY -= lineHeight * anchor.y; + } + + drawOffsetX += x; + drawOffsetY += y; + + c.drawText(text, drawOffsetX, drawOffsetY, paint); + } + + paint.setTextAlign(originalTextAlign); + } + + public static void drawMultilineText(Canvas c, StaticLayout textLayout, + float x, float y, + TextPaint paint, + MPPointF anchor, float angleDegrees) { + + float drawOffsetX = 0.f; + float drawOffsetY = 0.f; + float drawWidth; + float drawHeight; + + final float lineHeight = paint.getFontMetrics(mFontMetricsBuffer); + + drawWidth = textLayout.getWidth(); + drawHeight = textLayout.getLineCount() * lineHeight; + + // Android sometimes has pre-padding + drawOffsetX -= mDrawTextRectBuffer.left; + + // Android does not snap the bounds to line boundaries, + // and draws from bottom to top. + // And we want to normalize it. + drawOffsetY += drawHeight; + + // To have a consistent point of reference, we always draw left-aligned + Paint.Align originalTextAlign = paint.getTextAlign(); + paint.setTextAlign(Paint.Align.LEFT); + + if (angleDegrees != 0.f) { + + // Move the text drawing rect in a way that it always rotates around its center + drawOffsetX -= drawWidth * 0.5f; + drawOffsetY -= drawHeight * 0.5f; + + float translateX = x; + float translateY = y; + + // Move the "outer" rect relative to the anchor, assuming its centered + if (anchor.x != 0.5f || anchor.y != 0.5f) { + final FSize rotatedSize = getSizeOfRotatedRectangleByDegrees( + drawWidth, + drawHeight, + angleDegrees); + + translateX -= rotatedSize.width * (anchor.x - 0.5f); + translateY -= rotatedSize.height * (anchor.y - 0.5f); + FSize.recycleInstance(rotatedSize); + } + + c.save(); + c.translate(translateX, translateY); + c.rotate(angleDegrees); + + c.translate(drawOffsetX, drawOffsetY); + textLayout.draw(c); + + c.restore(); + } else { + if (anchor.x != 0.f || anchor.y != 0.f) { + + drawOffsetX -= drawWidth * anchor.x; + drawOffsetY -= drawHeight * anchor.y; + } + + drawOffsetX += x; + drawOffsetY += y; + + c.save(); + + c.translate(drawOffsetX, drawOffsetY); + textLayout.draw(c); + + c.restore(); + } + + paint.setTextAlign(originalTextAlign); + } + + public static void drawMultilineText(Canvas c, String text, + float x, float y, + TextPaint paint, + FSize constrainedToSize, + MPPointF anchor, float angleDegrees) { + + StaticLayout textLayout = new StaticLayout( + text, 0, text.length(), + paint, + (int) Math.max(Math.ceil(constrainedToSize.width), 1.f), + Layout.Alignment.ALIGN_NORMAL, 1.f, 0.f, false); + + + drawMultilineText(c, textLayout, x, y, paint, anchor, angleDegrees); + } + + /** + * Returns a recyclable FSize instance. + * Represents size of a rotated rectangle by degrees. + * + * @param rectangleSize + * @param degrees + * @return A Recyclable FSize instance + */ + public static FSize getSizeOfRotatedRectangleByDegrees(FSize rectangleSize, float degrees) { + final float radians = degrees * FDEG2RAD; + return getSizeOfRotatedRectangleByRadians(rectangleSize.width, rectangleSize.height, + radians); + } + + /** + * Returns a recyclable FSize instance. + * Represents size of a rotated rectangle by radians. + * + * @param rectangleSize + * @param radians + * @return A Recyclable FSize instance + */ + public static FSize getSizeOfRotatedRectangleByRadians(FSize rectangleSize, float radians) { + return getSizeOfRotatedRectangleByRadians(rectangleSize.width, rectangleSize.height, + radians); + } + + /** + * Returns a recyclable FSize instance. + * Represents size of a rotated rectangle by degrees. + * + * @param rectangleWidth + * @param rectangleHeight + * @param degrees + * @return A Recyclable FSize instance + */ + public static FSize getSizeOfRotatedRectangleByDegrees(float rectangleWidth, float + rectangleHeight, float degrees) { + final float radians = degrees * FDEG2RAD; + return getSizeOfRotatedRectangleByRadians(rectangleWidth, rectangleHeight, radians); + } + + /** + * Returns a recyclable FSize instance. + * Represents size of a rotated rectangle by radians. + * + * @param rectangleWidth + * @param rectangleHeight + * @param radians + * @return A Recyclable FSize instance + */ + public static FSize getSizeOfRotatedRectangleByRadians(float rectangleWidth, float + rectangleHeight, float radians) { + return FSize.getInstance( + Math.abs(rectangleWidth * (float) Math.cos(radians)) + Math.abs(rectangleHeight * + (float) Math.sin(radians)), + Math.abs(rectangleWidth * (float) Math.sin(radians)) + Math.abs(rectangleHeight * + (float) Math.cos(radians)) + ); + } + + public static int getSDKInt() { + return android.os.Build.VERSION.SDK_INT; + } +} diff --git a/MPChartLib/src/main/java/com/github/mikephil/charting/utils/ViewPortHandler.java b/MPChartLib/src/main/java/com/github/mikephil/charting/utils/ViewPortHandler.java new file mode 100644 index 00000000..71b4b9bf --- /dev/null +++ b/MPChartLib/src/main/java/com/github/mikephil/charting/utils/ViewPortHandler.java @@ -0,0 +1,759 @@ + +package com.github.mikephil.charting.utils; + +import android.graphics.Matrix; +import android.graphics.RectF; +import android.view.View; + +/** + * Class that contains information about the charts current viewport settings, including offsets, scale & translation + * levels, ... + * + * @author Philipp Jahoda + */ +public class ViewPortHandler { + + /** + * matrix used for touch events + */ + protected final Matrix mMatrixTouch = new Matrix(); + + /** + * this rectangle defines the area in which graph values can be drawn + */ + protected RectF mContentRect = new RectF(); + + protected float mChartWidth = 0f; + protected float mChartHeight = 0f; + + /** + * minimum scale value on the y-axis + */ + private float mMinScaleY = 1f; + + /** + * maximum scale value on the y-axis + */ + private float mMaxScaleY = Float.MAX_VALUE; + + /** + * minimum scale value on the x-axis + */ + private float mMinScaleX = 1f; + + /** + * maximum scale value on the x-axis + */ + private float mMaxScaleX = Float.MAX_VALUE; + + /** + * contains the current scale factor of the x-axis + */ + private float mScaleX = 1f; + + /** + * contains the current scale factor of the y-axis + */ + private float mScaleY = 1f; + + /** + * current translation (drag distance) on the x-axis + */ + private float mTransX = 0f; + + /** + * current translation (drag distance) on the y-axis + */ + private float mTransY = 0f; + + /** + * offset that allows the chart to be dragged over its bounds on the x-axis + */ + private float mTransOffsetX = 0f; + + /** + * offset that allows the chart to be dragged over its bounds on the x-axis + */ + private float mTransOffsetY = 0f; + + /** + * Constructor - don't forget calling setChartDimens(...) + */ + public ViewPortHandler() { + + } + + /** + * Sets the width and height of the chart. + * + * @param width + * @param height + */ + + public void setChartDimens(float width, float height) { + + float offsetLeft = this.offsetLeft(); + float offsetTop = this.offsetTop(); + float offsetRight = this.offsetRight(); + float offsetBottom = this.offsetBottom(); + + mChartHeight = height; + mChartWidth = width; + + restrainViewPort(offsetLeft, offsetTop, offsetRight, offsetBottom); + } + + public boolean hasChartDimens() { + if (mChartHeight > 0 && mChartWidth > 0) + return true; + else + return false; + } + + public void restrainViewPort(float offsetLeft, float offsetTop, float offsetRight, + float offsetBottom) { + mContentRect.set(offsetLeft, offsetTop, mChartWidth - offsetRight, mChartHeight + - offsetBottom); + } + + public float offsetLeft() { + return mContentRect.left; + } + + public float offsetRight() { + return mChartWidth - mContentRect.right; + } + + public float offsetTop() { + return mContentRect.top; + } + + public float offsetBottom() { + return mChartHeight - mContentRect.bottom; + } + + public float contentTop() { + return mContentRect.top; + } + + public float contentLeft() { + return mContentRect.left; + } + + public float contentRight() { + return mContentRect.right; + } + + public float contentBottom() { + return mContentRect.bottom; + } + + public float contentWidth() { + return mContentRect.width(); + } + + public float contentHeight() { + return mContentRect.height(); + } + + public RectF getContentRect() { + return mContentRect; + } + + public MPPointF getContentCenter() { + return MPPointF.getInstance(mContentRect.centerX(), mContentRect.centerY()); + } + + public float getChartHeight() { + return mChartHeight; + } + + public float getChartWidth() { + return mChartWidth; + } + + /** + * Returns the smallest extension of the content rect (width or height). + * + * @return + */ + public float getSmallestContentExtension() { + return Math.min(mContentRect.width(), mContentRect.height()); + } + + /** + * ################ ################ ################ ################ + */ + /** CODE BELOW THIS RELATED TO SCALING AND GESTURES */ + + /** + * Zooms in by 1.4f, x and y are the coordinates (in pixels) of the zoom + * center. + * + * @param x + * @param y + */ + public Matrix zoomIn(float x, float y) { + + Matrix save = new Matrix(); + zoomIn(x, y, save); + return save; + } + + public void zoomIn(float x, float y, Matrix outputMatrix) { + outputMatrix.reset(); + outputMatrix.set(mMatrixTouch); + outputMatrix.postScale(1.4f, 1.4f, x, y); + } + + /** + * Zooms out by 0.7f, x and y are the coordinates (in pixels) of the zoom + * center. + */ + public Matrix zoomOut(float x, float y) { + + Matrix save = new Matrix(); + zoomOut(x, y, save); + return save; + } + + public void zoomOut(float x, float y, Matrix outputMatrix) { + outputMatrix.reset(); + outputMatrix.set(mMatrixTouch); + outputMatrix.postScale(0.7f, 0.7f, x, y); + } + + /** + * Zooms out to original size. + * @param outputMatrix + */ + public void resetZoom(Matrix outputMatrix) { + outputMatrix.reset(); + outputMatrix.set(mMatrixTouch); + outputMatrix.postScale(1.0f, 1.0f, 0.0f, 0.0f); + } + + /** + * Post-scales by the specified scale factors. + * + * @param scaleX + * @param scaleY + * @return + */ + public Matrix zoom(float scaleX, float scaleY) { + + Matrix save = new Matrix(); + zoom(scaleX, scaleY, save); + return save; + } + + public void zoom(float scaleX, float scaleY, Matrix outputMatrix) { + outputMatrix.reset(); + outputMatrix.set(mMatrixTouch); + outputMatrix.postScale(scaleX, scaleY); + } + + /** + * Post-scales by the specified scale factors. x and y is pivot. + * + * @param scaleX + * @param scaleY + * @param x + * @param y + * @return + */ + public Matrix zoom(float scaleX, float scaleY, float x, float y) { + + Matrix save = new Matrix(); + zoom(scaleX, scaleY, x, y, save); + return save; + } + + public void zoom(float scaleX, float scaleY, float x, float y, Matrix outputMatrix) { + outputMatrix.reset(); + outputMatrix.set(mMatrixTouch); + outputMatrix.postScale(scaleX, scaleY, x, y); + } + + /** + * Sets the scale factor to the specified values. + * + * @param scaleX + * @param scaleY + * @return + */ + public Matrix setZoom(float scaleX, float scaleY) { + + Matrix save = new Matrix(); + setZoom(scaleX, scaleY, save); + return save; + } + + public void setZoom(float scaleX, float scaleY, Matrix outputMatrix) { + outputMatrix.reset(); + outputMatrix.set(mMatrixTouch); + outputMatrix.setScale(scaleX, scaleY); + } + + /** + * Sets the scale factor to the specified values. x and y is pivot. + * + * @param scaleX + * @param scaleY + * @param x + * @param y + * @return + */ + public Matrix setZoom(float scaleX, float scaleY, float x, float y) { + + Matrix save = new Matrix(); + save.set(mMatrixTouch); + + save.setScale(scaleX, scaleY, x, y); + + return save; + } + + protected float[] valsBufferForFitScreen = new float[9]; + + /** + * Resets all zooming and dragging and makes the chart fit exactly it's + * bounds. + */ + public Matrix fitScreen() { + + Matrix save = new Matrix(); + fitScreen(save); + return save; + } + + /** + * Resets all zooming and dragging and makes the chart fit exactly it's + * bounds. Output Matrix is available for those who wish to cache the object. + */ + public void fitScreen(Matrix outputMatrix) { + mMinScaleX = 1f; + mMinScaleY = 1f; + + outputMatrix.set(mMatrixTouch); + + float[] vals = valsBufferForFitScreen; + for (int i = 0; i < 9; i++) { + vals[i] = 0; + } + + outputMatrix.getValues(vals); + + // reset all translations and scaling + vals[Matrix.MTRANS_X] = 0f; + vals[Matrix.MTRANS_Y] = 0f; + vals[Matrix.MSCALE_X] = 1f; + vals[Matrix.MSCALE_Y] = 1f; + + outputMatrix.setValues(vals); + } + + /** + * Post-translates to the specified points. Less Performant. + * + * @param transformedPts + * @return + */ + public Matrix translate(final float[] transformedPts) { + + Matrix save = new Matrix(); + translate(transformedPts, save); + return save; + } + + /** + * Post-translates to the specified points. Output matrix allows for caching objects. + * + * @param transformedPts + * @return + */ + public void translate(final float[] transformedPts, Matrix outputMatrix) { + outputMatrix.reset(); + outputMatrix.set(mMatrixTouch); + final float x = transformedPts[0] - offsetLeft(); + final float y = transformedPts[1] - offsetTop(); + outputMatrix.postTranslate(-x, -y); + } + + protected Matrix mCenterViewPortMatrixBuffer = new Matrix(); + + /** + * Centers the viewport around the specified position (x-index and y-value) + * in the chart. Centering the viewport outside the bounds of the chart is + * not possible. Makes most sense in combination with the + * setScaleMinima(...) method. + * + * @param transformedPts the position to center view viewport to + * @param view + * @return save + */ + public void centerViewPort(final float[] transformedPts, final View view) { + + Matrix save = mCenterViewPortMatrixBuffer; + save.reset(); + save.set(mMatrixTouch); + + final float x = transformedPts[0] - offsetLeft(); + final float y = transformedPts[1] - offsetTop(); + + save.postTranslate(-x, -y); + + refresh(save, view, true); + } + + /** + * buffer for storing the 9 matrix values of a 3x3 matrix + */ + protected final float[] matrixBuffer = new float[9]; + + /** + * call this method to refresh the graph with a given matrix + * + * @param newMatrix + * @return + */ + public Matrix refresh(Matrix newMatrix, View chart, boolean invalidate) { + + mMatrixTouch.set(newMatrix); + + // make sure scale and translation are within their bounds + limitTransAndScale(mMatrixTouch, mContentRect); + + if (invalidate) + chart.invalidate(); + + newMatrix.set(mMatrixTouch); + return newMatrix; + } + + /** + * limits the maximum scale and X translation of the given matrix + * + * @param matrix + */ + public void limitTransAndScale(Matrix matrix, RectF content) { + + matrix.getValues(matrixBuffer); + + float curTransX = matrixBuffer[Matrix.MTRANS_X]; + float curScaleX = matrixBuffer[Matrix.MSCALE_X]; + + float curTransY = matrixBuffer[Matrix.MTRANS_Y]; + float curScaleY = matrixBuffer[Matrix.MSCALE_Y]; + + // min scale-x is 1f + mScaleX = Math.min(Math.max(mMinScaleX, curScaleX), mMaxScaleX); + + // min scale-y is 1f + mScaleY = Math.min(Math.max(mMinScaleY, curScaleY), mMaxScaleY); + + float width = 0f; + float height = 0f; + + if (content != null) { + width = content.width(); + height = content.height(); + } + + float maxTransX = -width * (mScaleX - 1f); + mTransX = Math.min(Math.max(curTransX, maxTransX - mTransOffsetX), mTransOffsetX); + + float maxTransY = height * (mScaleY - 1f); + mTransY = Math.max(Math.min(curTransY, maxTransY + mTransOffsetY), -mTransOffsetY); + + matrixBuffer[Matrix.MTRANS_X] = mTransX; + matrixBuffer[Matrix.MSCALE_X] = mScaleX; + + matrixBuffer[Matrix.MTRANS_Y] = mTransY; + matrixBuffer[Matrix.MSCALE_Y] = mScaleY; + + matrix.setValues(matrixBuffer); + } + + /** + * Sets the minimum scale factor for the x-axis + * + * @param xScale + */ + public void setMinimumScaleX(float xScale) { + + if (xScale < 1f) + xScale = 1f; + + mMinScaleX = xScale; + + limitTransAndScale(mMatrixTouch, mContentRect); + } + + /** + * Sets the maximum scale factor for the x-axis + * + * @param xScale + */ + public void setMaximumScaleX(float xScale) { + + if (xScale == 0.f) + xScale = Float.MAX_VALUE; + + mMaxScaleX = xScale; + + limitTransAndScale(mMatrixTouch, mContentRect); + } + + /** + * Sets the minimum and maximum scale factors for the x-axis + * + * @param minScaleX + * @param maxScaleX + */ + public void setMinMaxScaleX(float minScaleX, float maxScaleX) { + + if (minScaleX < 1f) + minScaleX = 1f; + + if (maxScaleX == 0.f) + maxScaleX = Float.MAX_VALUE; + + mMinScaleX = minScaleX; + mMaxScaleX = maxScaleX; + + limitTransAndScale(mMatrixTouch, mContentRect); + } + + /** + * Sets the minimum scale factor for the y-axis + * + * @param yScale + */ + public void setMinimumScaleY(float yScale) { + + if (yScale < 1f) + yScale = 1f; + + mMinScaleY = yScale; + + limitTransAndScale(mMatrixTouch, mContentRect); + } + + /** + * Sets the maximum scale factor for the y-axis + * + * @param yScale + */ + public void setMaximumScaleY(float yScale) { + + if (yScale == 0.f) + yScale = Float.MAX_VALUE; + + mMaxScaleY = yScale; + + limitTransAndScale(mMatrixTouch, mContentRect); + } + + public void setMinMaxScaleY(float minScaleY, float maxScaleY) { + + if (minScaleY < 1f) + minScaleY = 1f; + + if (maxScaleY == 0.f) + maxScaleY = Float.MAX_VALUE; + + mMinScaleY = minScaleY; + mMaxScaleY = maxScaleY; + + limitTransAndScale(mMatrixTouch, mContentRect); + } + + /** + * Returns the charts-touch matrix used for translation and scale on touch. + * + * @return + */ + public Matrix getMatrixTouch() { + return mMatrixTouch; + } + + /** + * ################ ################ ################ ################ + */ + /** + * BELOW METHODS FOR BOUNDS CHECK + */ + + public boolean isInBoundsX(float x) { + return isInBoundsLeft(x) && isInBoundsRight(x); + } + + public boolean isInBoundsY(float y) { + return isInBoundsTop(y) && isInBoundsBottom(y); + } + + public boolean isInBounds(float x, float y) { + return isInBoundsX(x) && isInBoundsY(y); + } + + public boolean isInBoundsLeft(float x) { + return mContentRect.left <= x + 1; + } + + public boolean isInBoundsRight(float x) { + x = (float) ((int) (x * 100.f)) / 100.f; + return mContentRect.right >= x - 1; + } + + public boolean isInBoundsTop(float y) { + return mContentRect.top <= y; + } + + public boolean isInBoundsBottom(float y) { + y = (float) ((int) (y * 100.f)) / 100.f; + return mContentRect.bottom >= y; + } + + /** + * returns the current x-scale factor + */ + public float getScaleX() { + return mScaleX; + } + + /** + * returns the current y-scale factor + */ + public float getScaleY() { + return mScaleY; + } + + public float getMinScaleX() { + return mMinScaleX; + } + + public float getMaxScaleX() { + return mMaxScaleX; + } + + public float getMinScaleY() { + return mMinScaleY; + } + + public float getMaxScaleY() { + return mMaxScaleY; + } + + /** + * Returns the translation (drag / pan) distance on the x-axis + * + * @return + */ + public float getTransX() { + return mTransX; + } + + /** + * Returns the translation (drag / pan) distance on the y-axis + * + * @return + */ + public float getTransY() { + return mTransY; + } + + /** + * if the chart is fully zoomed out, return true + * + * @return + */ + public boolean isFullyZoomedOut() { + + return isFullyZoomedOutX() && isFullyZoomedOutY(); + } + + /** + * Returns true if the chart is fully zoomed out on it's y-axis (vertical). + * + * @return + */ + public boolean isFullyZoomedOutY() { + return !(mScaleY > mMinScaleY || mMinScaleY > 1f); + } + + /** + * Returns true if the chart is fully zoomed out on it's x-axis + * (horizontal). + * + * @return + */ + public boolean isFullyZoomedOutX() { + return !(mScaleX > mMinScaleX || mMinScaleX > 1f); + } + + /** + * Set an offset in dp that allows the user to drag the chart over it's + * bounds on the x-axis. + * + * @param offset + */ + public void setDragOffsetX(float offset) { + mTransOffsetX = Utils.convertDpToPixel(offset); + } + + /** + * Set an offset in dp that allows the user to drag the chart over it's + * bounds on the y-axis. + * + * @param offset + */ + public void setDragOffsetY(float offset) { + mTransOffsetY = Utils.convertDpToPixel(offset); + } + + /** + * Returns true if both drag offsets (x and y) are zero or smaller. + * + * @return + */ + public boolean hasNoDragOffset() { + return mTransOffsetX <= 0 && mTransOffsetY <= 0; + } + + /** + * Returns true if the chart is not yet fully zoomed out on the x-axis + * + * @return + */ + public boolean canZoomOutMoreX() { + return mScaleX > mMinScaleX; + } + + /** + * Returns true if the chart is not yet fully zoomed in on the x-axis + * + * @return + */ + public boolean canZoomInMoreX() { + return mScaleX < mMaxScaleX; + } + + /** + * Returns true if the chart is not yet fully zoomed out on the y-axis + * + * @return + */ + public boolean canZoomOutMoreY() { + return mScaleY > mMinScaleY; + } + + /** + * Returns true if the chart is not yet fully zoomed in on the y-axis + * + * @return + */ + public boolean canZoomInMoreY() { + return mScaleY < mMaxScaleY; + } +} diff --git a/MPChartLib/src/test/java/com/github/mikephil/charting/test/ApproximatorTest.java b/MPChartLib/src/test/java/com/github/mikephil/charting/test/ApproximatorTest.java new file mode 100644 index 00000000..784c290c --- /dev/null +++ b/MPChartLib/src/test/java/com/github/mikephil/charting/test/ApproximatorTest.java @@ -0,0 +1,43 @@ +package com.github.mikephil.charting.test; + +import com.github.mikephil.charting.data.Entry; +import com.github.mikephil.charting.data.filter.Approximator; + +import org.junit.Test; + +import java.util.ArrayList; +import java.util.List; + +import static junit.framework.Assert.assertEquals; + +/** + * Created by philipp on 07/06/16. + */ +public class ApproximatorTest { + + @Test + public void testApproximation() { + + float[] points = new float[]{ + 10, 20, + 20, 30, + 25, 25, + 30, 28, + 31, 31, + 33, 33, + 40, 40, + 44, 40, + 48, 23, + 50, 20, + 55, 20, + 60, 25}; + + assertEquals(24, points.length); + + Approximator a = new Approximator(); + + float[] reduced = a.reduceWithDouglasPeucker(points, 2); + + assertEquals(18, reduced.length); + } +} diff --git a/MPChartLib/src/test/java/com/github/mikephil/charting/test/AxisRendererTest.java b/MPChartLib/src/test/java/com/github/mikephil/charting/test/AxisRendererTest.java new file mode 100644 index 00000000..05cb2f35 --- /dev/null +++ b/MPChartLib/src/test/java/com/github/mikephil/charting/test/AxisRendererTest.java @@ -0,0 +1,105 @@ +package com.github.mikephil.charting.test; + +import com.github.mikephil.charting.components.YAxis; +import com.github.mikephil.charting.renderer.AxisRenderer; +import com.github.mikephil.charting.renderer.YAxisRenderer; + +import org.junit.Test; + +import static junit.framework.Assert.assertEquals; + +/** + * Created by philipp on 31/05/16. + */ +public class AxisRendererTest { + + + @Test + public void testComputeAxisValues() { + + YAxis yAxis = new YAxis(); + yAxis.setLabelCount(6); + AxisRenderer renderer = new YAxisRenderer(null, yAxis, null); + + renderer.computeAxis(0, 100, false); + float[] entries = yAxis.mEntries; + + assertEquals(6, entries.length); + assertEquals(20, entries[1] - entries[0], 0.01); // interval 20 + assertEquals(0, entries[0], 0.01); + assertEquals(100, entries[entries.length - 1], 0.01); + + yAxis = new YAxis(); + yAxis.setLabelCount(6); + yAxis.setGranularity(50f); + renderer = new YAxisRenderer(null, yAxis, null); + + renderer.computeAxis(0, 100, false); + entries = yAxis.mEntries; + + assertEquals(3, entries.length); + assertEquals(50, entries[1] - entries[0], 0.01); // interval 50 + assertEquals(0, entries[0], 0.01); + assertEquals(100, entries[entries.length - 1], 0.01); + + yAxis = new YAxis(); + yAxis.setLabelCount(5, true); + renderer = new YAxisRenderer(null, yAxis, null); + + renderer.computeAxis(0, 100, false); + entries = yAxis.mEntries; + + assertEquals(5, entries.length); + assertEquals(25, entries[1] - entries[0], 0.01); // interval 25 + assertEquals(0, entries[0], 0.01); + assertEquals(100, entries[entries.length - 1], 0.01); + + yAxis = new YAxis(); + yAxis.setLabelCount(5, true); + renderer = new YAxisRenderer(null, yAxis, null); + + renderer.computeAxis(0, 0.01f, false); + entries = yAxis.mEntries; + + assertEquals(5, entries.length); + assertEquals(0.0025, entries[1] - entries[0], 0.0001); + assertEquals(0, entries[0], 0.0001); + assertEquals(0.01, entries[entries.length - 1], 0.0001); + + yAxis = new YAxis(); + yAxis.setLabelCount(5, false); + renderer = new YAxisRenderer(null, yAxis, null); + + renderer.computeAxis(0, 0.01f, false); + entries = yAxis.mEntries; + + assertEquals(5, entries.length); + assertEquals(0.0020, entries[1] - entries[0], 0.0001); + assertEquals(0, entries[0], 0.0001); + assertEquals(0.0080, entries[entries.length - 1], 0.0001); + + yAxis = new YAxis(); + yAxis.setLabelCount(6); + renderer = new YAxisRenderer(null, yAxis, null); + + renderer.computeAxis(-50, 50, false); + entries = yAxis.mEntries; + + assertEquals(5, entries.length); + assertEquals(-40, entries[0], 0.0001); + assertEquals(0, entries[2], 0.0001); + assertEquals(40, entries[entries.length - 1], 0.0001); + + yAxis = new YAxis(); + yAxis.setLabelCount(6); + renderer = new YAxisRenderer(null, yAxis, null); + + renderer.computeAxis(-50, 100, false); + entries = yAxis.mEntries; + + assertEquals(5, entries.length); + assertEquals(-30, entries[0], 0.0001); + assertEquals(30, entries[2], 0.0001); + assertEquals(90, entries[entries.length - 1], 0.0001); + } +} diff --git a/MPChartLib/src/test/java/com/github/mikephil/charting/test/BarDataTest.java b/MPChartLib/src/test/java/com/github/mikephil/charting/test/BarDataTest.java new file mode 100644 index 00000000..99954bce --- /dev/null +++ b/MPChartLib/src/test/java/com/github/mikephil/charting/test/BarDataTest.java @@ -0,0 +1,72 @@ +package com.github.mikephil.charting.test; + +import com.github.mikephil.charting.data.BarData; +import com.github.mikephil.charting.data.BarDataSet; +import com.github.mikephil.charting.data.BarEntry; + +import org.junit.Test; + +import java.util.ArrayList; +import java.util.List; + +import static junit.framework.Assert.assertEquals; + +/** + * Created by philipp on 06/06/16. + */ +public class BarDataTest { + + @Test + public void testGroupBars() { + + float groupSpace = 5f; + float barSpace = 1f; + + List<BarEntry> values1 = new ArrayList<>(); + List<BarEntry> values2 = new ArrayList<>(); + + for(int i = 0; i < 5; i++) { + values1.add(new BarEntry(i, 50)); + values2.add(new BarEntry(i, 60)); + } + + BarDataSet barDataSet1 = new BarDataSet(values1, "Set1"); + BarDataSet barDataSet2 = new BarDataSet(values2, "Set2"); + + BarData data = new BarData(barDataSet1, barDataSet2); + data.setBarWidth(10f); + + float groupWidth = data.getGroupWidth(groupSpace, barSpace); + assertEquals(27f, groupWidth, 0.01f); + + assertEquals(0f, values1.get(0).getX(), 0.01f); + assertEquals(1f, values1.get(1).getX(), 0.01f); + + data.groupBars(1000, groupSpace, barSpace); + + // 1000 + 2.5 + 0.5 + 5 + assertEquals(1008f, values1.get(0).getX(), 0.01f); + assertEquals(1019f, values2.get(0).getX(), 0.01f); + assertEquals(1035f, values1.get(1).getX(), 0.01f); + assertEquals(1046f, values2.get(1).getX(), 0.01f); + + data.groupBars(-1000, groupSpace, barSpace); + + assertEquals(-992f, values1.get(0).getX(), 0.01f); + assertEquals(-981f, values2.get(0).getX(), 0.01f); + assertEquals(-965f, values1.get(1).getX(), 0.01f); + assertEquals(-954f, values2.get(1).getX(), 0.01f); + + data.setBarWidth(20f); + groupWidth = data.getGroupWidth(groupSpace, barSpace); + assertEquals(47f, groupWidth, 0.01f); + + data.setBarWidth(10f); + data.groupBars(-20, groupSpace, barSpace); + + assertEquals(-12f, values1.get(0).getX(), 0.01f); + assertEquals(-1f, values2.get(0).getX(), 0.01f); + assertEquals(15f, values1.get(1).getX(), 0.01f); + assertEquals(26f, values2.get(1).getX(), 0.01f); + } +} diff --git a/MPChartLib/src/test/java/com/github/mikephil/charting/test/ChartDataTest.java b/MPChartLib/src/test/java/com/github/mikephil/charting/test/ChartDataTest.java new file mode 100644 index 00000000..ae464eef --- /dev/null +++ b/MPChartLib/src/test/java/com/github/mikephil/charting/test/ChartDataTest.java @@ -0,0 +1,211 @@ +package com.github.mikephil.charting.test; + +import com.github.mikephil.charting.components.YAxis; +import com.github.mikephil.charting.data.Entry; +import com.github.mikephil.charting.data.LineData; +import com.github.mikephil.charting.data.LineDataSet; +import com.github.mikephil.charting.data.ScatterData; +import com.github.mikephil.charting.data.ScatterDataSet; + +import org.junit.Test; + +import java.util.ArrayList; +import java.util.List; + +import static junit.framework.Assert.assertEquals; +import static junit.framework.Assert.assertFalse; +import static junit.framework.Assert.assertTrue; + +/** + * Created by philipp on 06/06/16. + */ +public class ChartDataTest { + + @Test + public void testDynamicChartData() { + + List<Entry> entries1 = new ArrayList<Entry>(); + entries1.add(new Entry(10, 10)); + entries1.add(new Entry(15, -2)); + entries1.add(new Entry(21, 50)); + + ScatterDataSet set1 = new ScatterDataSet(entries1, ""); + + List<Entry> entries2 = new ArrayList<Entry>(); + entries2.add(new Entry(-1, 10)); + entries2.add(new Entry(10, 2)); + entries2.add(new Entry(20, 5)); + + ScatterDataSet set2 = new ScatterDataSet(entries2, ""); + + ScatterData data = new ScatterData(set1, set2); + + assertEquals(-2, data.getYMin(YAxis.AxisDependency.LEFT), 0.01f); + assertEquals(50f, data.getYMax(YAxis.AxisDependency.LEFT), 0.01f); + + assertEquals(6, data.getEntryCount()); + + assertEquals(-1f, data.getXMin(), 0.01f); + assertEquals(21f, data.getXMax(), 0.01f); + + assertEquals(-2f, data.getYMin(), 0.01f); + assertEquals(50f, data.getYMax(), 0.01f); + + assertEquals(3, data.getMaxEntryCountSet().getEntryCount()); + + // now add and remove values + data.addEntry(new Entry(-10, -10), 0); + + assertEquals(set1, data.getMaxEntryCountSet()); + assertEquals(4, data.getMaxEntryCountSet().getEntryCount()); + + assertEquals(-10f, data.getYMin(YAxis.AxisDependency.LEFT), 0.01f); + assertEquals(50f, data.getYMax(YAxis.AxisDependency.LEFT), 0.01f); + + assertEquals(-10f, data.getXMin(), 0.01f); + assertEquals(21f, data.getXMax(), 0.01f); + + assertEquals(-10f, data.getYMin(), 0.01f); + assertEquals(50f, data.getYMax(), 0.01f); + + data.addEntry(new Entry(-100, 100), 0); + data.addEntry(new Entry(0, -100), 0); + + assertEquals(-100f, data.getYMin(YAxis.AxisDependency.LEFT), 0.01f); + assertEquals(100f, data.getYMax(YAxis.AxisDependency.LEFT), 0.01f); + + // right axis will adapt left axis values if no right axis values are present + assertEquals(-100, data.getYMin(YAxis.AxisDependency.RIGHT), 0.01f); + assertEquals(100f, data.getYMax(YAxis.AxisDependency.RIGHT), 0.01f); + + List<Entry> entries3 = new ArrayList<Entry>(); + entries3.add(new Entry(0, 200)); + entries3.add(new Entry(0, -50)); + + ScatterDataSet set3 = new ScatterDataSet(entries3, ""); + set3.setAxisDependency(YAxis.AxisDependency.RIGHT); + + data.addDataSet(set3); + + assertEquals(3, data.getDataSetCount()); + + assertEquals(-100f, data.getYMin(YAxis.AxisDependency.LEFT), 0.01f); + assertEquals(100f, data.getYMax(YAxis.AxisDependency.LEFT), 0.01f); + + assertEquals(-50f, data.getYMin(YAxis.AxisDependency.RIGHT), 0.01f); + assertEquals(200f, data.getYMax(YAxis.AxisDependency.RIGHT), 0.01f); + + LineData lineData = new LineData(); + + assertEquals(Float.MAX_VALUE, lineData.getYMin(), 0.01f); + assertEquals(-Float.MAX_VALUE, lineData.getYMax(), 0.01f); + + assertEquals(Float.MAX_VALUE, lineData.getYMin(YAxis.AxisDependency.LEFT), 0.01f); + assertEquals(-Float.MAX_VALUE, lineData.getYMax(YAxis.AxisDependency.LEFT), 0.01f); + + assertEquals(Float.MAX_VALUE, lineData.getYMin(YAxis.AxisDependency.RIGHT), 0.01f); + assertEquals(-Float.MAX_VALUE, lineData.getYMax(YAxis.AxisDependency.RIGHT), 0.01f); + + assertEquals(0, lineData.getDataSetCount()); + + List<Entry> lineEntries1 = new ArrayList<Entry>(); + lineEntries1.add(new Entry(10, 90)); + lineEntries1.add(new Entry(1000, 1000)); + + LineDataSet lineSet1 = new LineDataSet(lineEntries1, ""); + + lineData.addDataSet(lineSet1); + + assertEquals(1, lineData.getDataSetCount()); + assertEquals(2, lineSet1.getEntryCount()); + assertEquals(2, lineData.getEntryCount()); + + assertEquals(10, lineData.getXMin(), 0.01f); + assertEquals(1000f, lineData.getXMax(), 0.01f); + + assertEquals(90, lineData.getYMin(), 0.01f); + assertEquals(1000, lineData.getYMax(), 0.01f); + + assertEquals(90, lineData.getYMin(YAxis.AxisDependency.LEFT), 0.01f); + assertEquals(1000f, lineData.getYMax(YAxis.AxisDependency.LEFT), 0.01f); + + assertEquals(90, lineData.getYMin(YAxis.AxisDependency.RIGHT), 0.01f); + assertEquals(1000, lineData.getYMax(YAxis.AxisDependency.RIGHT), 0.01f); + + List<Entry> lineEntries2 = new ArrayList<Entry>(); + lineEntries2.add(new Entry(-1000, 2000)); + lineEntries2.add(new Entry(2000, -3000)); + + Entry e = new Entry(-1000, 2500); + lineEntries2.add(e); + + LineDataSet lineSet2 = new LineDataSet(lineEntries2, ""); + lineSet2.setAxisDependency(YAxis.AxisDependency.RIGHT); + + lineData.addDataSet(lineSet2); + + assertEquals(2, lineData.getDataSetCount()); + assertEquals(3, lineSet2.getEntryCount()); + assertEquals(5, lineData.getEntryCount()); + + assertEquals(-1000, lineData.getXMin(), 0.01f); + assertEquals(2000, lineData.getXMax(), 0.01f); + + assertEquals(-3000, lineData.getYMin(), 0.01f); + assertEquals(2500, lineData.getYMax(), 0.01f); + + assertEquals(90, lineData.getYMin(YAxis.AxisDependency.LEFT), 0.01f); + assertEquals(1000f, lineData.getYMax(YAxis.AxisDependency.LEFT), 0.01f); + + assertEquals(-3000, lineData.getYMin(YAxis.AxisDependency.RIGHT), 0.01f); + assertEquals(2500, lineData.getYMax(YAxis.AxisDependency.RIGHT), 0.01f); + + assertTrue(lineData.removeEntry(e, 1)); + + assertEquals(-1000, lineData.getXMin(), 0.01f); + assertEquals(2000, lineData.getXMax(), 0.01f); + + assertEquals(-3000, lineData.getYMin(), 0.01f); + assertEquals(2000, lineData.getYMax(), 0.01f); + + assertEquals(90, lineData.getYMin(YAxis.AxisDependency.LEFT), 0.01f); + assertEquals(1000f, lineData.getYMax(YAxis.AxisDependency.LEFT), 0.01f); + + assertEquals(-3000, lineData.getYMin(YAxis.AxisDependency.RIGHT), 0.01f); + assertEquals(2000, lineData.getYMax(YAxis.AxisDependency.RIGHT), 0.01f); + + assertEquals(2, lineData.getDataSetCount()); + assertTrue(lineData.removeDataSet(lineSet2)); + assertEquals(1, lineData.getDataSetCount()); + + assertEquals(10, lineData.getXMin(), 0.01f); + assertEquals(1000, lineData.getXMax(), 0.01f); + + assertEquals(90, lineData.getYMin(), 0.01f); + assertEquals(1000, lineData.getYMax(), 0.01f); + + assertEquals(90, lineData.getYMin(YAxis.AxisDependency.LEFT), 0.01f); + assertEquals(1000f, lineData.getYMax(YAxis.AxisDependency.LEFT), 0.01f); + + assertEquals(90, lineData.getYMin(YAxis.AxisDependency.RIGHT), 0.01f); + assertEquals(1000, lineData.getYMax(YAxis.AxisDependency.RIGHT), 0.01f); + + assertTrue(lineData.removeDataSet(lineSet1)); + assertEquals(0, lineData.getDataSetCount()); + + assertEquals(Float.MAX_VALUE, lineData.getXMin(), 0.01f); + assertEquals(-Float.MAX_VALUE, lineData.getXMax(), 0.01f); + + assertEquals(Float.MAX_VALUE, lineData.getYMin(), 0.01f); + assertEquals(-Float.MAX_VALUE, lineData.getYMax(), 0.01f); + + assertEquals(Float.MAX_VALUE, lineData.getYMin(YAxis.AxisDependency.LEFT), 0.01f); + assertEquals(-Float.MAX_VALUE, lineData.getYMax(YAxis.AxisDependency.LEFT), 0.01f); + + assertEquals(Float.MAX_VALUE, lineData.getYMin(YAxis.AxisDependency.RIGHT), 0.01f); + assertEquals(-Float.MAX_VALUE, lineData.getYMax(YAxis.AxisDependency.RIGHT), 0.01f); + + assertFalse(lineData.removeDataSet(lineSet1)); + assertFalse(lineData.removeDataSet(lineSet2)); + } +} diff --git a/MPChartLib/src/test/java/com/github/mikephil/charting/test/DataSetTest.java b/MPChartLib/src/test/java/com/github/mikephil/charting/test/DataSetTest.java new file mode 100644 index 00000000..3be28d2a --- /dev/null +++ b/MPChartLib/src/test/java/com/github/mikephil/charting/test/DataSetTest.java @@ -0,0 +1,238 @@ +package com.github.mikephil.charting.test; + +import com.github.mikephil.charting.data.DataSet; +import com.github.mikephil.charting.data.Entry; +import com.github.mikephil.charting.data.ScatterDataSet; + +import org.junit.Test; + +import java.util.ArrayList; +import java.util.List; + +import static junit.framework.Assert.assertEquals; +import static junit.framework.Assert.assertFalse; +import static junit.framework.Assert.assertTrue; + +/** + * Created by philipp on 31/05/16. + */ +public class DataSetTest { + + @Test + public void testCalcMinMax() { + + List<Entry> entries = new ArrayList<Entry>(); + entries.add(new Entry(10, 10)); + entries.add(new Entry(15, 2)); + entries.add(new Entry(21, 5)); + + ScatterDataSet set = new ScatterDataSet(entries, ""); + + assertEquals(10f, set.getXMin(), 0.01f); + assertEquals(21f, set.getXMax(), 0.01f); + + assertEquals(2f, set.getYMin(), 0.01f); + assertEquals(10f, set.getYMax(), 0.01f); + + assertEquals(3, set.getEntryCount()); + + set.addEntry(new Entry(25, 1)); + + assertEquals(10f, set.getXMin(), 0.01f); + assertEquals(25f, set.getXMax(), 0.01f); + + assertEquals(1f, set.getYMin(), 0.01f); + assertEquals(10f, set.getYMax(), 0.01f); + + assertEquals(4, set.getEntryCount()); + + set.removeEntry(3); + + assertEquals(10f, set.getXMin(), 0.01f); + assertEquals(21, set.getXMax(), 0.01f); + + assertEquals(2f, set.getYMin(), 0.01f); + assertEquals(10f, set.getYMax(), 0.01f); + } + + @Test + public void testAddRemoveEntry() { + + List<Entry> entries = new ArrayList<Entry>(); + entries.add(new Entry(10, 10)); + entries.add(new Entry(15, 2)); + entries.add(new Entry(21, 5)); + + ScatterDataSet set = new ScatterDataSet(entries, ""); + + assertEquals(3, set.getEntryCount()); + + set.addEntryOrdered(new Entry(5, 1)); + + assertEquals(4, set.getEntryCount()); + + assertEquals(5, set.getXMin(), 0.01f); + assertEquals(21, set.getXMax(), 0.01f); + + assertEquals(1f, set.getYMin(), 0.01f); + assertEquals(10f, set.getYMax(), 0.01f); + + assertEquals(5, set.getEntryForIndex(0).getX(), 0.01f); + assertEquals(1, set.getEntryForIndex(0).getY(), 0.01f); + + set.addEntryOrdered(new Entry(20, 50)); + + assertEquals(5, set.getEntryCount()); + + assertEquals(20, set.getEntryForIndex(3).getX(), 0.01f); + assertEquals(50, set.getEntryForIndex(3).getY(), 0.01f); + + assertTrue(set.removeEntry(3)); + + assertEquals(4, set.getEntryCount()); + + assertEquals(21, set.getEntryForIndex(3).getX(), 0.01f); + assertEquals(5, set.getEntryForIndex(3).getY(), 0.01f); + + assertEquals(5, set.getEntryForIndex(0).getX(), 0.01f); + assertEquals(1, set.getEntryForIndex(0).getY(), 0.01f); + + assertTrue(set.removeFirst()); + + assertEquals(3, set.getEntryCount()); + + assertEquals(10, set.getEntryForIndex(0).getX(), 0.01f); + assertEquals(10, set.getEntryForIndex(0).getY(), 0.01f); + + set.addEntryOrdered(new Entry(15, 3)); + + assertEquals(4, set.getEntryCount()); + + assertEquals(15, set.getEntryForIndex(1).getX(), 0.01f); + assertEquals(3, set.getEntryForIndex(1).getY(), 0.01f); + + assertEquals(21, set.getEntryForIndex(3).getX(), 0.01f); + assertEquals(5, set.getEntryForIndex(3).getY(), 0.01f); + + assertTrue(set.removeLast()); + + assertEquals(3, set.getEntryCount()); + + assertEquals(15, set.getEntryForIndex(2).getX(), 0.01f); + assertEquals(2, set.getEntryForIndex(2).getY(), 0.01f); + + assertTrue(set.removeLast()); + + assertEquals(2, set.getEntryCount()); + + assertTrue(set.removeLast()); + + assertEquals(1, set.getEntryCount()); + + assertEquals(10, set.getEntryForIndex(0).getX(), 0.01f); + assertEquals(10, set.getEntryForIndex(0).getY(), 0.01f); + + assertTrue(set.removeLast()); + + assertEquals(0, set.getEntryCount()); + + assertFalse(set.removeLast()); + assertFalse(set.removeFirst()); + } + + @Test + public void testGetEntryForXValue() { + + List<Entry> entries = new ArrayList<Entry>(); + entries.add(new Entry(10, 10)); + entries.add(new Entry(15, 5)); + entries.add(new Entry(21, 5)); + + ScatterDataSet set = new ScatterDataSet(entries, ""); + + Entry closest = set.getEntryForXValue(17, Float.NaN, DataSet.Rounding.CLOSEST); + assertEquals(15, closest.getX(), 0.01f); + assertEquals(5, closest.getY(), 0.01f); + + closest = set.getEntryForXValue(17, Float.NaN, DataSet.Rounding.DOWN); + assertEquals(15, closest.getX(), 0.01f); + assertEquals(5, closest.getY(), 0.01f); + + closest = set.getEntryForXValue(15, Float.NaN, DataSet.Rounding.DOWN); + assertEquals(15, closest.getX(), 0.01f); + assertEquals(5, closest.getY(), 0.01f); + + closest = set.getEntryForXValue(14, Float.NaN, DataSet.Rounding.DOWN); + assertEquals(10, closest.getX(), 0.01f); + assertEquals(10, closest.getY(), 0.01f); + + closest = set.getEntryForXValue(17, Float.NaN, DataSet.Rounding.UP); + assertEquals(21, closest.getX(), 0.01f); + assertEquals(5, closest.getY(), 0.01f); + + closest = set.getEntryForXValue(21, Float.NaN, DataSet.Rounding.UP); + assertEquals(21, closest.getX(), 0.01f); + assertEquals(5, closest.getY(), 0.01f); + + closest = set.getEntryForXValue(21, Float.NaN, DataSet.Rounding.CLOSEST); + assertEquals(21, closest.getX(), 0.01f); + assertEquals(5, closest.getY(), 0.01f); + } + + @Test + public void testGetEntryForXValueWithDuplicates() { + + // sorted list of values (by x position) + List<Entry> values = new ArrayList<Entry>(); + values.add(new Entry(0, 10)); + values.add(new Entry(1, 20)); + values.add(new Entry(2, 30)); + values.add(new Entry(3, 40)); + values.add(new Entry(3, 50)); // duplicate + values.add(new Entry(4, 60)); + values.add(new Entry(4, 70)); // duplicate + values.add(new Entry(5, 80)); + values.add(new Entry(6, 90)); + values.add(new Entry(7, 100)); + values.add(new Entry(8, 110)); + values.add(new Entry(8, 120)); // duplicate + + ScatterDataSet set = new ScatterDataSet(values, ""); + + Entry closest = set.getEntryForXValue(0, Float.NaN, DataSet.Rounding.CLOSEST); + assertEquals(0, closest.getX(), 0.01f); + assertEquals(10, closest.getY(), 0.01f); + + closest = set.getEntryForXValue(5, Float.NaN, DataSet.Rounding.CLOSEST); + assertEquals(5, closest.getX(), 0.01f); + assertEquals(80, closest.getY(), 0.01f); + + closest = set.getEntryForXValue(5.4f, Float.NaN, DataSet.Rounding.CLOSEST); + assertEquals(5, closest.getX(), 0.01f); + assertEquals(80, closest.getY(), 0.01f); + + closest = set.getEntryForXValue(4.6f, Float.NaN, DataSet.Rounding.CLOSEST); + assertEquals(5, closest.getX(), 0.01f); + assertEquals(80, closest.getY(), 0.01f); + + closest = set.getEntryForXValue(7, Float.NaN, DataSet.Rounding.CLOSEST); + assertEquals(7, closest.getX(), 0.01f); + assertEquals(100, closest.getY(), 0.01f); + + closest = set.getEntryForXValue(4f, Float.NaN, DataSet.Rounding.CLOSEST); + assertEquals(4, closest.getX(), 0.01f); + assertEquals(60, closest.getY(), 0.01f); + + List<Entry> entries = set.getEntriesForXValue(4f); + assertEquals(2, entries.size()); + assertEquals(60, entries.get(0).getY(), 0.01f); + assertEquals(70, entries.get(1).getY(), 0.01f); + + entries = set.getEntriesForXValue(3.5f); + assertEquals(0, entries.size()); + + entries = set.getEntriesForXValue(2f); + assertEquals(1, entries.size()); + assertEquals(30, entries.get(0).getY(), 0.01f); + } +} diff --git a/MPChartLib/src/test/java/com/github/mikephil/charting/test/LargeValueFormatterTest.java b/MPChartLib/src/test/java/com/github/mikephil/charting/test/LargeValueFormatterTest.java new file mode 100644 index 00000000..f1e1e027 --- /dev/null +++ b/MPChartLib/src/test/java/com/github/mikephil/charting/test/LargeValueFormatterTest.java @@ -0,0 +1,95 @@ +package com.github.mikephil.charting.test; + +import com.github.mikephil.charting.formatter.LargeValueFormatter; + +import org.junit.Test; + +import static junit.framework.Assert.assertEquals; + +/** + * Created by philipp on 06/06/16. + */ +public class LargeValueFormatterTest { + + @Test + public void test() { + + LargeValueFormatter formatter = new LargeValueFormatter(); + + String result = formatter.getFormattedValue(5f, null); + assertEquals("5", result); + + result = formatter.getFormattedValue(5.5f, null); + assertEquals("5.5", result); + + result = formatter.getFormattedValue(50f, null); + assertEquals("50", result); + + result = formatter.getFormattedValue(50.5f, null); + assertEquals("50.5", result); + + result = formatter.getFormattedValue(500f, null); + assertEquals("500", result); + + result = formatter.getFormattedValue(1100f, null); + assertEquals("1.1k", result); + + result = formatter.getFormattedValue(10000f, null); + assertEquals("10k", result); + + result = formatter.getFormattedValue(10500f, null); + assertEquals("10.5k", result); + + result = formatter.getFormattedValue(100000f, null); + assertEquals("100k", result); + + result = formatter.getFormattedValue(1000000f, null); + assertEquals("1m", result); + + result = formatter.getFormattedValue(1500000f, null); + assertEquals("1.5m", result); + + result = formatter.getFormattedValue(9500000f, null); + assertEquals("9.5m", result); + + result = formatter.getFormattedValue(22200000f, null); + assertEquals("22.2m", result); + + result = formatter.getFormattedValue(222000000f, null); + assertEquals("222m", result); + + result = formatter.getFormattedValue(1000000000f, null); + assertEquals("1b", result); + + result = formatter.getFormattedValue(9900000000f, null); + assertEquals("9.9b", result); + + result = formatter.getFormattedValue(99000000000f, null); + assertEquals("99b", result); + + result = formatter.getFormattedValue(99500000000f, null); + assertEquals("99.5b", result); + + result = formatter.getFormattedValue(999000000000f, null); + assertEquals("999b", result); + + result = formatter.getFormattedValue(1000000000000f, null); + assertEquals("1t", result); + + formatter.setSuffix(new String[]{"", "k", "m", "b", "t", "q"}); // quadrillion support + result = formatter.getFormattedValue(1000000000000000f, null); + assertEquals("1q", result); + + result = formatter.getFormattedValue(1100000000000000f, null); + assertEquals("1.1q", result); + + result = formatter.getFormattedValue(10000000000000000f, null); + assertEquals("10q", result); + + result = formatter.getFormattedValue(13300000000000000f, null); + assertEquals("13.3q", result); + + result = formatter.getFormattedValue(100000000000000000f, null); + assertEquals("100q", result); + } +} diff --git a/MPChartLib/src/test/java/com/github/mikephil/charting/test/ObjectPoolTest.java b/MPChartLib/src/test/java/com/github/mikephil/charting/test/ObjectPoolTest.java new file mode 100644 index 00000000..e1dbe81b --- /dev/null +++ b/MPChartLib/src/test/java/com/github/mikephil/charting/test/ObjectPoolTest.java @@ -0,0 +1,240 @@ +package com.github.mikephil.charting.test; + +import com.github.mikephil.charting.utils.ObjectPool; + +import junit.framework.Assert; + +import org.junit.Test; + +import java.util.ArrayList; +import java.util.List; + +/** + * Created by otheruser on 6/28/16. + */ +public class ObjectPoolTest { + + static class TestPoolable extends ObjectPool.Poolable{ + + private static ObjectPool<TestPoolable> pool; + + static { + pool = ObjectPool.create(4, new TestPoolable(0,0)); + } + + public int foo = 0; + public int bar = 0; + + protected ObjectPool.Poolable instantiate(){ + return new TestPoolable(0,0); + } + + private TestPoolable(int foo, int bar){ + this.foo = foo; + this.bar = bar; + } + + public static TestPoolable getInstance(int foo, int bar){ + TestPoolable result = pool.get(); + result.foo = foo; + result.bar = bar; + return result; + } + + public static void recycleInstance(TestPoolable instance){ + pool.recycle(instance); + } + + public static void recycleInstances(List<TestPoolable> instances){ + pool.recycle(instances); + } + + public static ObjectPool getPool(){ + return pool; + } + + } + + @Test + public void testObjectPool(){ + + int poolCapacity = TestPoolable.getPool().getPoolCapacity(); + int poolCount = TestPoolable.getPool().getPoolCount(); + TestPoolable testPoolable; + ArrayList<TestPoolable> testPoolables = new ArrayList<>(); + + Assert.assertEquals(4, poolCapacity); + Assert.assertEquals(4, poolCount); + + testPoolable = TestPoolable.getInstance(6,7); + Assert.assertEquals(6, testPoolable.foo); + Assert.assertEquals(7, testPoolable.bar); + + poolCapacity = TestPoolable.getPool().getPoolCapacity(); + poolCount = TestPoolable.getPool().getPoolCount(); + + Assert.assertEquals(4, poolCapacity); + Assert.assertEquals(3, poolCount); + + TestPoolable.recycleInstance(testPoolable); + + poolCapacity = TestPoolable.getPool().getPoolCapacity(); + poolCount = TestPoolable.getPool().getPoolCount(); + Assert.assertEquals(4, poolCapacity); + Assert.assertEquals(4, poolCount); + + + testPoolable = TestPoolable.getInstance(20,30); + Assert.assertEquals(20, testPoolable.foo); + Assert.assertEquals(30, testPoolable.bar); + + TestPoolable.recycleInstance(testPoolable); + + poolCapacity = TestPoolable.getPool().getPoolCapacity(); + poolCount = TestPoolable.getPool().getPoolCount(); + Assert.assertEquals(4, poolCapacity); + Assert.assertEquals(4, poolCount); + + testPoolables.add(TestPoolable.getInstance(12,24)); + testPoolables.add(TestPoolable.getInstance(1,2)); + testPoolables.add(TestPoolable.getInstance(3,5)); + testPoolables.add(TestPoolable.getInstance(6,8)); + + poolCapacity = TestPoolable.getPool().getPoolCapacity(); + poolCount = TestPoolable.getPool().getPoolCount(); + Assert.assertEquals(4, poolCapacity); + Assert.assertEquals(0, poolCount); + + + TestPoolable.recycleInstances(testPoolables); + poolCapacity = TestPoolable.getPool().getPoolCapacity(); + poolCount = TestPoolable.getPool().getPoolCount(); + Assert.assertEquals(4, poolCapacity); + Assert.assertEquals(4, poolCount); + + testPoolables.clear(); + + + testPoolables.add(TestPoolable.getInstance(12,24)); + testPoolables.add(TestPoolable.getInstance(1,2)); + testPoolables.add(TestPoolable.getInstance(3,5)); + testPoolables.add(TestPoolable.getInstance(6,8)); + testPoolables.add(TestPoolable.getInstance(8,9)); + Assert.assertEquals(12, testPoolables.get(0).foo); + Assert.assertEquals(24, testPoolables.get(0).bar); + Assert.assertEquals(1, testPoolables.get(1).foo); + Assert.assertEquals(2, testPoolables.get(1).bar); + Assert.assertEquals(3, testPoolables.get(2).foo); + Assert.assertEquals(5, testPoolables.get(2).bar); + Assert.assertEquals(6, testPoolables.get(3).foo); + Assert.assertEquals(8, testPoolables.get(3).bar); + Assert.assertEquals(8, testPoolables.get(4).foo); + Assert.assertEquals(9, testPoolables.get(4).bar); + + + poolCapacity = TestPoolable.getPool().getPoolCapacity(); + poolCount = TestPoolable.getPool().getPoolCount(); + Assert.assertEquals(4, poolCapacity); + Assert.assertEquals(3, poolCount); + + TestPoolable.recycleInstances(testPoolables); + poolCapacity = TestPoolable.getPool().getPoolCapacity(); + poolCount = TestPoolable.getPool().getPoolCount(); + Assert.assertEquals(8, poolCapacity); + Assert.assertEquals(8, poolCount); + + testPoolables.clear(); + + + testPoolables.add(TestPoolable.getInstance(0,0)); + testPoolables.add(TestPoolable.getInstance(6,8)); + testPoolables.add(TestPoolable.getInstance(1,2)); + testPoolables.add(TestPoolable.getInstance(3,5)); + testPoolables.add(TestPoolable.getInstance(8,9)); + testPoolables.add(TestPoolable.getInstance(12,24)); + testPoolables.add(TestPoolable.getInstance(12,24)); + testPoolables.add(TestPoolable.getInstance(12,24)); + testPoolables.add(TestPoolable.getInstance(6,8)); + testPoolables.add(TestPoolable.getInstance(6,8)); + Assert.assertEquals(0, testPoolables.get(0).foo); + Assert.assertEquals(0, testPoolables.get(0).bar); + Assert.assertEquals(6, testPoolables.get(1).foo); + Assert.assertEquals(8, testPoolables.get(1).bar); + Assert.assertEquals(1, testPoolables.get(2).foo); + Assert.assertEquals(2, testPoolables.get(2).bar); + Assert.assertEquals(3, testPoolables.get(3).foo); + Assert.assertEquals(5, testPoolables.get(3).bar); + Assert.assertEquals(8, testPoolables.get(4).foo); + Assert.assertEquals(9, testPoolables.get(4).bar); + Assert.assertEquals(12, testPoolables.get(5).foo); + Assert.assertEquals(24, testPoolables.get(5).bar); + Assert.assertEquals(12, testPoolables.get(6).foo); + Assert.assertEquals(24, testPoolables.get(6).bar); + Assert.assertEquals(12, testPoolables.get(7).foo); + Assert.assertEquals(24, testPoolables.get(7).bar); + Assert.assertEquals(6, testPoolables.get(8).foo); + Assert.assertEquals(8, testPoolables.get(8).bar); + Assert.assertEquals(6, testPoolables.get(9).foo); + Assert.assertEquals(8, testPoolables.get(9).bar); + + for(TestPoolable p : testPoolables){ + TestPoolable.recycleInstance(p); + } + + poolCapacity = TestPoolable.getPool().getPoolCapacity(); + poolCount = TestPoolable.getPool().getPoolCount(); + Assert.assertEquals(16, poolCapacity); + Assert.assertEquals(16, poolCount); + + testPoolable = TestPoolable.getInstance(9001,9001); + Assert.assertEquals(9001, testPoolable.foo); + Assert.assertEquals(9001, testPoolable.bar); + + poolCapacity = TestPoolable.getPool().getPoolCapacity(); + poolCount = TestPoolable.getPool().getPoolCount(); + Assert.assertEquals(16, poolCapacity); + Assert.assertEquals(15, poolCount); + + + TestPoolable.recycleInstance(testPoolable); + + poolCapacity = TestPoolable.getPool().getPoolCapacity(); + poolCount = TestPoolable.getPool().getPoolCount(); + Assert.assertEquals(16, poolCapacity); + Assert.assertEquals(16, poolCount); + + Exception e = null; + try{ + // expect an exception. + TestPoolable.recycleInstance(testPoolable); + }catch (Exception ex){ + e = ex; + }finally{ + Assert.assertEquals(e.getMessage(), true, e != null); + } + + testPoolables.clear(); + + TestPoolable.getPool().setReplenishPercentage(0.5f); + int i = 16; + while(i > 0){ + testPoolables.add(TestPoolable.getInstance(0,0)); + i--; + } + + poolCapacity = TestPoolable.getPool().getPoolCapacity(); + poolCount = TestPoolable.getPool().getPoolCount(); + Assert.assertEquals(16, poolCapacity); + Assert.assertEquals(0, poolCount); + + testPoolables.add(TestPoolable.getInstance(0,0)); + + poolCapacity = TestPoolable.getPool().getPoolCapacity(); + poolCount = TestPoolable.getPool().getPoolCount(); + Assert.assertEquals(16, poolCapacity); + Assert.assertEquals(7, poolCount); + + + } + +} diff --git a/README.md b/README.md new file mode 100644 index 00000000..a3253e3f --- /dev/null +++ b/README.md @@ -0,0 +1,203 @@ + + +[](https://jitpack.io/#PhilJay/MPAndroidChart) +[](https://android-arsenal.com/api?level=14) +[](http://android-arsenal.com/details/1/741) +[](https://gitter.im/PhilJay/MPAndroidChart?utm_source=badge&utm_medium=badge&utm_campaign=pr-badge&utm_content=body_badge) +[](http://twitter.com/mpandroidchart) + +:zap: A powerful & easy to use chart library for Android :zap: + +[**Charts**](https://github.com/danielgindi/Charts) is the iOS version of this library + +## Table of Contents +1. [Quick Start](#quick-start) + 1. [Gradle](#gradle-setup) + 1. [Maven](#maven-setup) +1. [Documentation](#documentation) +1. [Examples](#examples) +1. [Questions](#report) +1. [Donate](#donate) +1. [Social Media](#social) +1. [More Examples](#more-examples) +1. [License](#licence) +1. [Creators](#creators) + +### Gradle Setup + +```gradle +repositories { + maven { url 'https://jitpack.io' } +} + +dependencies { + implementation 'com.github.PhilJay:MPAndroidChart:v3.1.0' +} +``` + +### Maven Setup + +```xml +<!-- <repositories> section of pom.xml --> +<repository> + <id>jitpack.io</id> + <url>https://jitpack.io</url> +</repository> + +<!-- <dependencies> section of pom.xml --> +<dependency> + <groupId>com.github.PhilJay</groupId> + <artifactId>MPAndroidChart</artifactId> + <version>v3.1.0</version> +</dependency> +``` + +<br/> + +<h2 id="documentation">Documentation :notebook_with_decorative_cover:</h2> + +See the [**documentation**](https://weeklycoding.com/mpandroidchart/) for examples and general use of MPAndroidChart. + +See the [**javadocs**](https://jitpack.io/com/github/PhilJay/MPAndroidChart/v3.1.0/javadoc/) for more advanced documentation. + +<br/> + +<h2 id="examples">Examples :eyes:</h2> + +Download the [MPAndroidChart Example App](https://play.google.com/store/apps/details?id=com.xxmassdeveloper.mpchartexample) or look at the [source code](https://github.com/PhilJay/MPAndroidChart/tree/master/MPChartExample). + +[](https://www.youtube.com/watch?v=ufaK_Hd6BpI) + +<br/> + +<h2 id="report">Questions & Issues :thinking:</h2> + +This repository's issue tracker is only for bugs and feature requests. The maintainers ask that you refrain from asking questions about how to use MPAndroidChart through the issue tracker. + +Please read the [**documentation**](https://weeklycoding.com/mpandroidchart/) first, then ask all your questions on [stackoverflow.com](https://stackoverflow.com/questions/tagged/mpandroidchart) for the fastest answer. + +<br/> + +<h2 id="donate">Donations :heart:</h2> + +**This project needs you!** If you would like to support this project's further development, the creator of this project or the continuous maintenance of this project, **feel free to donate**. Your donation is highly appreciated (and I love food, coffee and beer). Thank you! + +**PayPal** + +- [**Donate 5 $**](https://www.paypal.com/cgi-bin/webscr?cmd=_s-xclick&hosted_button_id=7G52RA87ED8NY): Thank's for creating this project, here's a coffee (or some beer) for you! +- [**Donate 10 $**](https://www.paypal.com/cgi-bin/webscr?cmd=_s-xclick&hosted_button_id=4C9TPE67F5PUQ): Wow, I am stunned. Let me take you to the movies! +- [**Donate 15 $**](https://www.paypal.com/cgi-bin/webscr?cmd=_s-xclick&hosted_button_id=YKMPTFMVK3JMC): I really appreciate your work, let's grab some lunch! +- [**Donate 25 $**](https://www.paypal.com/cgi-bin/webscr?cmd=_s-xclick&hosted_button_id=H9JA4QX7UHXCY): That's some awesome stuff you did right there, dinner is on me! +- Or you can also [**choose what you want to donate**](https://www.paypal.com/cgi-bin/webscr?cmd=_s-xclick&hosted_button_id=EGBENAC5XBCKS), all donations are awesome! + +<br/> + +<h2 id="social">Social Media :fire:</h2> + +If you like this library, please tell others about it :two_hearts: :two_hearts: + +[](https://twitter.com/intent/tweet?text=Check%20out%20the%20awesome%20MPAndroidChart%20library%20on%20Github:%20https://github.com/PhilJay/MPAndroidChart) +[](https://plus.google.com/share?url=https://github.com/PhilJay/MPAndroidChart) +[](https://www.facebook.com/sharer/sharer.php?u=https://github.com/PhilJay/MPAndroidChart) + +If you like, you can follow me on Twitter [**@PhilippJahoda**](https://twitter.com/PhilippJahoda). + +<br/> + +<h2 id="more-examples">More Examples :+1:</h2> + +<br/> + +**LineChart (with legend, simple design)** + + +<br/><br/> + +**LineChart (with legend, simple design)** + +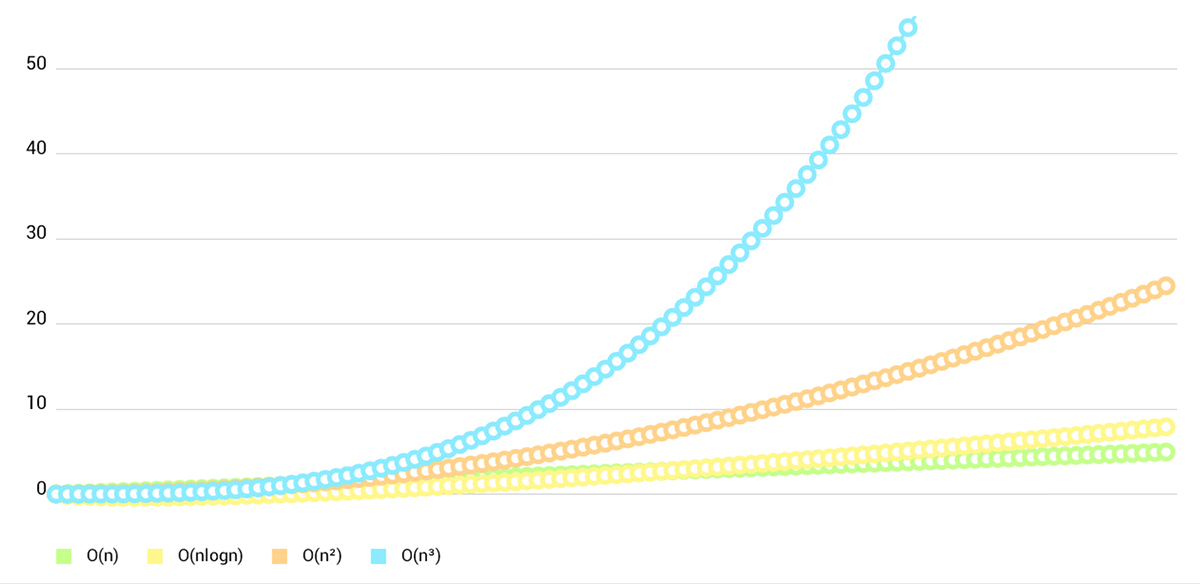 +<br/><br/> + +**LineChart (cubic lines)** + + +<br/><br/> + +**LineChart (gradient fill)** + + +<br/><br/> + +**BarChart (with legend, simple design)** + + +<br/><br/> + +**BarChart (grouped DataSets)** + + +<br/><br/> + +**Horizontal-BarChart** + + +<br/><br/> + +**Combined-Chart (bar- and linechart in this case)** + + +<br/><br/> + +**PieChart (with selection, ...)** + + +<br/><br/> + +**ScatterChart** (with squares, triangles, circles, ... and more) + + +<br/><br/> + +**CandleStickChart** (for financial data) + + +<br/><br/> + +**BubbleChart** (area covered by bubbles indicates the yValue) + + +<br/><br/> + +**RadarChart** (spider web chart) + + + +<br/> + +<h1 id="license">License :page_facing_up:</h1> + +Copyright 2020 Philipp Jahoda + +Licensed under the Apache License, Version 2.0 (the "License"); +you may not use this file except in compliance with the License. +You may obtain a copy of the License at + +> http://www.apache.org/licenses/LICENSE-2.0 + +Unless required by applicable law or agreed to in writing, software +distributed under the License is distributed on an "AS IS" BASIS, +WITHOUT WARRANTIES OR CONDITIONS OF ANY KIND, either express or implied. +See the License for the specific language governing permissions and +limitations under the License. + +<br/> + +<h2 id="creators">Special Thanks :heart:</h2> + +These people rock! + +- [danielgindi](https://github.com/danielgindi) - Daniel Gindi +- [mikegr](https://github.com/mikegr) - Michael Greifeneder +- [tony](https://github.com/tonypatino-monoclesociety) - Tony +- [almic](https://github.com/almic) - Mick A. +- [jitpack.io](https://github.com/jitpack-io) - JitPack.io diff --git a/build.gradle b/build.gradle new file mode 100644 index 00000000..cee7a83e --- /dev/null +++ b/build.gradle @@ -0,0 +1,17 @@ +buildscript { + repositories { + jcenter() + google() + } + dependencies { + classpath 'com.android.tools.build:gradle:3.4.0' + classpath 'com.github.dcendents:android-maven-gradle-plugin:2.1' + } +} + +allprojects { + repositories { + jcenter() + google() + } +} diff --git a/design/facebook_icon.png b/design/facebook_icon.png Binary files differnew file mode 100644 index 00000000..73181685 --- /dev/null +++ b/design/facebook_icon.png diff --git a/design/feature_graphic.png b/design/feature_graphic.png Binary files differnew file mode 100644 index 00000000..3497c2f7 --- /dev/null +++ b/design/feature_graphic.png diff --git a/design/feature_graphic.psd b/design/feature_graphic.psd Binary files differnew file mode 100644 index 00000000..3088d534 --- /dev/null +++ b/design/feature_graphic.psd diff --git a/design/feature_graphic_smaller.png b/design/feature_graphic_smaller.png Binary files differnew file mode 100644 index 00000000..c1e5db57 --- /dev/null +++ b/design/feature_graphic_smaller.png diff --git a/design/googleplus_icon.png b/design/googleplus_icon.png Binary files differnew file mode 100644 index 00000000..87f27e26 --- /dev/null +++ b/design/googleplus_icon.png diff --git a/design/header_symbol.png b/design/header_symbol.png Binary files differnew file mode 100644 index 00000000..61d46f5a --- /dev/null +++ b/design/header_symbol.png diff --git a/design/ic_launcher.psd b/design/ic_launcher.psd Binary files differnew file mode 100644 index 00000000..378c3ec2 --- /dev/null +++ b/design/ic_launcher.psd diff --git a/design/other/bottom.png b/design/other/bottom.png Binary files differnew file mode 100644 index 00000000..368f3098 --- /dev/null +++ b/design/other/bottom.png diff --git a/design/other/left.png b/design/other/left.png Binary files differnew file mode 100644 index 00000000..03e7404c --- /dev/null +++ b/design/other/left.png diff --git a/design/other/right.png b/design/other/right.png Binary files differnew file mode 100644 index 00000000..9c9ea436 --- /dev/null +++ b/design/other/right.png diff --git a/design/twitter_icon.png b/design/twitter_icon.png Binary files differnew file mode 100644 index 00000000..763cb133 --- /dev/null +++ b/design/twitter_icon.png diff --git a/design/video_thumbnail.png b/design/video_thumbnail.png Binary files differnew file mode 100644 index 00000000..4594b0fa --- /dev/null +++ b/design/video_thumbnail.png diff --git a/gradle.properties b/gradle.properties new file mode 100644 index 00000000..0c0632ee --- /dev/null +++ b/gradle.properties @@ -0,0 +1,3 @@ +android.enableJetifier=true +android.useAndroidX=true +org.gradle.jvmargs=-Xmx2048M diff --git a/gradle/wrapper/gradle-wrapper.jar b/gradle/wrapper/gradle-wrapper.jar Binary files differnew file mode 100644 index 00000000..94114481 --- /dev/null +++ b/gradle/wrapper/gradle-wrapper.jar diff --git a/gradle/wrapper/gradle-wrapper.properties b/gradle/wrapper/gradle-wrapper.properties new file mode 100644 index 00000000..0f8bc4e3 --- /dev/null +++ b/gradle/wrapper/gradle-wrapper.properties @@ -0,0 +1,6 @@ +#Sat Apr 27 15:48:29 CEST 2019 +distributionBase=GRADLE_USER_HOME +distributionPath=wrapper/dists +zipStoreBase=GRADLE_USER_HOME +zipStorePath=wrapper/dists +distributionUrl=https\://services.gradle.org/distributions/gradle-5.1.1-all.zip diff --git a/gradlew b/gradlew new file mode 100755 index 00000000..f6890acb --- /dev/null +++ b/gradlew @@ -0,0 +1,160 @@ +#!/usr/bin/env bash + +############################################################################## +## +## Gradle start up script for UN*X +## +############################################################################## + +# Add default JVM options here. You can also use JAVA_OPTS and GRADLE_OPTS to pass JVM options to this script. +DEFAULT_JVM_OPTS="" + +APP_NAME="Gradle" +APP_BASE_NAME=`basename "$0"` + +# Use the maximum available, or set MAX_FD != -1 to use that yValue. +MAX_FD="maximum" + +warn ( ) { + echo "$*" +} + +die ( ) { + echo + echo "$*" + echo + exit 1 +} + +# OS specific support (must be 'true' or 'false'). +cygwin=false +msys=false +darwin=false +case "`uname`" in + CYGWIN* ) + cygwin=true + ;; + Darwin* ) + darwin=true + ;; + MINGW* ) + msys=true + ;; +esac + +# Attempt to set APP_HOME +# Resolve links: $0 may be a link +PRG="$0" +# Need this for relative symlinks. +while [ -h "$PRG" ] ; do + ls=`ls -ld "$PRG"` + link=`expr "$ls" : '.*-> \(.*\)$'` + if expr "$link" : '/.*' > /dev/null; then + PRG="$link" + else + PRG=`dirname "$PRG"`"/$link" + fi +done +SAVED="`pwd`" +cd "`dirname \"$PRG\"`/" >/dev/null +APP_HOME="`pwd -P`" +cd "$SAVED" >/dev/null + +CLASSPATH=$APP_HOME/gradle/wrapper/gradle-wrapper.jar + +# Determine the Java command to use to start the JVM. +if [ -n "$JAVA_HOME" ] ; then + if [ -x "$JAVA_HOME/jre/sh/java" ] ; then + # IBM's JDK on AIX uses strange locations for the executables + JAVACMD="$JAVA_HOME/jre/sh/java" + else + JAVACMD="$JAVA_HOME/bin/java" + fi + if [ ! -x "$JAVACMD" ] ; then + die "ERROR: JAVA_HOME is set to an invalid directory: $JAVA_HOME + +Please set the JAVA_HOME variable in your environment to match the +location of your Java installation." + fi +else + JAVACMD="java" + which java >/dev/null 2>&1 || die "ERROR: JAVA_HOME is not set and no 'java' command could be found in your PATH. + +Please set the JAVA_HOME variable in your environment to match the +location of your Java installation." +fi + +# Increase the maximum file descriptors if we can. +if [ "$cygwin" = "false" -a "$darwin" = "false" ] ; then + MAX_FD_LIMIT=`ulimit -H -n` + if [ $? -eq 0 ] ; then + if [ "$MAX_FD" = "maximum" -o "$MAX_FD" = "max" ] ; then + MAX_FD="$MAX_FD_LIMIT" + fi + ulimit -n $MAX_FD + if [ $? -ne 0 ] ; then + warn "Could not set maximum file descriptor limit: $MAX_FD" + fi + else + warn "Could not query maximum file descriptor limit: $MAX_FD_LIMIT" + fi +fi + +# For Darwin, add options to specify how the application appears in the dock +if $darwin; then + GRADLE_OPTS="$GRADLE_OPTS \"-Xdock:name=$APP_NAME\" \"-Xdock:icon=$APP_HOME/media/gradle.icns\"" +fi + +# For Cygwin, switch paths to Windows format before running java +if $cygwin ; then + APP_HOME=`cygpath --path --mixed "$APP_HOME"` + CLASSPATH=`cygpath --path --mixed "$CLASSPATH"` + JAVACMD=`cygpath --unix "$JAVACMD"` + + # We build the pattern for arguments to be converted via cygpath + ROOTDIRSRAW=`find -L / -maxdepth 1 -mindepth 1 -type d 2>/dev/null` + SEP="" + for dir in $ROOTDIRSRAW ; do + ROOTDIRS="$ROOTDIRS$SEP$dir" + SEP="|" + done + OURCYGPATTERN="(^($ROOTDIRS))" + # Add a user-defined pattern to the cygpath arguments + if [ "$GRADLE_CYGPATTERN" != "" ] ; then + OURCYGPATTERN="$OURCYGPATTERN|($GRADLE_CYGPATTERN)" + fi + # Now convert the arguments - kludge to limit ourselves to /bin/sh + i=0 + for arg in "$@" ; do + CHECK=`echo "$arg"|egrep -c "$OURCYGPATTERN" -` + CHECK2=`echo "$arg"|egrep -c "^-"` ### Determine if an option + + if [ $CHECK -ne 0 ] && [ $CHECK2 -eq 0 ] ; then ### Added a condition + eval `echo args$i`=`cygpath --path --ignore --mixed "$arg"` + else + eval `echo args$i`="\"$arg\"" + fi + i=$((i+1)) + done + case $i in + (0) set -- ;; + (1) set -- "$args0" ;; + (2) set -- "$args0" "$args1" ;; + (3) set -- "$args0" "$args1" "$args2" ;; + (4) set -- "$args0" "$args1" "$args2" "$args3" ;; + (5) set -- "$args0" "$args1" "$args2" "$args3" "$args4" ;; + (6) set -- "$args0" "$args1" "$args2" "$args3" "$args4" "$args5" ;; + (7) set -- "$args0" "$args1" "$args2" "$args3" "$args4" "$args5" "$args6" ;; + (8) set -- "$args0" "$args1" "$args2" "$args3" "$args4" "$args5" "$args6" "$args7" ;; + (9) set -- "$args0" "$args1" "$args2" "$args3" "$args4" "$args5" "$args6" "$args7" "$args8" ;; + esac +fi + +# Split up the JVM_OPTS And GRADLE_OPTS values into an array, following the shell quoting and substitution rules +function splitJvmOpts() { + JVM_OPTS=("$@") +} +eval splitJvmOpts $DEFAULT_JVM_OPTS $JAVA_OPTS $GRADLE_OPTS +JVM_OPTS[${#JVM_OPTS[*]}]="-Dorg.gradle.appname=$APP_BASE_NAME" + +exec "$JAVACMD" "${JVM_OPTS[@]}" -classpath "$CLASSPATH" org.gradle.wrapper.GradleWrapperMain "$@" diff --git a/gradlew.bat b/gradlew.bat new file mode 100644 index 00000000..b411ee1f --- /dev/null +++ b/gradlew.bat @@ -0,0 +1,90 @@ +@if "%DEBUG%" == "" @echo off
+@rem ##########################################################################
+@rem
+@rem Gradle startup script for Windows
+@rem
+@rem ##########################################################################
+
+@rem Set local scope for the variables with windows NT shell
+if "%OS%"=="Windows_NT" setlocal
+
+@rem Add default JVM options here. You can also use JAVA_OPTS and GRADLE_OPTS to pass JVM options to this script.
+set DEFAULT_JVM_OPTS=
+
+set DIRNAME=%~dp0
+if "%DIRNAME%" == "" set DIRNAME=.
+set APP_BASE_NAME=%~n0
+set APP_HOME=%DIRNAME%
+
+@rem Find java.exe
+if defined JAVA_HOME goto findJavaFromJavaHome
+
+set JAVA_EXE=java.exe
+%JAVA_EXE% -version >NUL 2>&1
+if "%ERRORLEVEL%" == "0" goto init
+
+echo.
+echo ERROR: JAVA_HOME is not set and no 'java' command could be found in your PATH.
+echo.
+echo Please set the JAVA_HOME variable in your environment to match the
+echo location of your Java installation.
+
+goto fail
+
+:findJavaFromJavaHome
+set JAVA_HOME=%JAVA_HOME:"=%
+set JAVA_EXE=%JAVA_HOME%/bin/java.exe
+
+if exist "%JAVA_EXE%" goto init
+
+echo.
+echo ERROR: JAVA_HOME is set to an invalid directory: %JAVA_HOME%
+echo.
+echo Please set the JAVA_HOME variable in your environment to match the
+echo location of your Java installation.
+
+goto fail
+
+:init
+@rem Get command-line arguments, handling Windowz variants
+
+if not "%OS%" == "Windows_NT" goto win9xME_args
+if "%@eval[2+2]" == "4" goto 4NT_args
+
+:win9xME_args
+@rem Slurp the command line arguments.
+set CMD_LINE_ARGS=
+set _SKIP=2
+
+:win9xME_args_slurp
+if "xPx%~1" == "xPx" goto execute
+
+set CMD_LINE_ARGS=%*
+goto execute
+
+:4NT_args
+@rem Get arguments from the 4NT Shell from JP Software
+set CMD_LINE_ARGS=%$
+
+:execute
+@rem Setup the command line
+
+set CLASSPATH=%APP_HOME%\gradle\wrapper\gradle-wrapper.jar
+
+@rem Execute Gradle
+"%JAVA_EXE%" %DEFAULT_JVM_OPTS% %JAVA_OPTS% %GRADLE_OPTS% "-Dorg.gradle.appname=%APP_BASE_NAME%" -classpath "%CLASSPATH%" org.gradle.wrapper.GradleWrapperMain %CMD_LINE_ARGS%
+
+:end
+@rem End local scope for the variables with windows NT shell
+if "%ERRORLEVEL%"=="0" goto mainEnd
+
+:fail
+rem Set variable GRADLE_EXIT_CONSOLE if you need the _script_ return code instead of
+rem the _cmd.exe /c_ return code!
+if not "" == "%GRADLE_EXIT_CONSOLE%" exit 1
+exit /b 1
+
+:mainEnd
+if "%OS%"=="Windows_NT" endlocal
+
+:omega
diff --git a/screenshots/AndroidWeekly_Issue114_10082014.png b/screenshots/AndroidWeekly_Issue114_10082014.png Binary files differnew file mode 100644 index 00000000..0454099b --- /dev/null +++ b/screenshots/AndroidWeekly_Issue114_10082014.png diff --git a/screenshots/MPAndroidChart_trending.png b/screenshots/MPAndroidChart_trending.png Binary files differnew file mode 100644 index 00000000..d2ba40d8 --- /dev/null +++ b/screenshots/MPAndroidChart_trending.png diff --git a/screenshots/ValueFormatter.jpg b/screenshots/ValueFormatter.jpg Binary files differnew file mode 100644 index 00000000..48aa4d0d --- /dev/null +++ b/screenshots/ValueFormatter.jpg diff --git a/screenshots/barchart2d.png b/screenshots/barchart2d.png Binary files differnew file mode 100644 index 00000000..6ee54805 --- /dev/null +++ b/screenshots/barchart2d.png diff --git a/screenshots/barchart2d_multi_dataset.png b/screenshots/barchart2d_multi_dataset.png Binary files differnew file mode 100644 index 00000000..ac185caa --- /dev/null +++ b/screenshots/barchart2d_multi_dataset.png diff --git a/screenshots/barchart2d_multi_dataset_date1.png b/screenshots/barchart2d_multi_dataset_date1.png Binary files differnew file mode 100644 index 00000000..7b3a9c31 --- /dev/null +++ b/screenshots/barchart2d_multi_dataset_date1.png diff --git a/screenshots/barchart2d_multi_dataset_date2.png b/screenshots/barchart2d_multi_dataset_date2.png Binary files differnew file mode 100644 index 00000000..b5719243 --- /dev/null +++ b/screenshots/barchart2d_multi_dataset_date2.png diff --git a/screenshots/barchart3d.png b/screenshots/barchart3d.png Binary files differnew file mode 100644 index 00000000..ec17dd96 --- /dev/null +++ b/screenshots/barchart3d.png diff --git a/screenshots/bubblechart.png b/screenshots/bubblechart.png Binary files differnew file mode 100644 index 00000000..e8416be8 --- /dev/null +++ b/screenshots/bubblechart.png diff --git a/screenshots/candlestickchart.png b/screenshots/candlestickchart.png Binary files differnew file mode 100644 index 00000000..0dce18ab --- /dev/null +++ b/screenshots/candlestickchart.png diff --git a/screenshots/candlestickchart_old.png b/screenshots/candlestickchart_old.png Binary files differnew file mode 100644 index 00000000..e12f8c28 --- /dev/null +++ b/screenshots/candlestickchart_old.png diff --git a/screenshots/combined_chart.png b/screenshots/combined_chart.png Binary files differnew file mode 100644 index 00000000..0e251c11 --- /dev/null +++ b/screenshots/combined_chart.png diff --git a/screenshots/cubiclinechart.png b/screenshots/cubiclinechart.png Binary files differnew file mode 100644 index 00000000..3c2d2d5a --- /dev/null +++ b/screenshots/cubiclinechart.png diff --git a/screenshots/grouped_barchart_wiki.png b/screenshots/grouped_barchart_wiki.png Binary files differnew file mode 100644 index 00000000..c4d9e668 --- /dev/null +++ b/screenshots/grouped_barchart_wiki.png diff --git a/screenshots/groupedbarchart.png b/screenshots/groupedbarchart.png Binary files differnew file mode 100644 index 00000000..310b16a0 --- /dev/null +++ b/screenshots/groupedbarchart.png diff --git a/screenshots/horizontal_barchart.png b/screenshots/horizontal_barchart.png Binary files differnew file mode 100644 index 00000000..b9d59600 --- /dev/null +++ b/screenshots/horizontal_barchart.png diff --git a/screenshots/line_chart_gradient.png b/screenshots/line_chart_gradient.png Binary files differnew file mode 100644 index 00000000..2891dcec --- /dev/null +++ b/screenshots/line_chart_gradient.png diff --git a/screenshots/linechart.png b/screenshots/linechart.png Binary files differnew file mode 100644 index 00000000..254a7c24 --- /dev/null +++ b/screenshots/linechart.png diff --git a/screenshots/linechart_colored.png b/screenshots/linechart_colored.png Binary files differnew file mode 100644 index 00000000..659e0f0f --- /dev/null +++ b/screenshots/linechart_colored.png diff --git a/screenshots/linechart_legend.png b/screenshots/linechart_legend.png Binary files differnew file mode 100644 index 00000000..fc28fa37 --- /dev/null +++ b/screenshots/linechart_legend.png diff --git a/screenshots/linechart_multiline.png b/screenshots/linechart_multiline.png Binary files differnew file mode 100644 index 00000000..d717febf --- /dev/null +++ b/screenshots/linechart_multiline.png diff --git a/screenshots/linechart_multiline_color_variations.png b/screenshots/linechart_multiline_color_variations.png Binary files differnew file mode 100644 index 00000000..a2e2b5ec --- /dev/null +++ b/screenshots/linechart_multiline_color_variations.png diff --git a/screenshots/linechart_wiki.png b/screenshots/linechart_wiki.png Binary files differnew file mode 100644 index 00000000..b81f5baf --- /dev/null +++ b/screenshots/linechart_wiki.png diff --git a/screenshots/normal_barchart_wiki.png b/screenshots/normal_barchart_wiki.png Binary files differnew file mode 100644 index 00000000..93479eb3 --- /dev/null +++ b/screenshots/normal_barchart_wiki.png diff --git a/screenshots/piechart_holeradius_space.png b/screenshots/piechart_holeradius_space.png Binary files differnew file mode 100644 index 00000000..204c9c93 --- /dev/null +++ b/screenshots/piechart_holeradius_space.png diff --git a/screenshots/piechart_more_colors.png b/screenshots/piechart_more_colors.png Binary files differnew file mode 100644 index 00000000..f7a119cd --- /dev/null +++ b/screenshots/piechart_more_colors.png diff --git a/screenshots/piechart_selected.png b/screenshots/piechart_selected.png Binary files differnew file mode 100644 index 00000000..923e4fdb --- /dev/null +++ b/screenshots/piechart_selected.png diff --git a/screenshots/piechart_wiki.png b/screenshots/piechart_wiki.png Binary files differnew file mode 100644 index 00000000..deaed361 --- /dev/null +++ b/screenshots/piechart_wiki.png diff --git a/screenshots/radarchart.png b/screenshots/radarchart.png Binary files differnew file mode 100644 index 00000000..2e793136 --- /dev/null +++ b/screenshots/radarchart.png diff --git a/screenshots/realm_wiki.png b/screenshots/realm_wiki.png Binary files differnew file mode 100644 index 00000000..3387c2e1 --- /dev/null +++ b/screenshots/realm_wiki.png diff --git a/screenshots/scatterchart.png b/screenshots/scatterchart.png Binary files differnew file mode 100644 index 00000000..38a4bd96 --- /dev/null +++ b/screenshots/scatterchart.png diff --git a/screenshots/simpledesign_barchart2.png b/screenshots/simpledesign_barchart2.png Binary files differnew file mode 100644 index 00000000..2e5c4ab3 --- /dev/null +++ b/screenshots/simpledesign_barchart2.png diff --git a/screenshots/simpledesign_barchart3.png b/screenshots/simpledesign_barchart3.png Binary files differnew file mode 100644 index 00000000..7042915f --- /dev/null +++ b/screenshots/simpledesign_barchart3.png diff --git a/screenshots/simpledesign_linechart1.png b/screenshots/simpledesign_linechart1.png Binary files differnew file mode 100644 index 00000000..a30bc5d7 --- /dev/null +++ b/screenshots/simpledesign_linechart1.png diff --git a/screenshots/simpledesign_linechart2.png b/screenshots/simpledesign_linechart2.png Binary files differnew file mode 100644 index 00000000..893750c8 --- /dev/null +++ b/screenshots/simpledesign_linechart2.png diff --git a/screenshots/simpledesign_linechart3.png b/screenshots/simpledesign_linechart3.png Binary files differnew file mode 100644 index 00000000..2c3e198f --- /dev/null +++ b/screenshots/simpledesign_linechart3.png diff --git a/screenshots/simpledesign_linechart4.png b/screenshots/simpledesign_linechart4.png Binary files differnew file mode 100644 index 00000000..0cf82d19 --- /dev/null +++ b/screenshots/simpledesign_linechart4.png diff --git a/screenshots/simpledesign_linechart5.png b/screenshots/simpledesign_linechart5.png Binary files differnew file mode 100644 index 00000000..978fda2b --- /dev/null +++ b/screenshots/simpledesign_linechart5.png diff --git a/screenshots/simpledesign_piechart1.png b/screenshots/simpledesign_piechart1.png Binary files differnew file mode 100644 index 00000000..4a5320dd --- /dev/null +++ b/screenshots/simpledesign_piechart1.png diff --git a/screenshots/smart_legends.png b/screenshots/smart_legends.png Binary files differnew file mode 100644 index 00000000..7141314e --- /dev/null +++ b/screenshots/smart_legends.png diff --git a/screenshots/tranding_developers_11_08_2014.png b/screenshots/tranding_developers_11_08_2014.png Binary files differnew file mode 100644 index 00000000..354965d7 --- /dev/null +++ b/screenshots/tranding_developers_11_08_2014.png diff --git a/screenshots/zero_line_example_barchart.png b/screenshots/zero_line_example_barchart.png Binary files differnew file mode 100644 index 00000000..51423856 --- /dev/null +++ b/screenshots/zero_line_example_barchart.png diff --git a/settings.gradle b/settings.gradle new file mode 100644 index 00000000..32efe09d --- /dev/null +++ b/settings.gradle @@ -0,0 +1,7 @@ +include 'MPChartLib' +//include 'MPAndroidChart-Realm' +include 'MPChartExample' +//include ':MPChartLib-Realm' +//project(':MPChartLib-Realm').projectDir = new File('../MPAndroidChart-Realm/MPChartLib-Realm') + + |